Study on Performance and Influencing Factors of H2O2 Production by Bioelectrochemical System
Jiqiang ZHANG


Abstract This study used a bioelectrochemical system (BES) to produce H2O2. Seven cycles after the addition of microorganisms, the BES started successfully and entered a stable operation period. During stable operation, the voltage was 581 mV, the COD removal efficiency at the anode was 85.39%, and the H2O2 mass concentration at the cathode was 0.5%. After the addition of 10% of graphite particles in the reaction chamber, the H2O2 production increased by 13%. After loading Pt-containing carbon black catalyst on the cathode, the H2O2 production increased by 34%. The mass concentration of H2O2 was 0.67% under the optimum process conditions of a cathode loaded with Pt-containing carbon black catalyst, pH=7, and dissolved oxygen of 8 mg/L.
Key words BES; H2O2; Influencing factor; Chemical row material
H2O2 has important applications in medical and water treatment, and it is also an important chemical raw material. The traditional industrial H2O2 production method still has many problems such as complex process, multiple side reactions or high energy consumption[1]. Therefore, it is urgent to research and develop new H2O2 production methods. The bioelectrochemical system (BES) uses the action of microorganisms in sewage to directly convert chemical energy in organic matter into electrical energy, can provide partial electric energy for sewage treatment, and can synthesize important chemical raw material H2O2 at its cathode with oxygen as an electron acceptor[2-3]. The use of BES for H2O2 production not only achieves the purpose of sewage treatment, but also recycles electricity and produces H2O2. This method realizes turning waste into treasure. Therefore, in this study, the H2O2 production performance of BES and its influencing factors were investigated, aiming at developing a new green H2O2 production technology.
Materials and Methods
Experimental equipment
The experimental device was a double chamber BES with an effective volume of 400 ml, using graphite felt as an electrode material, which had the surface area of 100 cm2 . The anode chamber is equipped with simulated organic wastewater, and its basic composition is the basic elements and trace elements required by microorganisms. The concentration of organic matter in the sewage was adjusted by adding a substrate (sodium acetate), and the inoculated sludge was anaerobic granular sludge. The anolyte was mixed evenly with a magnetical stirrer. The catholyte was a solution containing sodium chloride and was aerated by an aeration device[4].
Sample collection and treatment
The hydraulic retention time of the experimental device was 2 d. Before the sampling, the magnetic stirrer and other instruments should be shut down in advance. After the microorganisms were precipitated, 3 ml of the supernatant was added into a centrifuge tube and stored in the refrigerator. The sampled solutions were centrifuged at 2 000 r/s for 5 min before each measurement.
Experimental methods
COD was determined by rapid digestion-spectrophotometry. H2O2 was determined by potassium permanganate titration. pH was measured with an FE20 pH meter (Mettler Toledo, Switzerland). And the voltage date were acquired using an Agilent 34970A data collector[5].
Results and Analysis
Study on BES starting performance
The microorganisms were first inoculated. Into the anolyte, a mixture of anaerobic and aerobiotic microorganisms which accounted for 20% of the volume of the reactor, and the COD stock solution, the NaCl solution and the trace elements of the same concentration and the same volume as in the blank test, were added into the anolyte. The cathode was added with NaCl and tap water. The hydraulic retention time was 2 d. Because microorganisms need to grow on the electrodes, BES needs a process to achieve stable operation. In this process, the COD removal rate in the anode chamber, the H2O2production in the cathode chamber and the power generation performance of the BES were investigated.
When the influent concentration was about the same, the effluent concentration gradually decreased with the increase of the culture period. The effluent concentration change was not obvious within about 7 cycles. At this time, the COD removal rate reached a stable value of 85.39%. The voltage increased gradually with the increase of culture cycles, and the BES was stabilized after about 7 cycles with a voltage at about 581 mV. H2O2 increased slowly in the 2-3 cycles immediately after the addition of microorganisms, because the microorganisms needed to undergo an adaptation period just after the addition[6], and the increase rate of H2O2 was accelerated in the 4-6 cycles after the adaptation, and was stable in the 7th cycle. The H2O2 mass concentration was stable at around 0.5% (Fig. 1).
Study on BES stable operation performance
After the start of BES, all indices tended to be stable. The 12th cycle was selected to analyze the changes of various indices in a cycle, so as to explore the performance of BES in each cycle of the stationary period.
It can be seen from Fig. 2 that the voltage was small after changing the water, and then increased faster, and the maximum voltage reached about 580 mV. After that, the voltage began to drop because the COD was insufficient, some microorganisms could not use the nutritional substances, and the electron transfer began to decrease, resulting in a lowered voltage. In one cycle, the COD removal rate was different, first slow, then fast and finally slow. The initial concentration and end concentration were 1 003.41 and 146.54 mg/L, respectively, and the removal efficiency was 85.40%. A correlation was found between the production of H2O2 and the consumption of COD. The generation of H2O2 was slow at first, then fast and finally slow, and the stable value did not continue to increase, which might be because that COD was almost exhausted and there was no electron transfer, which led to no accumulation of H2O2. The final H2O2 concentration reached 0.49%.
Study on influencing factors of H2O2 production by BES
Effect of cathodic surface area on BES production of H2O2
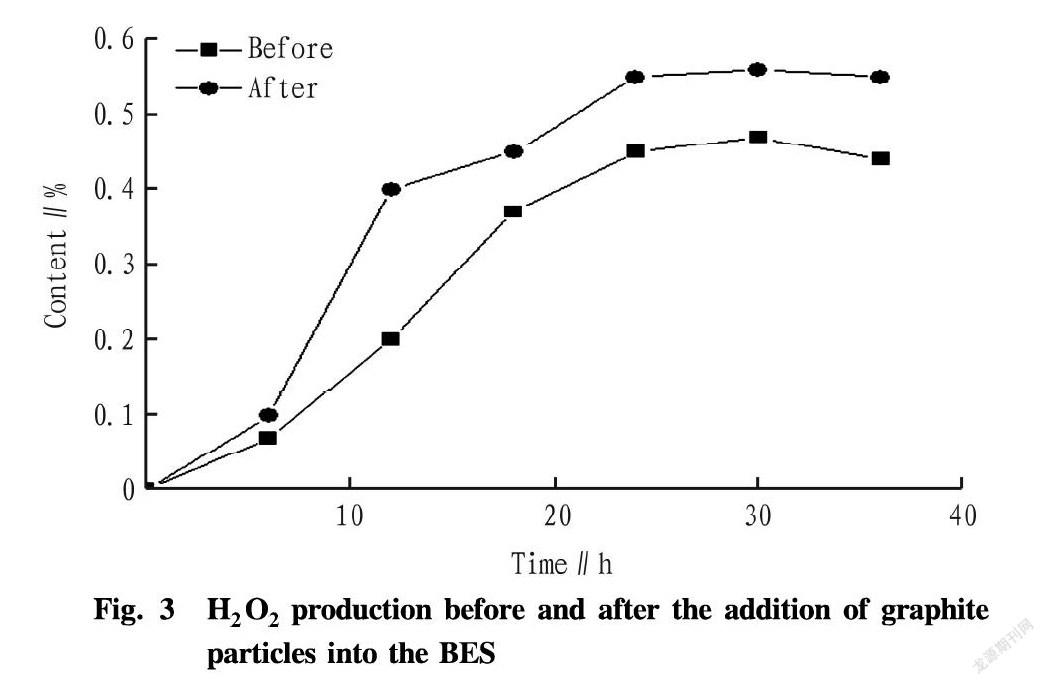
The control variable method was applied to add graphite particles with a diameter of 0.2-1.0 cm which accounted for 10% of the reaction volume into the cathode chamber, thereby increasing the reaction area of the electrode[7]. As can be seen from Fig. 3, the production rate and production amount of H2O2 increased after the addition of graphite particles. The final generation amount of H2O2 after adding graphite particles was 0.56%, which was increased by 12%.
Effect of cathode-supported Pt catalyst on BES production of H2O2
The surface properties of electrodes are important factors affecting the electrochemical reaction of the cathode[8]. For this reason, the effect of cathode-supported Pt-containing catalyst on the production of H2O2 by BES was investigated by loading Pt catalyst on the surface of the cathode graphite particles.
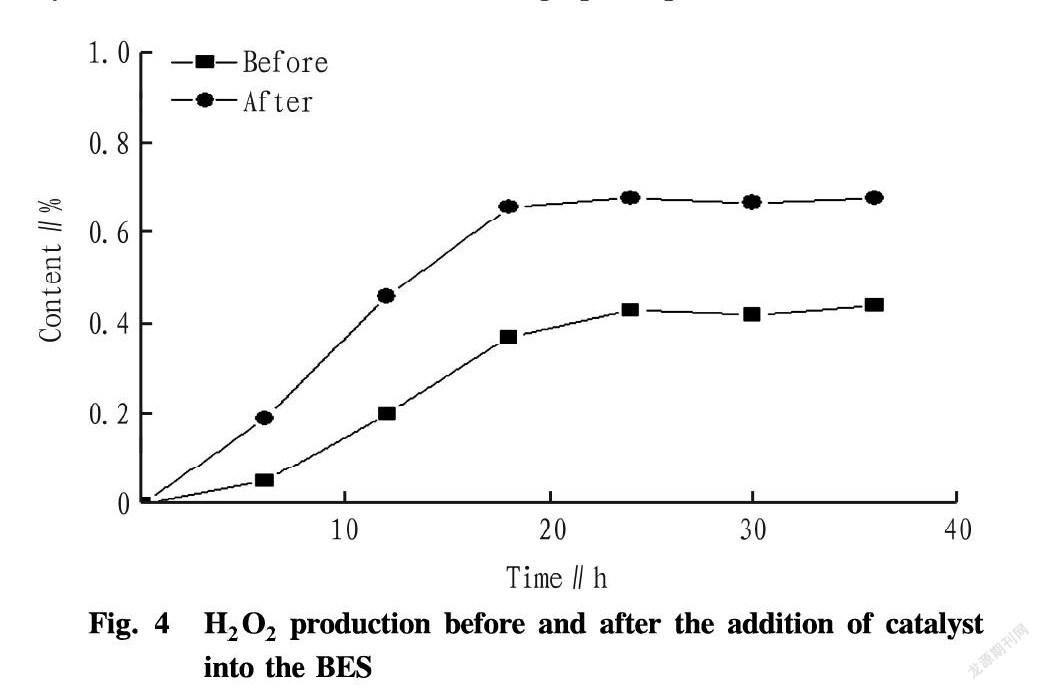
It can be seen from Fig. 4 that after the catalyst was added, the production rate of H2O2 was obviously accelerated, and the time for reaching the maximum yield was shortened. The yield was increased by 35%, and the concentration reached 0.68%. The yield of H2O2 was improved through electrode modification, and the cathode-supported Pt-containing catalyst more obviously improved H2O2 production by BES[9].
Effect of cathode DO on BES production of H2O2
Other conditions were the same as in the previous test, and the cathode oxygenation capacity was changed to explore the optimal DO concentration.
It can be seen from the Fig. 5 that H2O2 in the catholyte gradually increased with the increase of dissolved oxygen. When the oxygenation amount was 8 mg/L, the maximum concentration of H2O2 was reached, being 0.71%, and the H2O2 concentration no longer increased with further increase of the oxygenation amount, which was because that the aeration was too intense and partial H2O2 was lost with the gas[10]. Based on the above results, pH=7 was the optimum pH condition. Under this condition, the H2O2 production was the largest at 0.71% when the dissolved oxygen concentration was 8 mg/L.
Conclusions
The BES needs 7 cycles to reach stable operation. When the BES was in stable operation, the influent COD was about 1 000 mg/L, and the effluent concentration was 150 mg/L; with the connection to the external 1 000 Ω resistor, the output voltage was stabilized at 581 mV; and the H2O2 mass concentration in the cathode chamber was up to 0.5%. Thereby, the effective removal of organic matter, stable output of current and production and utilization of H2O2 can be achieved. In the cathode chamber, 20% of graphite particles having a diameter of 0.2-1.0 cm were added, which increased the reaction contact area, and the H2O2 production increased by 13% and reached 0.56%. The Pt-supporting carbon black particle catalyst was added to the cathode chamber, after which the reaction rate was accelerated, and the H2O2 production was increased by 34% and reached 0.68%. When the dissolved oxygen content was 8 mg/L, the production of H2O2 was the largest, reaching 0.71%.
References
[1]ROZENDAL RA, LEONE E, KELLER J, et al. Efficient hydrogen peroxide generation from organic matter in a bioelectrochemical system[J]. Electrochemistry Communications, 2009, 11(9):1752-1755.
[2]MIRAN W, NAWAZ M, JANG J, et al. Chlorinated phenol treatment and in situ hydrogen peroxide production in a sulfate-reducing bacteria enriched bioelectrochemical system.[J]. Water Research, 2017, 117:198-206.
[3]KUMAR R, SINGH L, ZULARISAM AW, et al. Microbial fuel cell is emerging as a versatile technology: a review on its possible applications, challenges and strategies to improve the performances[J]. International Journal of Energy Research, 2017(8).
[4]ZHANG J, ZHENG P, ZHANG M, et al. Kinetics of substrate degradation and electricity generation in anodic denitrification microbial fuel cell (AD-BES)[J]. Bioresource Technology, 2013, 149: 44-50.
[5]BRUCE E. LOGAN, BERT HAMELERS, RENé ROZENDAL, et al. Microbial Fuel Cells: Methodology and Technology[J]. Environmental Science & Technology, 2006, 40(17):5181-5192.
[6]ASGHAR A, SALIHOUDIN A, ABDUL AAR, et al. Cathode modification to enhance the performance of in-situ fenton oxidation in microbial fuel cells[J]. Environmental Progress & Sustainable Energy, 2017, 36(2).
[7]KODALI M, SANTORO C, HERRERA S, et al. Bimetallic platinum group metal-free catalysts for high power generating microbial fuel cells[J]. Journal of Power Sources, 2017, 366:18-26.
[8]WANG Y, FENG C, YAN L, et al. Enhancement of emerging contaminants removal using fenton reaction driven by H2O2-producing microbial fuel cells[J]. Chemical Engineering Journal, 2017, 307:679-686.
[9]SANTORO C, KODALI M, HERRERA S, et al. Power generation in microbial fuel cells using platinum group metal-free cathode catalyst: Effect of the catalyst loading on performance and costs[J]. Journal of Power Sources, 2018, 378:169-175.
[10]KODALI M, HERRERA S, KABIR S, et al. Enhancement of microbial fuel cell performance by introducing a nano-composite cathode catalyst[J]. Electrochimica Acta, 2018, 265:56-64.
- 农业生物技术(英文版)的其它文章
- Analysis of the Southern China Tilapia Production and Economic Benefits of Different Breeding Patterns in 2018
- Dynamic Monitoring and Control Measures of Spodoptera frugiperda (J.E.Smmith) in Low Latitude Plateau Sugarcane Areas
- Control Effects of a New Sex Pheromone Trap and Biological Agents on Sesamia inferens Walker and Argyroploce schistaceana (Snellen)
- Comparative Study on Grain Cadmium Content and Yield in Different Rice Varieties
- Simulation Experiment of Air Temperature Variation in Multi-film Covering at Night
- Identification of Growth-promoting Bacteria from Rhizosphere of Pastures and Their Effects on Growth of Lotus corniculatus L.

