
A paleo-hydrological simulation experiment and its verification in an inland basin
2019-09-06 01:21YuXinZhangYuLiXinZhongZhangChengQiZhangWangTingYeYuanLiu
YuXin Zhang,Yu Li*,XinZhong Zhang,ChengQi Zhang,WangTing Ye,Yuan Liu
1. Key Laboratory of Western China's Environmental Systems (Ministry of Education), College of Earth and Environmental Sciences, Center for Hydrologic Cycle and Water Resources in Arid Region, Lanzhou University, Lanzhou, Gansu 730000,China
2. Key Laboratory of Ecohydrology of Inland River Basin/Gansu Hydrology and Water Resources Engineering Research Center,Northwest Institute of Eco-Environment and Resources,Chinese Academy of Sciences,Lanzhou,Gansu 730000,China
ABSTRACT Hydrological circulation, as the most basic material cycle and active natural phenomenon on earth, exerts a significant influence on climate change. The mid-Holocene is an important period to better understand modern environmental change;however, little research has focused on its quantitative simulation of paleo-hydrological process. In this research, we first collected chronological evidence and sediment records from six Holocene sedimentary sections in the Shiyang River Basin to reconstruct the mid-Holocene environment and terminal paleo-lake area. Secondly, we comprehensively analyzed modern pollen combinations and their propagation characteristics in surface soil, air, river and lacustrine sediments in the Shiyang River Basin,and combined the pollen records,as well as quantitatively reconstructed the millennial-scale vegetation zones.Finally,based on the land-cover adjustment results during the mid-Holocene,we successfully used the Soil and Water Assessment Tool (SWAT) model, a modern distributed hydrological watershed model, to simulate mid-Holocene runoff in the basin. Results show that the reconstructed climate in the basin was warmer and moister than that in recent times.Vegetation types in the mid-Holocene mainly consisted of sub-alpine shrub distributed between 2,550 m and 2,750 m,forest at an elevation of 2,550-2,750 m,steppe at an elevation of 1,550-2,150 m and desert steppe below 1,550 m.The upstream, midstream, downstream and average annual runoff of the mid-Holocene in the basin were 16.76×10⁸ m3, 22.86×10⁸ m3, 9.00×10⁸ m3 and 16.20×10⁸ m3 respectively, compared to 15.61×10⁸ m3 of modern annual runoff.Also, the area of terminal paleo-lake in the mid-Holocene was 628 km2.Thus, this study provides a new quantitative method for paleo-hydrological simulation.
Keywords:SWAT model;inland basin;vegetation reconstruction;runoff simulation;mid-Holocene
1 Introduction
The mid-Holocene, which is defined as "Holocene Climatic Optimum" between about 8,000 a and about 6,000 a, is an important period in paleo-climate studies (Shi et al., 1994; Long et al., 2007; Liu et al.,2012; Xiao et al., 2014;Anwar et al., 2017; Luoto et al., 2018). Hydrological cycle plays a significant role in nearly all processes of earth surface and ecological systems, and many studies suggest that global climate profoundly influences the hydrological cycle (Barron et al., 1989; Ohmura and Wild, 2002; Hua et al.,2013; Törnqvist et al., 2014; Cerlini et al., 2017; Reuter et al., 2018). Therefore, research on the simulation of paleo-hydrology during the mid-Holocene will help us to better understand the processes and mechanisms of paleo-climate change. There are numerous studies on paleo-hydrological simulation,such as Qin (1997) constructed an energy-water balance model by deriving the function of lake level change related to the change in precipitation and evaporation in the lake basin. And he concluded that runoff of Qinghai paleo-lake in the mid-Holocene was 34.41×10⁸m3,higher than that of today.Guo et al.(2000) suggested that water levels reached 1,320 m and 1,314 m in 5,000 a B.P.and 3,600 a B.P.during the Holocene, and terminal lake areas were 2,130 km2and 870 km2by combining techniques of GIS with deposits in the lower reaches of the Shiyang River. Zhao et al. (2007) used the hydrological and energy-balance model to calculate paleo-lake area and paleo-rainfall in Shiyang River during 6,700-5,800 a B.P., and results show that the paleo-lake area was 581 km2and paleo-rainfall was 292 mm/a.Vance et al. (1993) analyzed pollen,plant macrofossils,sediment mineralogy, geochemistry, and lithology of cores from Chappice Lake, southeastern Alberta, Canada, and suggested that the lake had experienced significant changes in water level and chemistry during the Holocene. Brahney et al. (2010) suggested that Kluane Lake was regularly open hydrologically between 5,000 cal. a B.P. and 1,000 cal. a B.P. with substantially lower water levels by reconstructing lake water δ18O using sediment cellulose.
Previous studies have successfully reconstructed the paleo-climate and paleo-hydrology by mainly using water and energy balance models and climatic proxies. However, on the basis of water balance model, a distributed hydrological and continuous simulation watershed model—SWAT model, has been widely used in simulating the hydrological process of recent times (Jha et al., 2006; Zhang et al., 2012a).However,the SWAT model is barely used in the study of paleo-hydrological simulation due to the lack of land-use/land-cover data in the Holocene. From this perspective and based on previous studies, we tried to place a modern hydrological model into a paleo-hydrological simulation. We synthesized the characteristics of modern pollen propagation and pollen records from eight Holocene sedimentary sections in the study area to reconstruct the vegetation zones on a millennial scale. We then adjusted the modern landuse/land-cover data based on Holocene vegetation types, which can be treated as the basic data for running the SWAT model (Zhang and Li, 2016; Zhang,2017). Here, we selected the Shiyang River Basin as the study site, which is a typical arid inland basin of China that faces a series of ecological problems.Much work has been carried out on hydrology and climate change in the basin during the Holocene and the present era (Chen et al., 2006; Xue and Wang, 2008;Mischke et al., 2016; Wang et al., 2016; Li et al.,2017b).
Analysis of lake sediments (Meyers and Ishiwatari, 1993; Meyers, 2003; Zhang et al., 2011; Vachula et al., 2017), river sediments (Ingram and Sloan,1992;Krom et al.,2002;Li et al.,2017a),eolian sediments (Sun et al., 1998; Busacca et al., 2003; Li et al., 2011), carbonates (Clark and Jean-Charles, 1990;Eiler, 2011; Lettéron et al., 2017), total organic carbon and carbon/nitrogen ratio (Long, 2007; Badejo et al., 2014), as well as pollen records (Liu et al., 2002;Li et al., 2014a; Babich et al., 2015) is a common mean to reconstruct past environmental changes. We used the aforementioned climatic proxies to reconstruct mid-Holocene environment changes in the Shiyang River Basin to verify the response of paleo-climate change to paleo-hydrological change. The Arc-GIS spatial analysis software was also applied to quantitatively reconstruct the terminal lake area in the basin during the mid-Holocene. This experiment can help not only provide quantitative data for paleo-hydrological process, but also propose a new method for runoff simulation of paleo-hydrology.
2 Study area
The Shiyang River drainage basin is located in the eastern portion of the Hexi Corridor which is a narrow channel between Qinghai-Tibetan Plateau and the Gobi Desert in northwest China. The basin is adjacent to the Yellow River and Heihe River basins,with a total area of approximately 41,600 km2(Figure 1). Altitudes in the basin range from 5,200 m in the southwest to 1,200 m in the northeast and span over three climatic zones (Table 1). Three climatic zones from south to north are frigid and semi-humid Qilian Mountains, cool and arid Wuwei sub-basin, warm and more arid Minqin sub-basin (Huo et al., 2008; Ma et al., 2008b; Li and Liu, 2017). Shiyang River originates from Qilian Mountains and includes eight tributaries—Dajing, Gulang, Huangyang, Zamu, Jinta,Xiying, Dongda and Xida as well as several small creeks. River water supplies mainly rely on atmospheric precipitation, snow and glacier meltwater from the high-mountains. Total water resource in the basin is 16.61×10⁸m3/a,of which surface runoff is about 15.61×10⁸m3/a, and groundwater is about 1.00×10⁸m3/a(Tong et al.,2007).
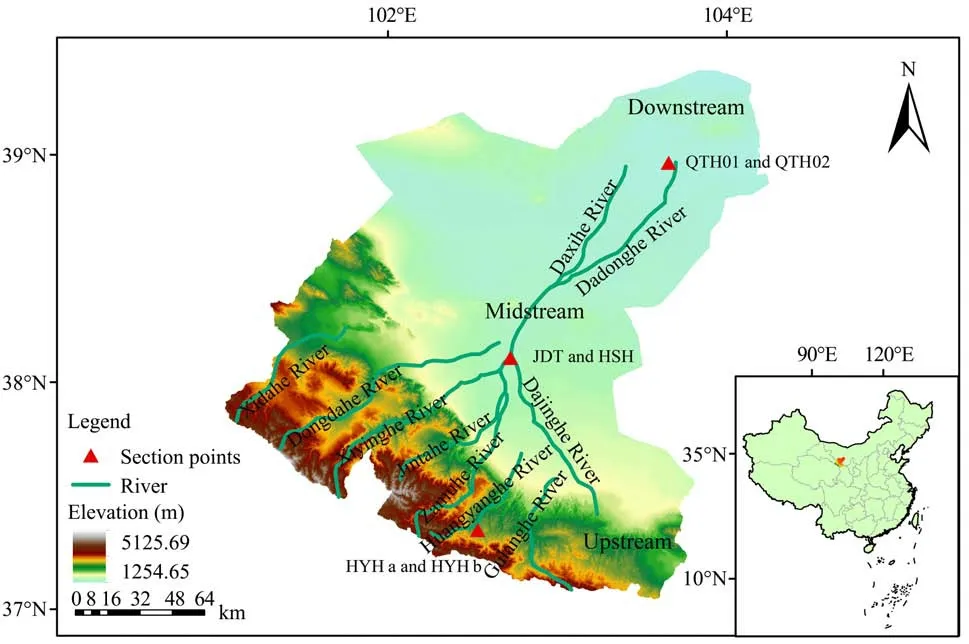
Figure 1 The locations of sections and drainage system in the Shiyang River Basin

Table 1 Elevation,mean annual temperature,precipitation and potential evaporation of three zones in the Shiyang River Basin
3 Data, materials and simulations
3.1 Paleo-environment reconstruction of the Shiyang River Basin in the mid-Holocene
Records from eolian, river and lake sediments can provide ideal materials to reconstruct paleo-environment changes, such as carbonate content, grain size, organic carbon isotope δ13C, carbonate δ18O and other geochemical proxies. In the upper reaches of the Shiyang River Basin (Figure 1), HYH a (37°25′N,102°36′E,Altitude:2,447 m,Depth:3.20 m)and HYH b(37°25′N,102°36′E,Altitude:2,454 m,Depth:3.20 m)sections were sampled at 2 cm intervals, yielding 160 samples for analysis of total organic carbon (TOC),carbonate content(CC),and grain size(Li et al.,2015).In the middle basin, section JDT (38°10′N, 102°45′E,Altitude: 1,460 m, Depth: 5.80 m) was sampled at 10 cm intervals for 580.0-542.5 cm, at 5 cm intervals for 542.5-302.5 cm, and at 10 cm intervals between 302.5 cm and topsoil, resulting in a total of 63 samples(Li et al., 2014b). Section HSH (38°10′N, 102°45′E,Altitude: 1,460 m, Depth: 6.20 m) was sampled at 10 cm intervals for 620-500 cm and at 5 cm intervals between 500 cm and surface soil, resulting in a total of 101 samples (Zhang et al., 2000). In the terminal lake region, QTH01 (39°03′N, 103°40′E, Altitude:1,309 m, Depth: 6.92 m) and QTH02 (39°03′N, 103°40′E,Altitude:1,309 m,Depth:7.36 m) sections were both sampled at 2 cm intervals in lacustrine sediment layers and at 5 cm intervals in other parts (Li et al.,2011, 2014a). A total of 292 samples were collected in the QTH section, which were used for the analysis of TOC, carbon and nitrogen ratio (C/N) and organic carbon isotope (δ13C). Lithological description, age,particle-size analysis,geochemical indicators and mineral components of the six sediment profiles involved in this study are presented in the aforementioned references.
3.2 Paleo-vegetation reconstruction for the mid-Holocene
We comprehensively analyzed the modern pollen combinations and their propagation characteristics in surface soil, air, river and lacustrine sediments in the Shiyang River Basin, and combined the pollen records, as well as quantitatively reconstructed the millennial-scale vegetation zones by defining a new pollen-precipitation index P. Pollen came from different propagation media along the Qilian Mountains to the terminal lake region,including 76 surface soil,28 lake sediment,17 river and 8 air samples(Zhu et al.,2002,2003; Chen et al., 2006). According to the distribution of modern vegetation in the Shiyang River Basin and the assessment of surrounding vegetation during the collection period of modern samples, the whole basin can be divided into six vegetation zones:sub-alpine shrub (C), forest (D), steppe (E), desert steppe(F), desert (G) and sand desert (H). We selected 12 species which were widely distributed, and their contents were relatively high, such as Artemisia, Betula,Chenopodiaceae, Compositae, Ephedra, Gramineae,Nitraria, Picea, Pinus, Rhamnaceae, Sabina and Selaginella.According to the pollen assemblage and the distribution of modern vegetation in the whole basin,the aforementioned 12 pollen types can be divided into the following three ecological groups: Group One came from the mountain vegetation zone. Group Two came from the wilderness vegetation zone. Group Three came from the entire basin. The average percentage of each pollen type in different media of six vegetation zones is presented in Table 2.
We divided the Shiyang River Basin into six segments from upstream to downstream according to the mid-altitude value of vegetation types.The six segments were 3,400, 3,100, 2,300, 1,750, 1,400 and 1,200 m.The mid-altitude value of each segment represented the position information of this segment, which corresponds to the average percentage of modern pollen.We then used these data to produce a mathematical analysis(Zhang and Li,2016;Zhang,2017).
3.2.1 Mathematical analysis
Each pollen profile in the Shiyang River Basin is from lacustrine sediment,therefore,pollen data of modern surface soil need to be corrected in order to accurately reflect the relationship between pollen and vegetation types during the mid-Holocene. Here, taking Picea as an example, its initial corrected data in a vegetation zone can be calculated by the following formula:

where S and R are the content of Picea in the surface soil and river samples, respectively. With the correction factor A=RAVER/SAVER, the six vegetation zones were A1=1,A2=1.11,A3=1.09,A4=1.33,A5=1.96 and A6=9.77. Then the abnormal values in the data were corrected or eliminated, and finally we obtained the pollen corrected data of modern surface soil in the Shiyang River Basin.
We then classified the corrected modern pollen data into six groups, R1 to R6 according to the actual vegetation types where the sampling points are located, and six groups in turn represent sub-alpine shrub vegetation zone (C), forest vegetation zone (D),steppe vegetation zone (E), desert steppe vegetation zone (F), desert vegetation zone (G) and sand desert vegetation zone (H). Discriminant analysis was performed using the SPSS 19.0 program and the results are presented in Table 3.
(C for sub-alpine scrub vegetation zone;D for forest vegetation zone; E for steppe vegetation zone; F for desert steppe vegetation zone;G for desert vegetation zone;H for sand desert vegetation zone)
In order to study the relationship between different species of pollen in modern surface soil,hierarchical cluster analysis (HCA) was applied. All pollen types can be apparently divided into two groups(Group A and Group B) at a Euclidean distance of 20.Group A was dominated by pollen of herbs or shrubs in arid regions, including Nitraria, Ephedra,Artemisia, Chenopodiaceae, Gramineae and Betula. According to the clustering distance, Group A can be divided into three subgroups.A1: Betula, Nitraria and Chenopodiaceae; A2: Artemisia and Gramineae; A3: Ephedra.Group B included Pinus,Rhamnaceae,Picea,Sabina,Selaginella and Compositae.
We also used the PROXSCAL method (Proxscal Version 1.0 by Data Theory Scaling System Group(DTSS) Faculty of Social and Behavioral Sciences Leiden University, The Netherlands) and the Multidimensional scaling analysis of Euclidean distance squared measurement to analyze the spatial similarities of environmental significance (Commandeur and Heiser, 1993). The results were consistent with the HCA analysis, and all pollen can be divided into four groups: S1, which represented the cold and wet environment, including Pinus, Picea and Rhamnaceae;S2, which represented the cold and dry environment,including Betula, Nitraria and Ephedra; S3, which represented the warm and wet environment, including Compositae, Sabina and Selaginella; S4, which represented the warm and dry environment, including Chenopodiaceae,Artemisia and Gramineae.
3.2.2 Establishment of the pollen-precipitation index P
Multiple pollen ratios as environmental indicators have been widely used in climate reconstruction in different regions of the world (Ma et al., 2008a).Based on the aforementioned mathematical analysis,we proposed a new kind of pollen-precipitation index.Therefore, we selected 11 types of representative pollen, and divided them into six pollen-climate groups(Table 4), the pollen-precipitation index P was calculated as follows:

Mean annual precipitation from 1959 to 2006 and elevation data from four meteorological stations (Table 5), Wushaoling, Yongchang, Wuwei and Minqin in the Shiyang River Basin, were used for linear regression analysis(R2=0.979,sig=0.011).We then obtained the equation regarding mean annual precipitation Pr and elevation E:

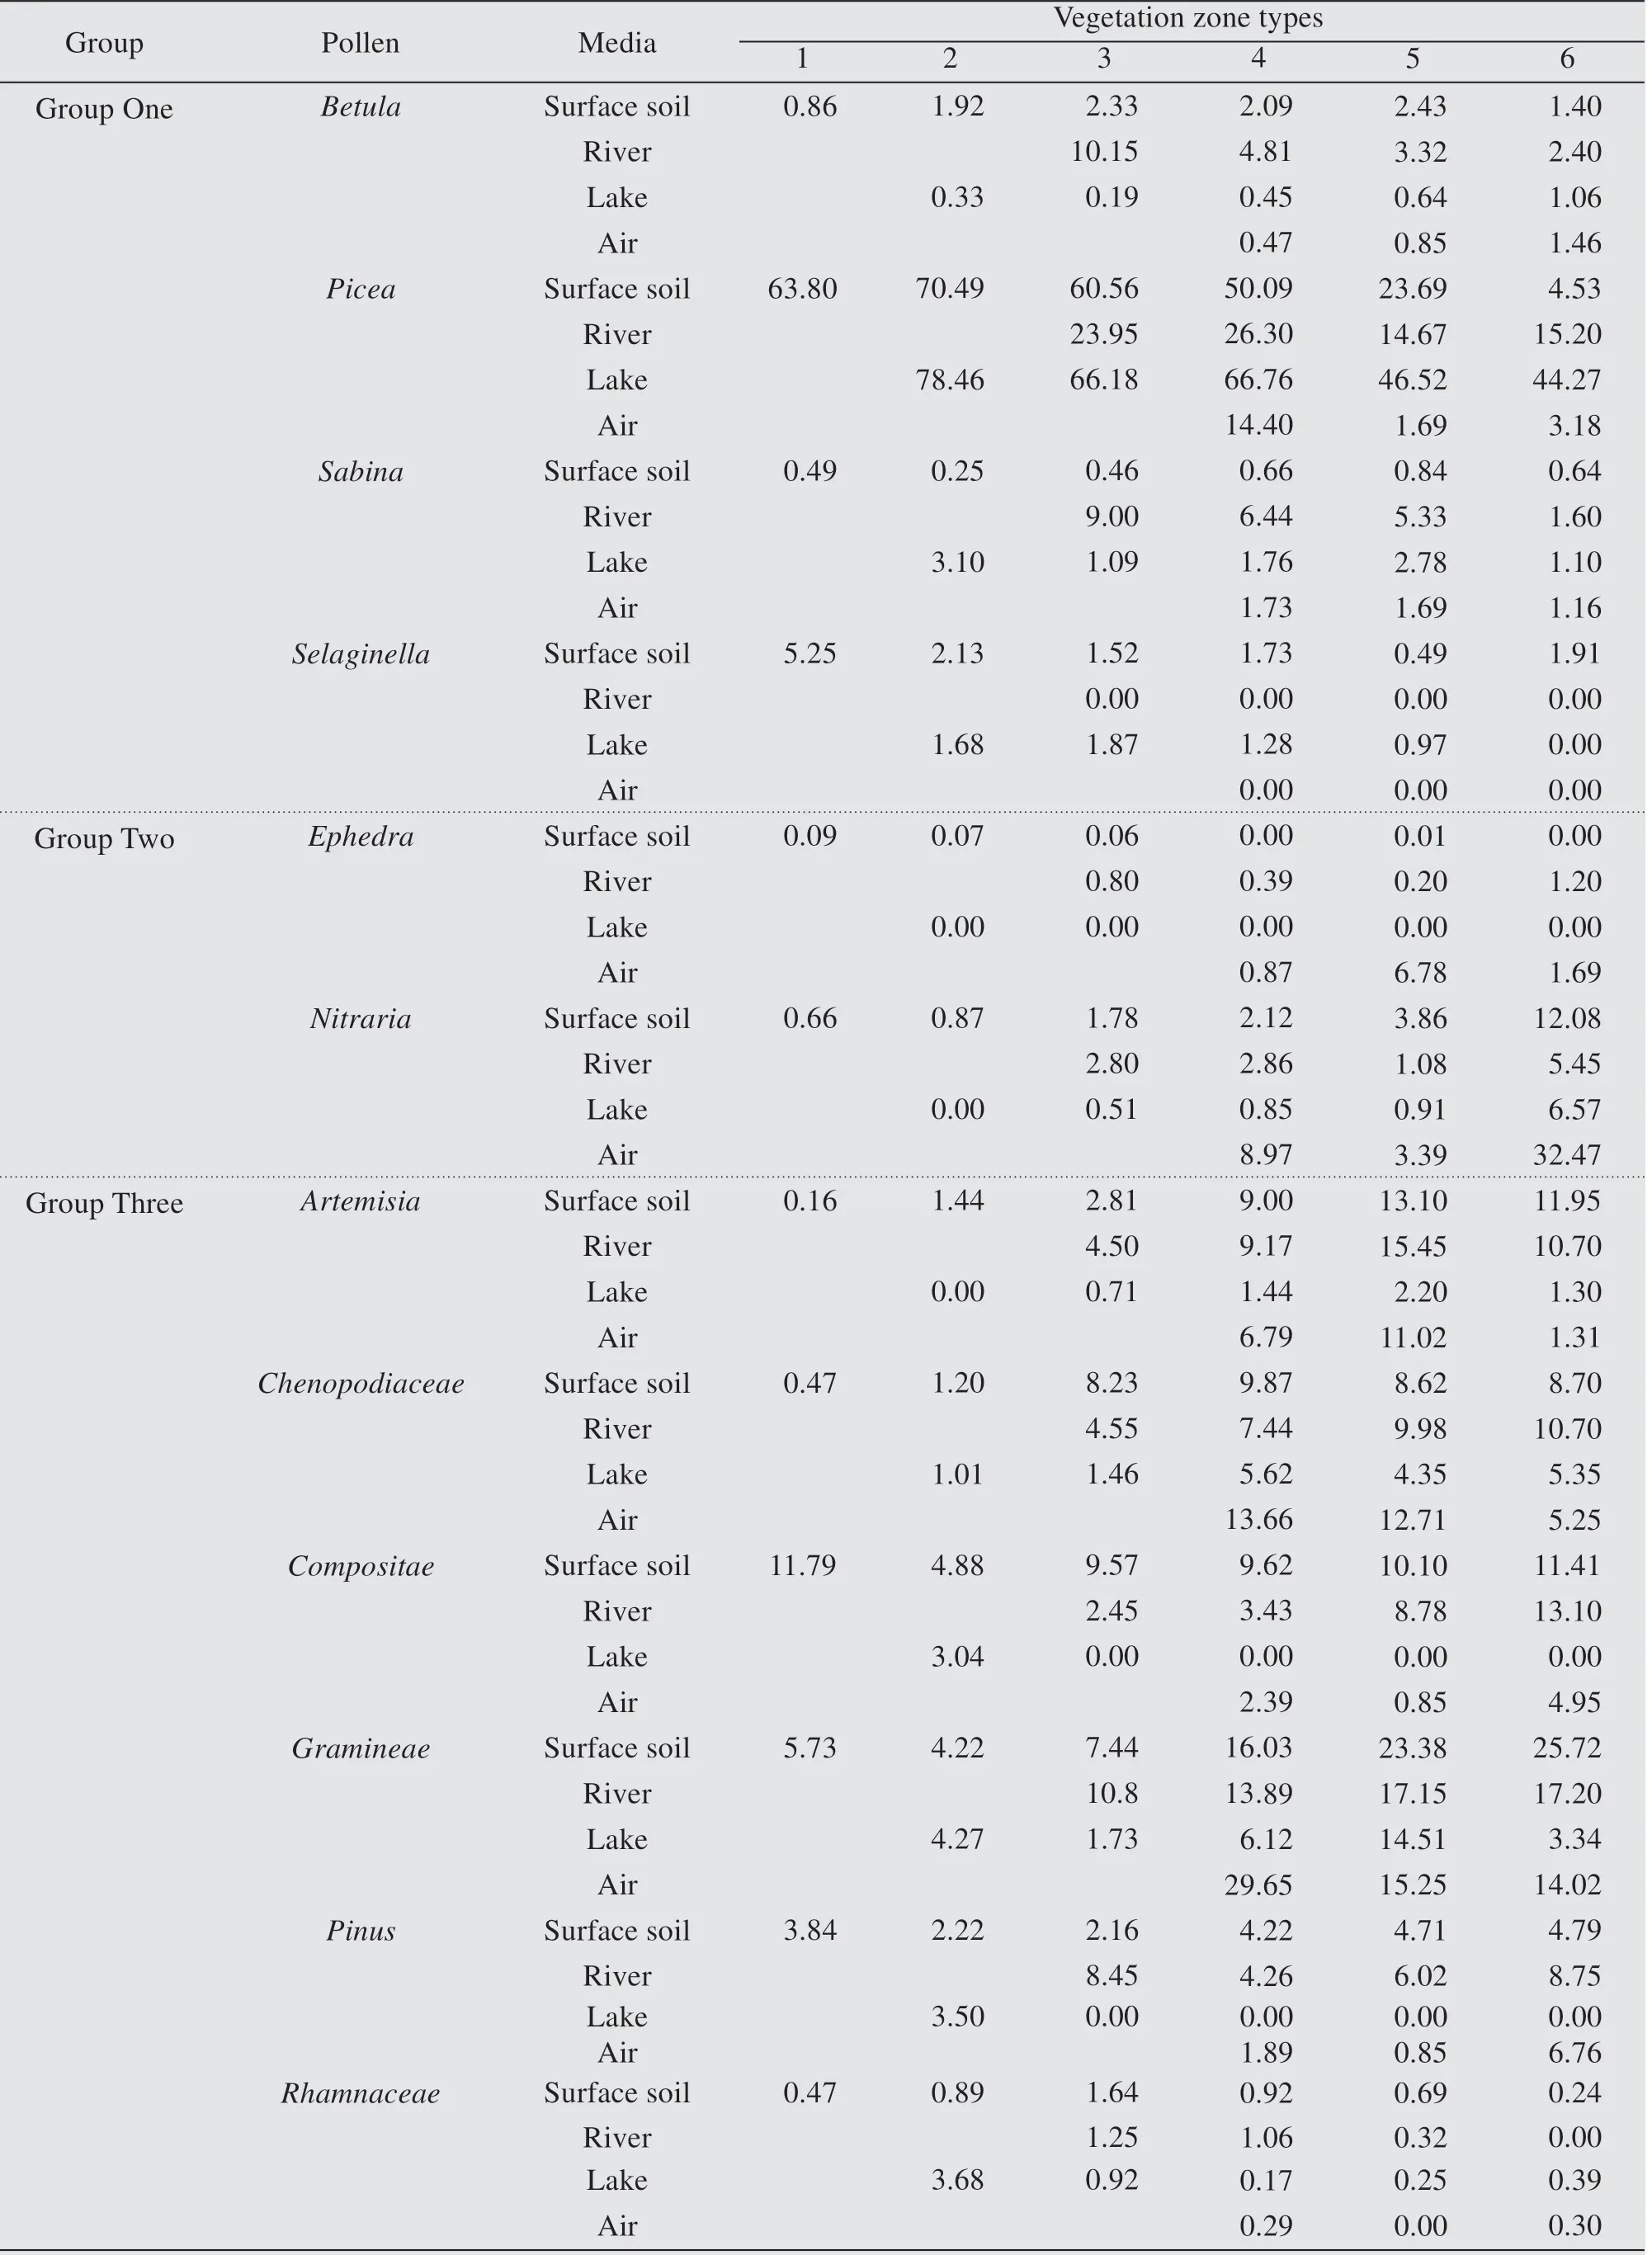
Table 2 The average percentage and transport characteristics of each pollen type in different media of six vegetation zones
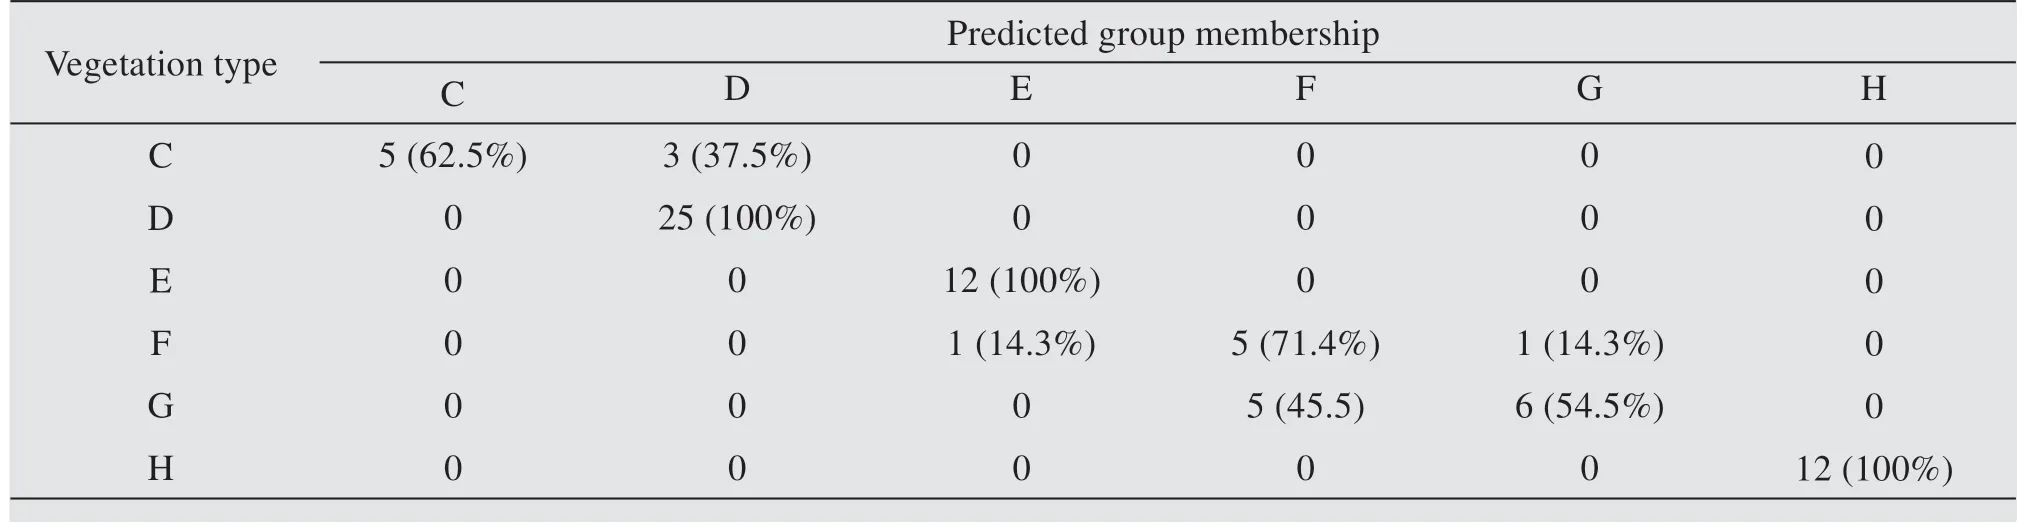
Table 3 Classification results of the modern pollen samples by discriminant analysis
Also, pollen-precipitation index P and Pr of six vegetation zones in the Shiyang River Basin were calculated according to P=(G4+G6)/(G1+G2) and Pr =0.162*E-102.310, respectively (Table 6). Because the highest elevation of all meteorological stations in the Shiyang River Basin is 3,045.1 m(Wushaoling),which is located in the forest vegetation zone, the Pr of subalpine shrub vegetation zone has not been calculated,while the optimal regression equation between P and Pr can be calculated as follows:

3.3 Paleo-hydrological simulation of the Shiyang River Basin
3.3.1 Application of the SWAT model in the basin
We selected the Shiyang River Basin,a typical watershed in arid China, to perform a paleo-hydrological simulation experiment by using the SWAT model.The Soil and Water Assessment Tool (SWAT) which operates on a daily time step is a long-term, continuous simulation watershed model (Arnold et al., 1998).This model is designed to predict the impact of land management practices on water,sediment and agricultural chemical yields in large complex watersheds.The major components of SWAT include hydrology,weather, sedimentation, soil temperature, crop growth,nutrients,pesticides,and agricultural management. In this model, a watershed is partitioned into a number of sub-watersheds, which are further divided into a series of homogeneous hydrological response units (HRUs) that possess unique land-use/management/soil attributes. For each HRU, runoff, sediment,and nutrients are calculated separately, which derive from input data about weather, soil properties, topography, vegetation, and land management practices,then they are summed together to gain the whole loadings from sub-basins. The versions of the model used in this study are SWAT 2012 and ArcSWAT 10.2.2 which is an extension of the SWAT model on the Arc-GIS platform(Winchell et al.,2011).
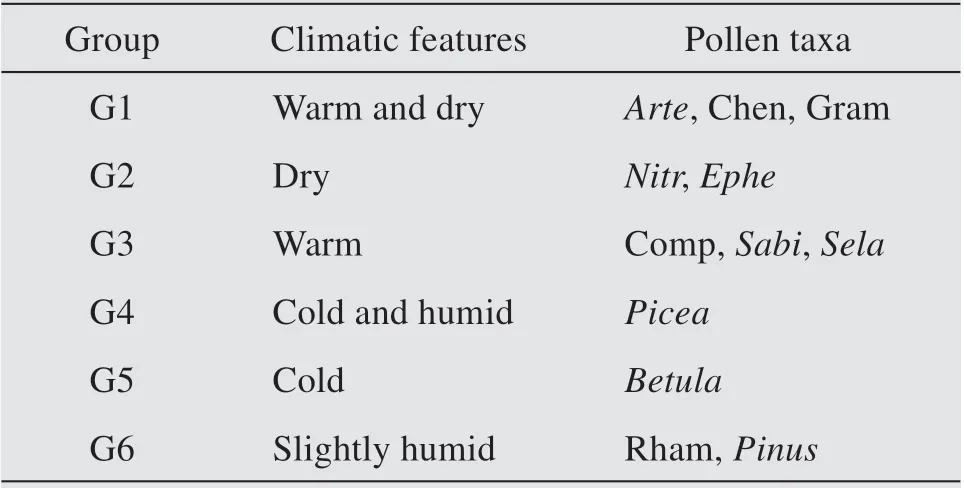
Table 4 Six pollen-climate groups based on HCA and MDS analysis
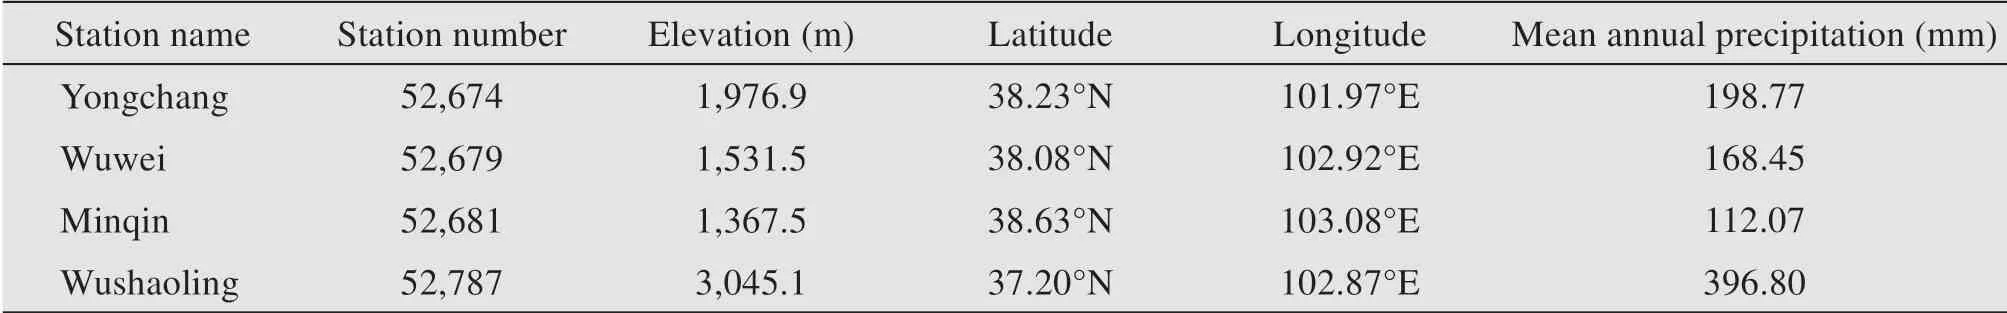
Table 5 Mean annual precipitation from four meteorological stations in the Shiyang River Basin
The water balance equation as the basis of hydrological cycle on land is as follows(Chaplot,2005):
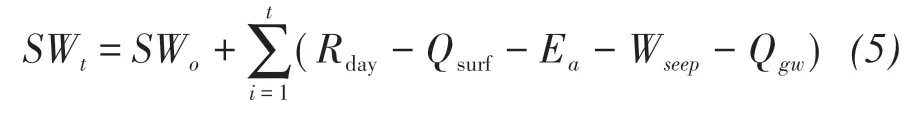
where SWt(mm) is the final soil water content and t (day) is time. SWo(mm), Rday(mm), Qsurf(mm) and Ea(mm) are initial soil water content, precipitation,surface runoff and evaporation, respectively, on day i.Wseep(mm)and Qgw(mm)are the amount of water entering the vadose zone from the soil profile and the amount of return flow on day i.
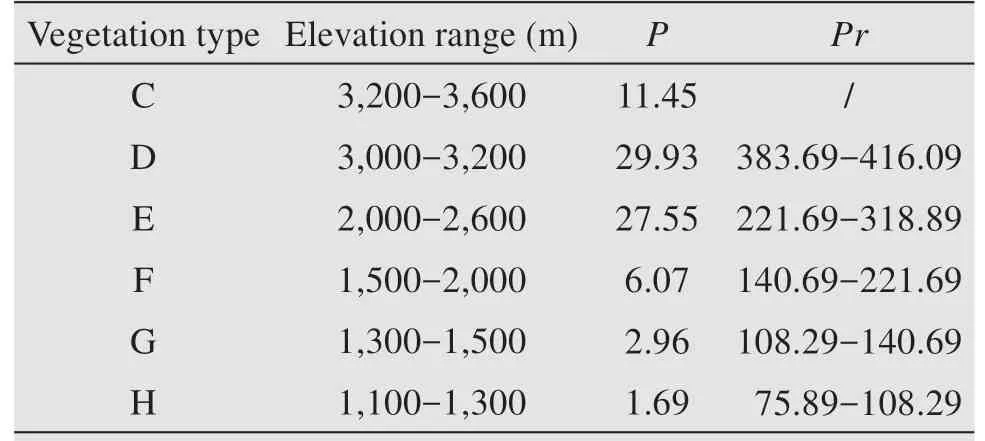
Table 6 The pollen-precipitation index P and modern precipitation Pr ranges of the six vegetation types
When rainfall first reaches dry soil, its infiltration rate is very large.As the soil moisture content increases, the infiltration rate gradually decreases. When the rainfall intensity is greater than the infiltration rate,the rain begins to fill the hole, and the surface runoff will be generated once the land surface is filled.To estimate surface runoff, the SWAT model provides two methods: The Green-Ampt infiltration model and the SCS curve number method which is used in this paper.The SCS curve number equation can be described as follows(Neitsch et al.,2011):

where Qsurf(mm), Rday(mm), Ia(mm) and S (mm) are cumulative runoff, the depth of rainfall, initial loss and retention parameter, respectively. The retention parameter can be calculated as follows:
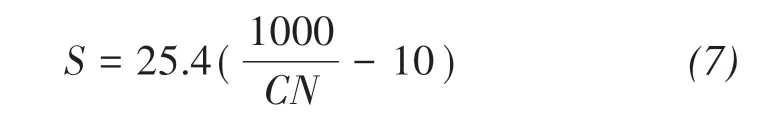
where CN represents the number of curves of a day,initial loss (Ia) is usually approximately 0.2S, therefore the formula can be turned as follows:

3.3.2 Basic input data of the SWAT model
Basic input data required for a SWAT simulation include topography, stream, land-use, soil and weather data. Topography data, which are obtained in the form of a digital elevation model (DEM), are used to delineate a watershed into multiple sub-watersheds,as well as to calculate watershed/sub-watershed parameters. Stream data are applied to establish stream network and create outlets. Categories of land-use/landcover and dominant soil types are based on the soil and land-use/land-cover databases in the SWAT model, and the different land-use/land-cover categories are the basis of SWAT model for dividing each subwatershed into HRUs. The soil data are derived from the 1:1,000,000 Chinese soil data which are based on the Harmonized World Soil Database(HWSD).
The climatic processes model in SWAT consists of daily precipitation and maximum/minimum air temperature. The daily precipitation data and maximum/minimum air temperature data are derived from Community Climate System Model version 4.0 (CCSM 4.0) which is developed by the University Corporation for Atmospheric Research (UCAR) with funding from the National Science Foundation (NSF), the Department of Energy(DOE),and the National Aeronautics and Space Administration(NASA).
3.3.3 Evaluation of simulation results
The simulation effect of the model was evaluated by using the Nash-Sutcliffe coefficient (Ens) and the correlation coefficient(R2).Ens is used to measure the fitting degree between the simulated value and the measured value, which can be calculated as follows(Xia et al.,2010;Bai et al.,2013):
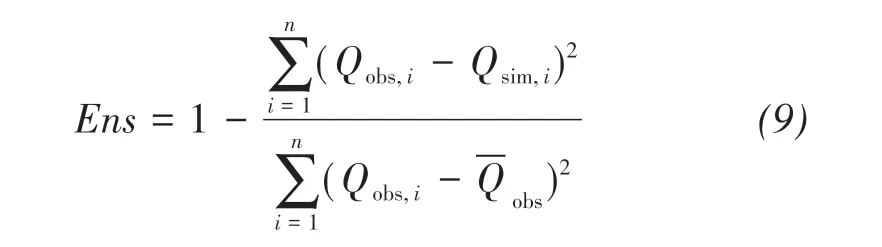
R2is used to evaluate the linear fitting degree between the measured value and the simulated value,which can be described as follows:

where Qobs,iis measured flow and Qsim,iis simulated runoff. Qobsis the average natural flow for many years.Qsimis the average simulated runoff for many years and n is the number of measured data.Ens<0 indicates that the average reliability of the simulation value is lower than the measured value, usually taking Ens >0.5 as the simulation efficiency evaluation criteria. We usually take R2>0.6 as the evaluation criteria for the simulation fitting degree. The larger Ens and higher R2indicate that the simulation efficiency is higher.
3.4 Chronological evidence and terminal lake restoration of the mid-Holocene
The terminal lake of the Shiyang River Basin influences the withdrawal of numerous lake embankments, and these embankments can provide not only paleo-climate and paleo-environmental information but also chronological evidence and elevation information. The elevations of paleo-embankments, OSL dating ages,and14C dating ages are presented in Table 7.Based on the above data,ArcGIS spatial analysis software was applied to calculate the paleo-lake area during the mid-Holocene on the 1:50,000 ASTER DEM,and Figure 2 indicates the paleo-lake area of the Shiyang River drainage area (Li and Liu, 2017; Liu and Li,2017).
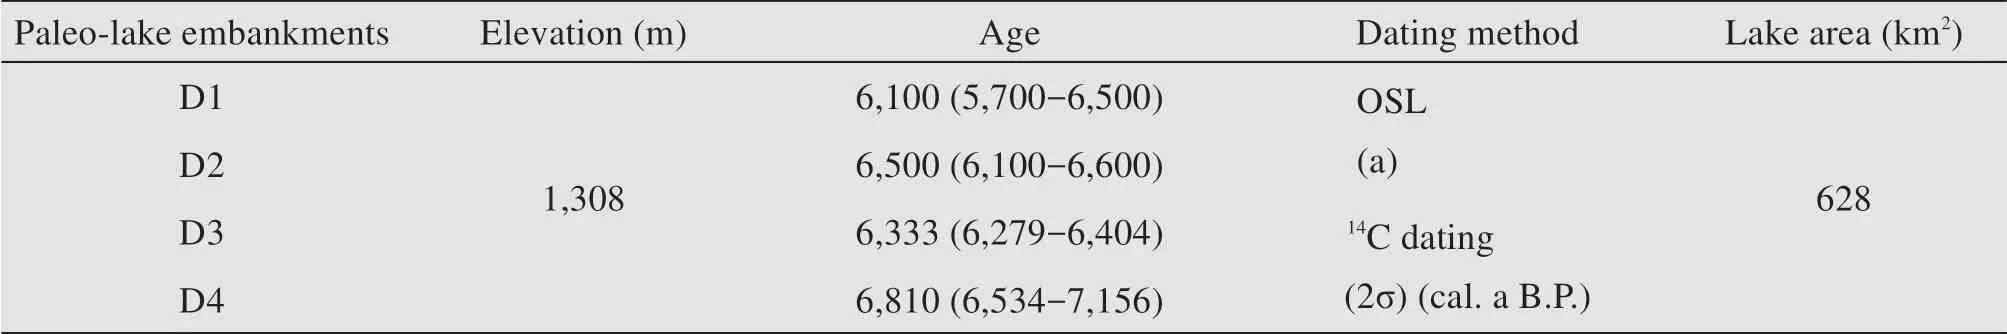
Table 7 The restored terminal lake area of the Shiyang River drainage area
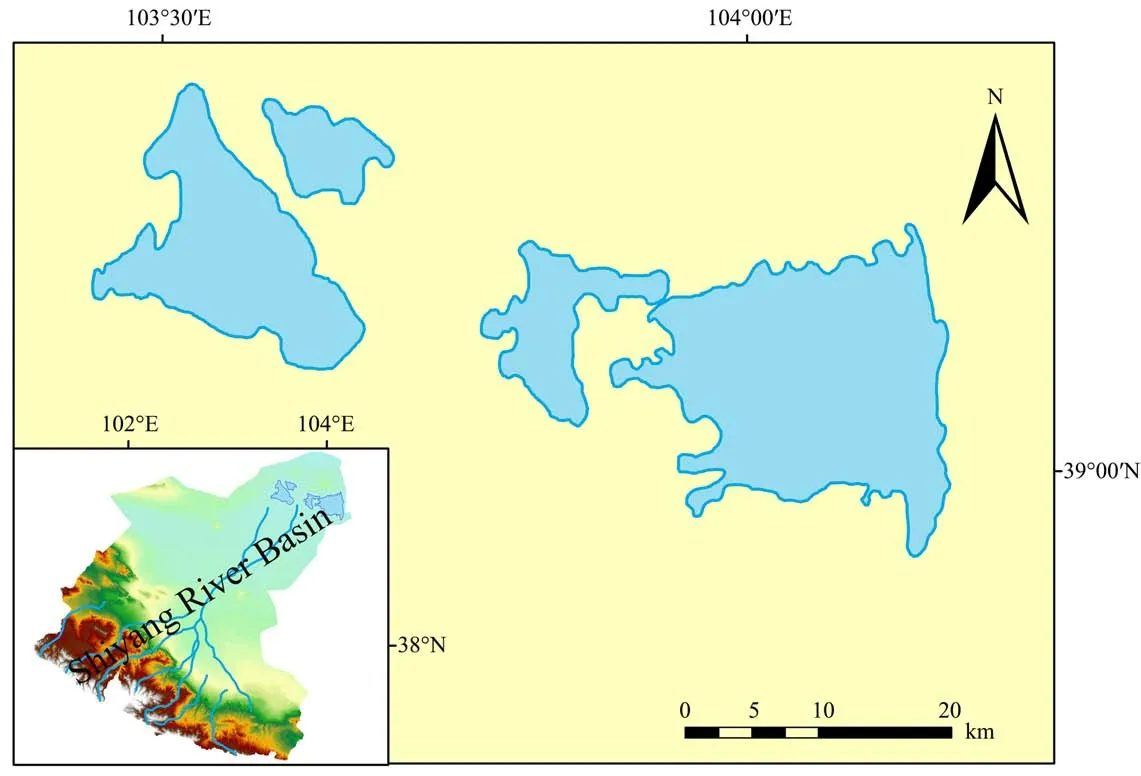
Figure 2 The terminal lake of the Shiyang River drainage basin during the mid-Holocene
4 Results
4.1 Environment change in the Shiyang River Basin during the mid-Holocene
4.1.1 Upstream sedimentary facies and environ ment change
The HYH section has typical loess-soil deposits.For the entire HYH section, the minimum value of TOC (%)can reach as low as 0.01,which appear at 65 cm, and the maximum value is as high as 2.69 which appear at 315 cm. The C/N and δ13C (‰) values are generally scattered between 19.50 and 6.29,-25.22 and-23.69, and the average TOC (%), C/N and δ13C (‰)are 1.14, 10.31 and -24.44 for the HYH section. According to age changes,the HYH section is divided into three phases(Figure 3).
Stage A (about 12,222 to about 8,110 cal. a B.P.)between 145 cm and 320 cm,belongs to the early Holocene epoch.The TOC(%),C/N and δ13C(‰)values range from 1.47 to 0.36, 19.50 to 6.29 and -25.22 to-24.08,respectively.The values of TOC (%) and C/N in this stage reach their lowest, which indicates that the environment during the early Holocene was detrimental for plant growth. Stage B (about 8,110 to about 3,773 cal. a B.P.) between 145 cm and 65 cm,belongs to the mid-Holocene epoch. The TOC (%),C/N and δ13C (‰) values range from 2.67 to 0.40,15.31 to 6.76 and -24.61 to -23.96, respectively.The values of TOC (%) and C/N in this stage are higher than Stage A, and the δ13C (‰) values are more negative than Stage A.Stage C(about 3,773 to about 0 cal.a B.P.) between 65 cm and 0 cm, contains modern plants which grow in the surface soil. The TOC (%),C/N and δ13C (‰) values range from 2.69 to 0.95,12.29 to 6.82 and-24.64 to-23.69,respectively.
4.1.2 Midstream sedimentary facies and environment change
By comparing changes of sedimentary facies and lithology from sections JDT and HSH,we discovered that the changes are similar, which have experienced three phases of river alluvial, lake and eolian facies, and have a good consistency with the age of their stages. We divided the section JDT into two phases(Figure 3).
Stage A(about 6,321 cal.a B.P.to about 4,524 cal.a B.P.) between 115 cm and 320 cm, belongs to the mid-Holocene.The value of TOC(%)reaches its highest, which shows that the environment is optimum for plant growth.The lower values of CaCO3and δ18O(‰)indicate that evaporation is small and the climate is wet. Stage B (about 4,449 cal. a B.P. to about 3,444 cal. a B.P.) between 115 cm and 0 cm is a silty sand layer. The value of CaCO3continues to decrease, and the TOC (%) values are lower, which shows that the climate is drier than Stage A.
4.1.3 Downstream sedimentary facies and environment change
According to the measured value of QTH section,the TOC and C/N values range from 2.60 to 0.01 and 17.62 to 0.41, and the average values of TOC and C/N are 0.62 and 5.70. TOC (%) values have significant positive correlation with C/N (0.87).According to the ages of the QTH profile,the section can be divided into Stage A and B(Figure 3).
Stage A (about 7,377 to about 1,171 cal. a B.P.)between 385 cm and 199 cm, is a layer of lake deposits. The TOC (%) and C/N values are dispersed between 2.60 and 0.28, 17.62 and 3.94. The values of TOC(%)and C/N are both the maximum of the whole profile and the δ13C(‰)values are more negative than Stage B, which indicates that the environment is relatively moist.Stage B(about 1,171 to about 0 cal.a B.P.)between 199 cm and 0 cm, mainly consists of eolian sediments, the TOC (%) values are scattered between 0.62 and 0.08, and the C/N values range from 7.36 to 0.76, which are both lower than Stage A and the lake area gradually withdrew.

Figure 3 Geochemical proxies from upstream,midstream and downstream sections in the Shiyang River drainage basin
4.1.4 Element and environmental indices
The optimum climatic conditions are not only conducive to plant growth but also good for the accumulation of TOC, therefore, the TOC value can indirectly reflect environmental information,and the C/N content has often been used to identify the source of organic matter in lake sediments. Besides, the positive δ13C value represents a relatively arid environment.
Stage B of HYH profile is a paleosol layer which develops in a relatively humid environment with high vegetation cover. The average TOC content and C/N value are both high, and the content of δ13C which is extracted from the plant of C3is more negative than other stages, indicating that climate in this period is warm and wet. In the HSH profile, it can be clearly seen that the average CaCO3, δ18O, and TOC values in the mid-Holocene are higher than that in the late Holocene. The content of CaCO3is a good indicator to reflect the evaporation change, and the δ18O content is inversely related to precipitation. Thus, the mid-Holocene weather conditions in the middle reaches of the Shiyang River Basin are wet but unstable; in QTH profile, the TOC content and C/N value both reach the maximum and the δ13C value is more negative during the mid-Holocene than other periods.The C/N value in the lake sediments is mainly controlled by the primary vegetation productivity and vegetation density.
In conclusion, the upstream HYH profile mainly consists of paleosol deposits and the downstream QTH profile consists of lacustrine deposits and peat layer during the mid-Holocene. The TOC content of the two profiles reaches the maximum, and the value of C/N is also high, the value of δ13C is negative as well,indicating that the temperature and moisture conditions of the Shiyang River Basin during the mid-Holocene are better than that in the late Holocene.
4.2 Quantitative reconstruction of vegetation zones
According to the aforementioned mathematical methods, due to differences in the preservation of different pollen in the strata,P cannot be directly applied to its relationship with precipitation in the Formula(8), thus we assumed that the sediments of the uppermost strata of each area are modern sediments, and used the Formula (3) to calculate the precipitation,then by the inverse of the Formula (4) to obtain P'.The correction coefficient was calculated by P'/P,and the P' value during the mid-Holocene in each area can be obtained, which can be used to obtain the corrected data of each area.Finally,precipitation during the mid-Holocene in each area was calculated by the Formula (4), and then the modern elevation of each region under the precipitation conditions was verified according to the Formula (3). Finally, the scopes and types of vegetation during the mid-Holocene in the Shiyang River Basin can be presented as Figure 4. Vegetation types in the mid-Holocene(about 7,000 to about 3,500 cal.a B.P.)present an arid tendency, of which sub-alpine shrub vegetation zone (C) is distributed between 2,550 m and 2,750 m,forest vegetation zone (D) retreats to an elevation of 2,550-2,750 m, at an elevation of 1,550-2,150 m is the steppe vegetation zone (E) and below 1,550 m is desert steppe vegetation zone(F).
Figure 4a is the reconstructed vegetation zones in the Shiyang River drainage basin during the Mid-Holocene and Figure 4b is the adjusted modern vegetation types based on the Figure 4a for running the SWAT model.Letters in the legend of Figure 4a represent different vegetation types: A, alpine cushion. B,alpine meadow. C, sub-alpine scrub. D, forest. E,steppe. F, desert steppe. Legends with "/" represent transition zones of vegetation types between D and E.Letters in the legend of Figure 4b represent different land uses: FRSE, evergreen forest. FRST, mixed forest. RNGB, brush land. RNGE, sub-alpine scrub.WATR, glacier. SPAS, grassland. WETL, wetland.WATR,water area.HAY,desert steppe.
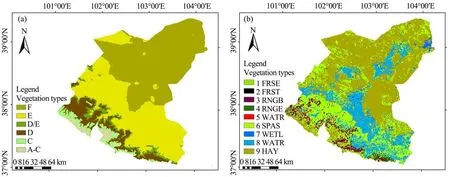
Figure 4 Vegetation types of the Shiyang River Basin during the mid-Holocene
4.3 Runoff reconstruction in the basin during the mid-Holocene
4.3.1 Evaluation of the SWAT model in the basin
This study was based on the model verification period from 1988 to 1997, and the simulated time step was studied on a monthly scale to evaluate the feasibility of the SWAT model. Except for several months,the simulated runoffs are slightly smaller than the measured, which can basically reflect the trend of actual runoff change in the study area. The peak points are consistent, especially in 1990, 1991, 1994, 1995,1996 and 1997 (Figure 5). In order to further evaluate the applicability of the model in the study area, Ens and R2were analyzed. Ens is 0.62, which is higher than the evaluation standard and indicates that the simulated runoff during the verification period is more credible; R2is 0.74, which shows that the simulated runoff has a good linear fitting with measured runoff.Finally we draw some conclusions that:(1)the SWAT model is applicable to simulate hydrological process in the Shiyang River Basin, (2) the simulated value of the SWAT model in the basin is slightly smaller than the measured value, and basically reflects the actual runoff change trend, (3) the runoff in the Shiyang River Basin is extremely small during winter and increases obviously after spring, indicating that the snow and glacier have a great impact on the runoff change, (4) summer runoff from June to September is the largest, which is mostly from the monsoon and westerly precipitation.
4.3.2 Runoff reconstruction in the Shiyang River Basin
In this experiment, the Shiyang River Basin was divided into 175 sub-basins and subdivided into 849 HRUs. The main output file in SWAT model includes summation input file (input.std), summation output file(output.std),HRU output file(output.hru),sub-basin output file (output.sub), main channel output file(output.rch),reservoir output file(output.rsv)and sedimentary output file (output.sed). Here, we chose the main channel output file (output.rch), which contains summary information for each routing reach in the watershed to calculate the runoff in the Shiyang River Basin. The following is a brief description of the output variables in the output.rch:RCH is the reach number and MON means that the model runs on a monthly time step; AREA (km2) means the area drained by reach; FLOW_IN (m3/s), FLOW_OUT (m3/s), EVAP(m3/s)and TLOSS(m3/s)indicate that the average daily stream flows into reach during time step, the average daily stream flows out of reach during time step,the average daily rate of water loss from reach by evaporation during time step and the average daily rate of water loss from reach by transmission through the streambed during time step,respectively.
One reach or main channel is associated with each sub-basin in a watershed. Loadings from the sub-basin enter the channel network of the watershed in the associated reach segment and outflow from the upstream reach segment will also enter the reach segment. The upstream of the Shiyang River Basin is comprised of mountain rivers and a few glaciers as well, with an area of 12,429.37 km2. By using the parameter of FLOW_OUT, the average runoff can be calculated and the simulated results are presented in Table 8.
After the upstream rivers flow out of the mountains, they converge in the fan-fringe area, and then flow to the north from the two outlets, one of which develops the main channel consisting of the Xiying,Jinta, Zamu, Huangyang, Gulang rivers and part of the Dongda River. Next, these tributaries merge into the main river at the northern edge of the Wuwei subbasin in the midstream with an area of 13,538.19 km2.The calculation method is the same as above, the runoff of the midstream and the attribute of each sub-basin are presented in Table 8.
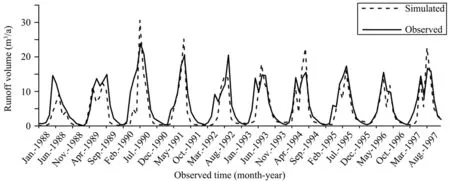
Figure 5 The compared curve between the simulated month runoff and the measured month runoff during verification period
Through the Hongya Mountain, the main river then flows northwards into the Minqin sub-basin and finally gathers into the terminal lake which has dried up in recent times.The lower reaches of the Shiyang River Basin, with an area of 14,611.46 km2, tend to be desertified at present. The simulated results are presented in Table 8. Finally, through the summary of runoff in the upper, middle and lower catchments,we obtained the average runoff of the Shiyang River Basin.

Table 8 The average runoff in the Shiyang River Basin
5 Discussion
Distributed hydrological model is pioneered as a scientific tool in hydrology, and has become indispensable in a growing number of rainfall runoff simulation studies (Wang et al., 2003; Yang et al., 2003).The SWAT model is more suitable for distributed hydrological process simulation for long-term water resources management,and it fully considers the impact of uneven spatial distribution of rainfall conditions and underlying surface conditions on the formation of rainfall runoff, as well as can objectively reflect the influence of spatial distribution of climate and underlying surface on runoff and water reserves in a river basin (Li et al., 2009a; Feng et al., 2010; Yao et al.,2013; Wu et al., 2015). In this paper, the SWAT model was used to continuously simulate modern runoff process of the Shiyang River Basin. Ens is 0.62,which is higher than the evaluation standard and indicates that the simulated runoff of the verification period is highly credible,and R2is 0.74,which shows that the simulated runoff has a good linear fitting with the measured runoff. Also, numerous studies have been done on runoff processes of the Shiyang River Basin,and evaluated the applicability of the SWAT model in the Shiyang River Basin,as well as simulated the runoff during different recent periods. Ens and R2are all above evaluation standard, indicating that the SWAT model is suitable for the runoff simulation of the Shiyang River Basin (Li, 2011; Zhang et al., 2012b; Sun,2013;Song et al.,2016).
Basic input data required for a SWAT simulation include topography, stream, land-use, soil and weather data. Due to the lack of these data, the SWAT model is often used in recent times. However, CCSM 4.0,a coupled climate model for simulating the earth's climate system, can be used to reconstruct the past and predict future climate variations of large-scale climate systems and can provide precipitation and temperature data during the mid-Holocene. Here, we reconstructed the vegetation zones of the mid-Holocene,which can provide land-use data for SWAT simulation. Because of feasibility of the SWAT model in this region, we successfully simulated the runoff of the Shiyang River Basin during the mid-Holocene with the aforementioned data. Our simulation results for runoff of the Shiyang River Basin is 16.20×10⁸m3/a.Previously, our group has performed a quantitative reconstruction of the Shiyang River runoff during the Holocene by improving the water and energy balance model, which was calibrated by modern meteorological and hydrological data. The results show that runoff during the Holocene was between 10.637 m3/a and 10.777×10⁸m3/a (Liu and Li, 2017). The simulated runoff in this paper is a little higher,and the differences are caused by the uneven spatial distribution of the rainfall and the underlying surface factors, which were corroborated by numerous studies (Linsley and Crawford, 1960; Zhang et al., 2004; Hu et al., 2016).The SWAT model fully considers the impact of uneven spatial distribution of rainfall conditions and underlying surface conditions on the formation of rainfall runoff(Wang et al.,2002),and can effectively use the large amount of spatial vector and raster data, as well as can describe the mechanism of hydrological process more accurately than other hydrological models(Yang et al.,2004).
Cao (1989) investigated distributions of paleochannels and deposits of the Luanhe River, and estimated that the annual discharge of this river during the mid-Holocene was close to 9.7×10⁹m3/a, which is 2.1 times larger than the modern value. By employing regression equations relating mean annual runoff to mean annual temperature and mean annual precipitation derived with modern data, Wang (1999) calculated paleo-runoff values of the downstream of the Luanhe River area, and concluded that the mid-Holocene paleo-runoff was 9.58×10⁹m3/a. Our results show that paleo-runoff in the Shiyang River Basin is higher than modern runoff. The modern climate of the Luanhe River area and the Shiyang River Basin are semi-humid/semi-arid and arid/semi-arid, respectively, which can affect the amount of runoff in these areas. Mean annual temperature was 3.0 °C higher during the mid-Holocene and annual precipitation was 290 mm higher during the mid-Holocene than recent times, which are reasons why the Luanhe River runoff during the mid-Holocene is higher than that in recent times(Cao,1989). Due to the warm and wet climate during the mid-Holocene, the paleo-runoff in the Shiyang River Basin is higher than that in recent times. Regional climate profoundly influences surface runoff which has a close relationship with precipitation, and differences in regional climate can affect the volume of runoff in different areas as well (Li et al., 2013; Yao et al.,2014;Yaghoubi et al.,2016).
The Shiyang River Basin is located in the monsoon marginal zone, and there are numerous studies on climate change of monsoon marginal zones during the Holocene. Li (1990) suggested that there are two patterns of environment change since the late Pleistocene in Northwest China. Xinjiang represented the pattern of the westerly belt; Gansu and Qinghai region was mainly influenced by the monsoons.Chen et al. (2006) drew a conclusion that the Shiyang River Basin was mainly controlled by Asian monsoons and presented a dry climate during the mid-Holocene.Whereas, Li et al. (2009b) proposed that the period of the climatic optimum in the Holocene appeared between 7,400 cal.a B.P.and 4,700 cal.a B.P.in the Shiyang River Basin, and the millennial-scale Holocene climatic changes were affected by the Asian monsoon and westerly winds in the drainage basin (Li et al.,2011). The intensity of the East Asian summer monsoon gradually decreased from the early-middle Holocene to the late Holocene; whereas, the westerlies were relatively wetter in the middle and late Holocene. This concurs with our simulation results, the East Asian summer monsoon only dominated the summer precipitation of the Shiyang River Basin, and the annual moisture transport in Shiyang River Basin was balanced predominantly by the westerly circulation.Therefore, we argue that the climate of the Shiyang River Basin was under the double influence of the Asian monsoon and westerly winds in the mid-Holocene, while the late Holocene was mainly controlled by the Asian monsoon.
6 Conclusion
The SWAT model is a distributed hydrological model, which is often used in recent times. However,based on land-cover adjustment results which were obtained by synthesizing the characteristics of modern pollen propagation and pollen records from eight Holocene sedimentary sections in the Shiyang River Basin, and meteorological data for the mid-Holocene from CCSM 4.0, the SWAT model was successfully used to perform a simulation experiment of paleo-hydrology. Meanwhile, according to the chronological evidence from paleo-lake embankments and sediment records, the lake area of the terminal lake and the paleo-environment of the Shiyang River Basin during the mid-Holocene were reconstructed. Results show that the upstream, midstream, downstream and average runoff in the basin were 16.76×10⁸m3, 22.86×10⁸m3,9.00×108m3and 16.20×10⁸m3, respectively; also, the lake area of the terminal lake in the Shiyang River Basin was 628 km2. The warm, humid climate in the mid-Holocene was influenced by combined effects of the Asian monsoon and westerly winds, while the late Holocene was mainly controlled by the Asian monsoon. Thus, this paper can help not only understand the paleo-hydrological process in the mid-Holocene,but also provide a new quantitative method for paleohydrological simulation.
Acknowledgments:
This work was supported by the National Natural Science Foundation of China (Grant Nos. 41822708 and 41571178), the Strategic Priority Research Program of Chinese Academy of Sciences (Grant No.XDA20100102), the Fundamental Research Funds for the Central Universities (Grant No. lzujbky-2018-k15), and the Second Tibetan Plateau Scientific Expedition(STEP)program(Grant No.XDA20060700).
 Sciences in Cold and Arid Regions2019年4期
- Sciences in Cold and Arid Regions的其它文章
- Editors-in-Chief Guodong Cheng and Ximing Cai
- Influence of frost weathering on the recession of surfaces of technogenic landforms in Yakutia
- Comparative study of surface energy and land-surface parameters in different climate zones in Northwest China
- Holocene lake carbon sequestration,hydrological status and vegetation change,China
- Effects of gibberellic acid on tiller-bulb number and growth performance of Lilium davidii var.unicolor
- Guidelines to Authors