
Comparative study of surface energy and land-surface parameters in different climate zones in Northwest China
2019-09-06 01:21:28JiaXiYangZhenChaoLiYeYuZhiYuanZhengXuHongHouXiaoQingGao
JiaXi Yang,ZhenChao Li,Ye Yu,ZhiYuan Zheng,XuHong Hou,XiaoQing Gao*
1.Key Laboratory of Land Surface Process and Climate Change in Cold and Arid Regions,Northwest Institute of Eco-Environment and Resources,Chinese Academy of Sciences,Lanzhou,Gansu 730000,China
2.University of Chinese Academy of Sciences,Beijing 100875,China
3.Center for Monsoon and Environment Research,Guangdong Province Key Laboratory for Climate Change and Natural Disaster Studies,School of Atmospheric Sciences,Sun Yat-Sen University,Guangzhou,Guangdong 510000,China
4.Pingliang Land Surface Process and Severe Weather Research Station,Chinese Academy of Sciences,Pingliang,Gansu 730000,China
ABSTRACT Based on observational data of arid,semi-arid and semi-humid areas in Northwest China,the characteristics of surface-water heat transfer and land-surface parameters were compared and analyzed.The results show that the annual mean net radiation was largest in the semi-humid area,followed by the semi-arid area,and then the arid area:77.72 W/m2,67.73 W/m2,and 55.47 W/m2, respectively. The annual mean sensible heat flux was largest in the arid area, followed by the semi-arid and semi-humid areas, while latent heat flux showed the reverse. The annual mean sensible heat flux in arid, semi-arid,and semi-humid areas was 85.7 W/m2,37.59 W/m2,and 27.55 W/m2,respectively.The annual mean latent heat flux was 0 W/m2,26.08 W/m2,and 51.19 W/m2,respectively.The annual mean soil-heat flux at the 5-cm soil layer in arid,semi-arid,and semi-humid areas was 1.00 W/m2,0.82 W/m2,and-1.25 W/m2,respectively.The annual mean surface albedo was largest in the arid area, followed by the semi-humid area; and the smallest was in the semi-arid area: 0.24, 0.21, and 0.18, respectively.The annual mean Bowen ratio in the semi-arid area was about 2.06,and that in semi-humid area was about-0.03.The annual mean soil thermal conductivity in the arid, semi-arid, and semi-humid areas was 0.26 W/(m∙k), 1.15 W/(m∙k),and 1.20 W/(m∙k),respectively.
Keywords:surface energy;land-surface parameters;different climate zones;Northwest China
1 Introduction
The land-surface process is the combination of the physical, dynamic, and hydrological processes occurring on the earth's surface, which can affect climate change (Priestley et al., 2009). The land-surface process could be affected by the physical properties of the underlying surface, weather conditions, and other factors; and has a major impact on the atmosphere and global climate system (Sharon, 2015).As the predecessor of the land-atmosphere system, the radiation, and the water and heat transfer between the land and the atmosphere can affect climatic factors such as temperature, humidity, precipitation, and net radiation, which turns out to be an important physical process affecting atmospheric circulation and the climate state, as well as a driving source in the system (WMO,1987; Baldocchi et al., 1997; Zhang et al., 2003). The characteristics of local climate are largely determined by the surface-radiation balance and the soil-hydrothermal process, with the adjustment or development of that often resulting in change in the regional climate.The change of the land-surface process is an important factor affecting regional climate change, contributing a lot to the formation, change, and anomaly of regional or even global climate (Xie and Arkin, 1996). Therefore,an in-depth understanding of the exchange of matter and energy in the land-atmosphere system will help advance understanding of studying regional climate conditions and respond to sudden changes of regional climate. The most important factor causing the differences in the land-atmosphere exchange is the uneven spatial distribution of land-surface parameters(Wang et al., 2007), with the most influential land-surface parameters being surface albedo, the Bowen ratio, and soil thermal conductivity.The change of surface albedo has a great impact on the change of the climate system.Surface albedo represents the ability of absorbing solar radiation of the land surface. The Bowen ratio indicates, to some extent, the degree of regional drought.Other factors determine how the energy of net radiation changes into different forms of heat energy (i.e.,sensible heat flux, latent heat flux, and soil-heat flux).In addition, improving the land-surface parameters in the atmospheric numerical model is one of two major means to optimize forecasting capability. Objectively speaking, many aspects in the atmospheric numerical model still need to be improved, among which one of the major missions is to improve further the parameterization of the land-surface process (Dickinson, 1995).Previous studies have shown that the current land-surface process parameterization in the atmospheric model is unsatisfactory, thus causing a lot of uncertainties in surface heat flux (Henderson, 1993). In-depth research on the variation characteristics of land-surface process parameters would lay a foundation for the improvement of land-surface process parameterization, as well as of the land-surface model.
There are different climate zones (arid, semi-arid,and semi-humid regions)in Northwest China;and each climate region varies greatly in terms of water, heat transfer, and land-surface parameters due to different climatic conditions. As for the underlying surface,there are various types such as desert, oasis, Gobi,farmland, and so on in Northwest China, which further contributes to the complexity of the land-surface process. In recent years, the rapid development, together with intensified urbanization, in northwestern regions has had a great deal to do with land-surface parameters like surface albedo (Zhao et al., 2014). Studies have shown that changes in the land-surface process of Northwest China, such as the changes of land-atmosphere temperature and surface heat flux, have an essential influence on the summer precipitation in Eastern China, as well as on summer monsoon circulation in East Asia (Huang et al., 2011). Meanwhile, winter and summer monsoons in East Asia in turn have had a huge impact on the temperature and precipitation in Northwest China (Zhang et al., 2002). Only by figuring out the characteristics of the land-surface process in different climate regions of Northwest China, can we better understand the land-surface process in the entire northwestern region, the regional climate state, and the feedback relationships with the winter and summer monsoons in East Asia, thus better respond to changes of the ecological environment and future climate. That is why the comparative study on hydrothermal transfer and land-surface parameters in different climate regions of Northwest China is necessary.
Not until Jule (1975) published a groundbreaking paper on drought and desertification, did land-atmosphere interaction attract the public's attention. Beginning in the mid-1980s, study of large-scale, international land-surface process and land-atmosphere interaction is now being developed more deeply and extensively(Wang,1999).In the early papers,surface albedo was considered to be a major factor in land-atmosphere interaction; but soil moisture soon proved to be the real driving force (Charney et al., 1977;Nicholson et al., 1998; Taylor and Lebel, 1998; Ba et al., 2001). For a long time, hydrothermal transfer has received a lot of attention.In recent years,with the advancement of science and technology in China and vigorous development of meteorology, researchers have paid more attention to characteristics of hydrothermal transfer in northwestern regions, especially the Loess Plateau, and have obtained some preliminary research results. However, previous research was mainly through experimental observation and numerical simulation to understanding the changes of the land-surface process in specific climatic regions; and the analysis of the land-surface process in different climatic regions in Northwest China was limited to the Loess Plateau or to specific weather conditions(Wei et al.,1995;Yang et al.,2005;Yang et al.,2010;Zeng et al., 2010; Sun and Zhang, 2011; Zhang et al.,2013).As a result, understanding of the basic characteristics of the land-surface process in different climate regions was greatly limited; and the substantial contribution of the land-surface process to weather and climate forecasting could not be fully described.
This paper uses the observational data of three different climatic regions to compare the annual, seasonal, and daily variations of net radiation, sensible heat flux,latent heat flux,and soil-heat flux.The characteristics of surface albedo,the Bowen ratio,and soil thermal conductivity were used to study systematically the characteristics of the energy budget and hydrothermal transfer, in order to provide a scientific basis for the parameterization of the land-surface process and improvement of the land-surface model.
2 Observation sites, experimental apparatus,and data
The data in this paper are from observations at Dunhuang (DH),Yuzhong (YZ), and Pingliang (PL)stations. The specific locations are shown in Figure 1,and Table 1 displays the specific climatic and geographic information.The underlying surface of Dunhuang, Yuzhong, and Pingliang was Gobi, native vegetation, and farmland, respectively. The underlying surface at Dunhuang Station was covered by coarse sand and gravel, with almost no vegetation.Native vegetation at Yuzhong Station was grass,about 1-cm tall, that had not been transplanted by any external factors but that originally grew in the region. The farmland at Pingliang Staion was winter wheat that grew in spring and summer. Table 2 shows the experimental instruments used at the three observational sites.The observation mainly included four items,i.e.,surface-radiation system,sensible heat flux, latent heat flux, and soil-heat flux.All data are averages per 30-min output and subject to strict and consistent quality control. However,due to instrumental error or failure and some other factors that occurred in the transmission of records,some false data are inevitable,which may have a serious impact on the research and need to be eliminated(Wang et al.,2010).
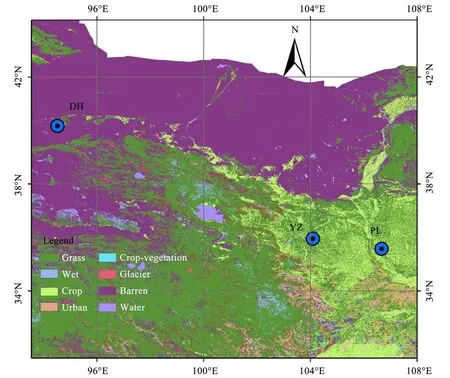
Figure 1 Site location and underlying surface information
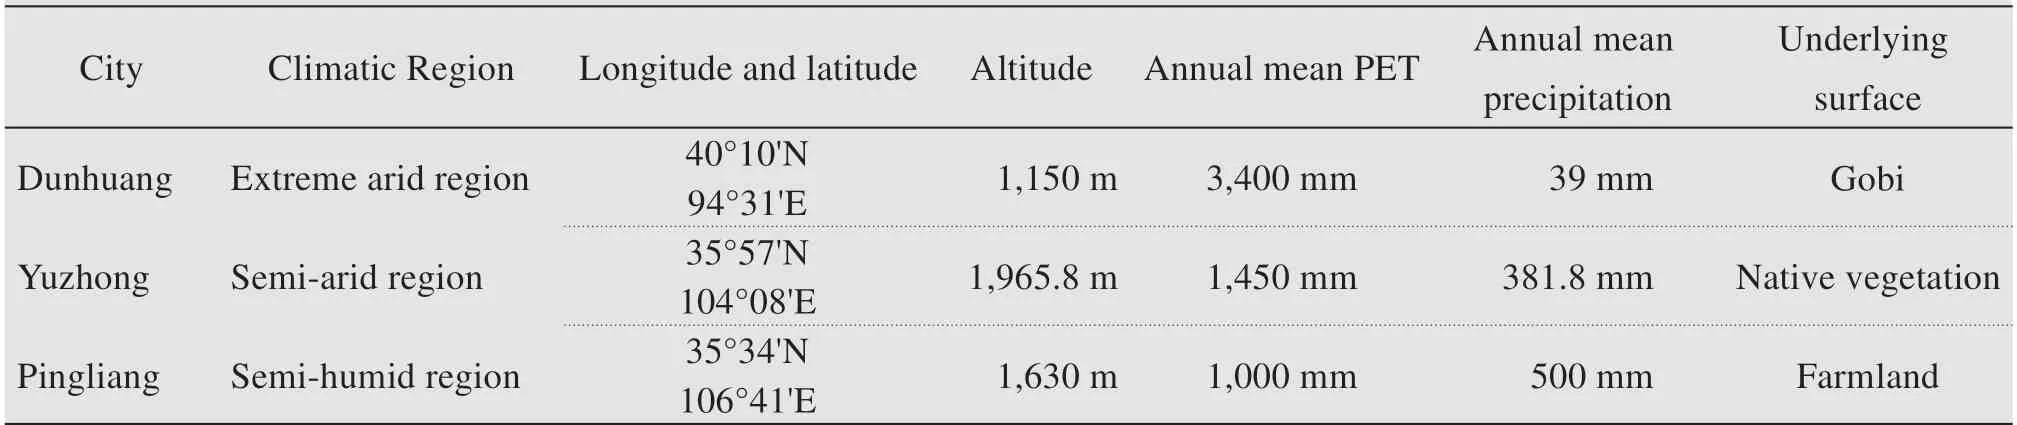
Table 1 Specific climatic and geographic information
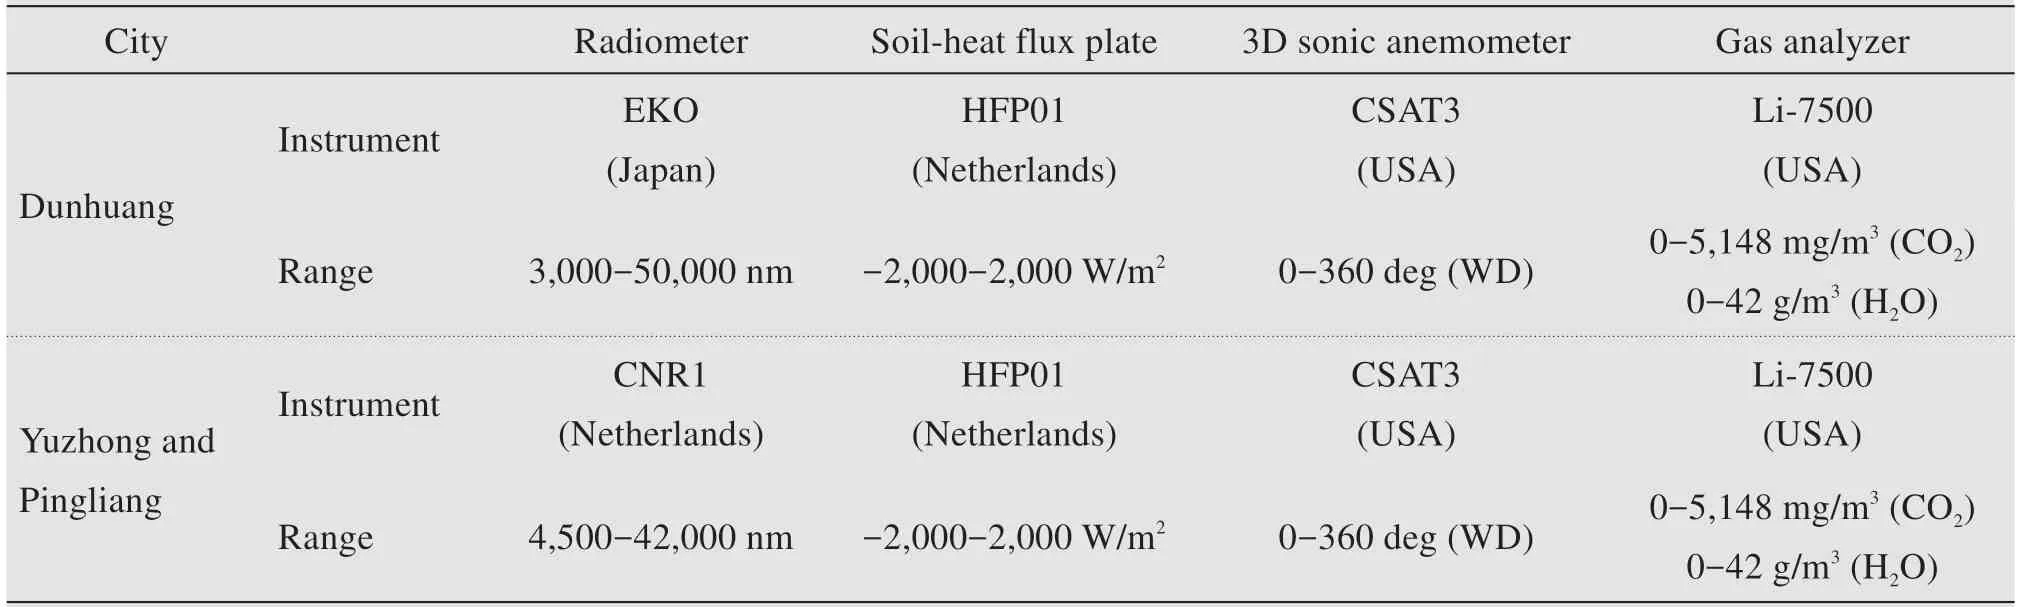
Table 2 Technical parameters of experimental instruments used at three stations
Observational data of net radiation at Yuzhong Station are from 2010, and those at the other stations are from 2012. Because the observational flux data at Dunhuang was only Autumn to October, Dunhuang was not included in the flux comparison of annual observational data. But some research results have showed that ERA-Interim could represent the changes of heat flux at Dunhuang Station very well.The sensible heat flux and latent heat flux are from June 2013 to May 2014 at Pingliang and from June 2010 to May 2011 at Yuzhong. This study selected the 2010 soilheat flux at 5 cm underground at Dunhuang,Yuzhong,and Pingliang for comparison.
Surface albedo is the ratio of surface reflection flux to incident radiation flux. It is one of the most significant land-surface process parameters affected by climate fluctuations and one of the important factors affecting land-atmosphere interaction and climate change. It indicates the ability of a surface to reflect solar radiation and varies with factors such as surface characteristics, solar altitude, and soil moisture(Liang et al.,2005).
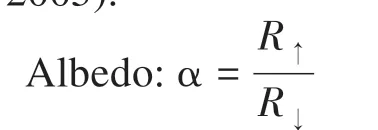
where R↑represents upward short-wave radiation and R↓represents downward short-wave radiation.
The Bowen ratio is the ratio of sensible heat flux to latent heat flux and, to some extent, indicates the level of regional aridity(Shao et al.,2006).

where H0is sensible heat flux and λE0is latent heat flux.
Soil thermal conductivity refers to the ability of heat transfer.As soil is a porous medium composed of three phases, i.e., solid, liquid, and gas, and the thermal conductivity of water is 20 times that of air, the soil-water content directly determines the soil thermal conductivity when its solid part is constant (Shao et al., 2006). Soil thermal conductivity is affected by properties such as soil density, soil composition, soil porosity,and soil moisture(Wang et al.,2008).
The equation of definition of soil thermal conductivity:λ = -
where Giis the soil-heat flux in the vertical direction,as measured by the soil spacer plate; ∂T/∂z is the soiltemperature gradient in the vertical direction; G1and G2are the two layers at which soil-heat flux is tested;and ΔTs/Δz is the temperature gradient between the two layers of geothermal flow(Du et al.,2015).
When calculating the soil thermal conductivity at a depth of 5 cm at Dunhuang Station, G was the soil-heat flux between the 2.5-cm and 7.5-cm soil layers; and ∂T/∂z was the temperature gradient between the 5-cm and 10-cm soil layers.When calculating the soil thermal conductivity at the depth of 5 cm at Yuzhong Station and Pingliang Station, G was the heat flux of soil at the 5-cm depth;and ∂T/∂z was the soil-temperature gradient between the 5-cm and 10-cm layers. It should be noted that because there was no observational data of soil temperature above 5 cm at every site, the temperature gradient between the 5-cm and 10-cm soil layers was applied, which may affect the calculation and theoretically result in a relatively larger value of soil thermal conductivity;however, this decision would not affect the variation trend.
3 Results analysis
3.1 Comparison of net radiation
Net radiation is affected by factors such as solar altitude, altitude, cloud cover, and atmospheric transparency, among which solar altitude is the determinant of the change of net radiation over time.Figure 2 shows the annual mean variation of net radiation,which displayed a unimodal trend over solar altitude,with the peak in summer and the nadir in winter.Pingliang experienced the largest annual mean net radiation, followed by Yuzhong and then Dunhuang:77.72 W/m2, 67.73 W/m2, and 55.47 W/m2, respectively.The underlying surfaces of different climate regions are totally different. The property of different underlying surfaces, especially the soil moisture, led to obvious differences between upward short-wave radiation and upward long-wave radiation. On the one hand, the increase in soil-water content can reduce the surface albedo and make the soil layer absorb more short-wave radiation; on the other hand, due to the large thermal capacity of water,the topsoil temperature would become lower, long-wave radiation emitted from the surface would reduce,and net radiation would increase (Li et al., 2018). In addition, the more arid a place is,the less the cloud cover is,which means atmospheric transparency and atmospheric long-wave radiation are higher. The annual mean solar radiation was the largest at Dunhuang,followed by Yuzhong;and the smallest was at Pingliang.The maximum monthly average of net radiation of all stations was in June:137.92 W/m2, 121.39 W/m2, and 117.80 W/m2, respectively. The minimum monthly average of net radiation at Dunhuang and Pingliang appeared in December,about 5.57 W/m2and 15.70 W/m2, respectively; while in Yuzhong, the minimum was in January of the second year. To compare the characteristics of net radiation variation at different sites in different seasons,the seasons of winter, spring, summer, and autumn were represented by January,April, July, and October,respectively; and the average value of each month was used to analyze the daily variation characteristics of each season. Figure 3 shows the seasonal average diurnal change of net radiation. It can be seen that the net radiation in each season reached the maximum at noon and the minimum after sunset. The mean net radiation reached a peak in summer,followed by spring,autumn, and winter. In spring, summer, and autumn,the largest average value of net radiation was at Pingliang, followed by Yuzhong, with the smallest in Dunhuang. During winter, the maximum appeared at Pingliang, followed by Dunhuang, with the minimum at Yuzhong. In winter, the largest average daily range of net radiation was at Yuzhong, where the net radiation at midday was significantly greater than for other areas; and the net radiation at sunrise and sunset was significantly less than for other areas. The different between the radiation of two stations in winter is caused by the difference of the underlying surface.The Pingliang Station also belongs to a rain-fed agriculture zone, and the underlying surface was covered with winter wheat. Winter wheat at Pingliang absorbed more solar radiation, resulting in lower net radiation than at Yuzhong.
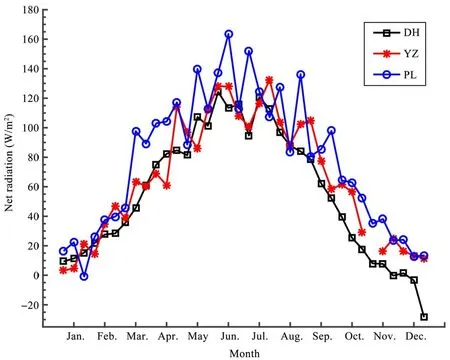
Figure 2 Annual mean variation of net radiation at three stations
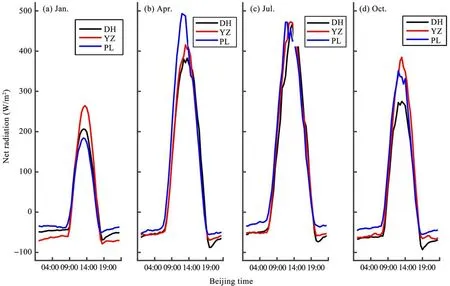
Figure 3 Seasonal average diurnal change of net radiation at three stations
3.2 Comparison of sensible heat flux and latent heat flux
Figure 4a shows the annual variation of sensible heat flux from June 2013 to May 2014 at Pingliang and that from June 2010 to May 2011 at Yuzhong.During this period, the trend of sensible heat flux and latent heat flux was consistent with that of net radiation; and the annual mean sensible heat flux of Yuzhong was larger than that of Pingliang, with the specific value at 37.59 W/m2and 27.55 W/m2,respectively. Figure 4b shows the annual variation of latent heat flux. During this period, the annual mean latent heat flux at Pingliang was larger than that at Yuzhong:51.19 W/m2and 26.08 W/m2, respectively. From winter to summer, the increase in latent heat flux at Pingliang was significantly larger than that at Yuzhong. It can be seen from Figure 4 that the annual mean variation of latent heat flux was larger than that of sensible heat flux, and the sensible heat flux increased with the increase of net radiation. The latent heat flux in these two places showed a sharp downward trend at the end of summer, which may be due to the slowing of vegetation growth and the decrease of evaporation.As for Dunhuang Station, the sensible heat flux in different reanalysis data varies greatly, regardless of the specific value or variation trend. Fourteen years of observational data were applied to the comparison;and the results of ERA-Interim were generally closer to the observational data, which showed that the sensible heat flux in summer at Dunhuang was about 85.7 W/m2for fourteen years(Li et al.,2017).In summer, the sensible heat flux reached its peak at Dunhuang Station.This pattern was because its underlying surface was Gobi; it was extremely dry.The underlying surface changed rapidly in surface temperature, making sensible heat flux the largest contributor to net radiation.Zhou et al.(2012)showed that,in the distribution of the energy of net radiation, the sensible heat flux was obviously dominant, being larger than the topsoil-heat flux and latent heat flux. The latent heat flux was close to zero and changed little, which could be ignored. At the same time, the numerical simulation results showed that the latent heat at Dunhuang was 0, consistent with the actual measurement,although the measured value fluctuated and there were negative values in the daytime. Figure 5 shows the daily average variation of sensible heat flux in January, April, July, and October. It can be seen that at Yuzhong, the seasonal sensible heat flux in descending order was spring, summer, autumn, and winter:63.47 W/m2,51.56 W/m2,29.06 W/m2,and 25.73 W/m2,respectively. At Pingliang, the seasonal sensible heat flux in descending order was autumn, winter, spring,and summer: 29.25 W/m2, 26.70 W/m2, 23.34 W/m2,and 20.69 W/m2, respectively. Figure 6 shows the seasonal average variation of latent heat flux;and it can be seen that the seasonal latent heat flux at Yuzhong in decreasing order was summer,autumn,spring,and winter:48.70 W/m2, 29.94 W/m2, 14.94 W/m2, and 4.08 W/m2,respectively. That at Pingliang was summer, spring,autumn, and winter, with 79.79 W/m2, 62.66 W/m2,57.58 W/m2, and 7.17 W/m2, respectively. The reasons for seasonal variation in sensible heat flux and latent heat flux were precipitation distribution and agricultural activity. In summer, precipitation was adequate; and the latent heat flux became larger. At the same time,the agricultural activity changed the underlying surface, causing changes in the solar radiation absorbed by the underlying surface. Specifically, crops increased the temperature difference between the land and the atmosphere; then, the sensible heat flux became larger.Irrigation also changed the soil moisture,making the latent heat flux change accordingly.
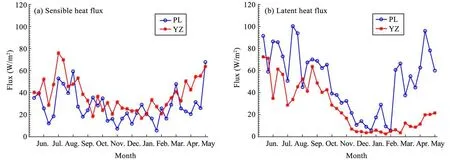
Figure 4 Annual mean variation of heat flux at Pingliang and Yuzhong
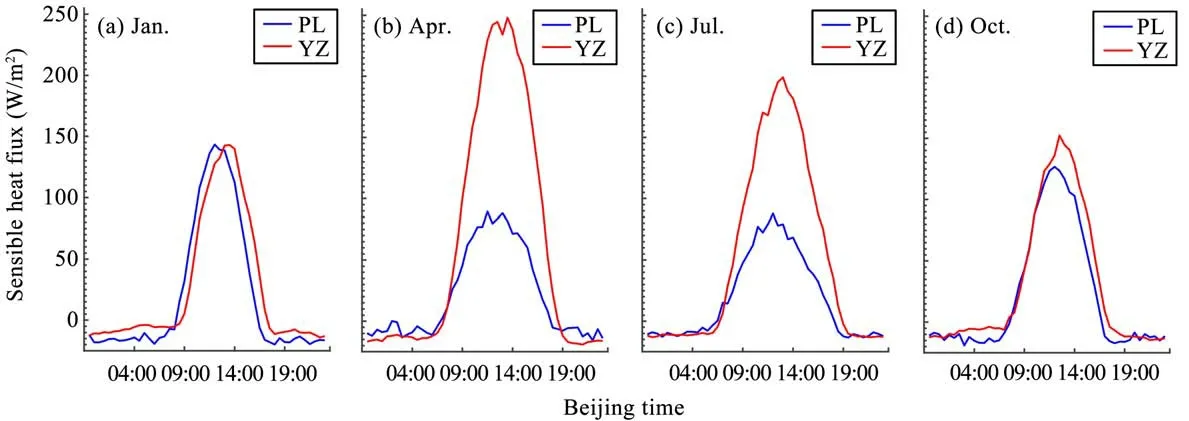
Figure 5 Daily average variation of sensible heat flux over four seasons at Pingliang and Yuzhong
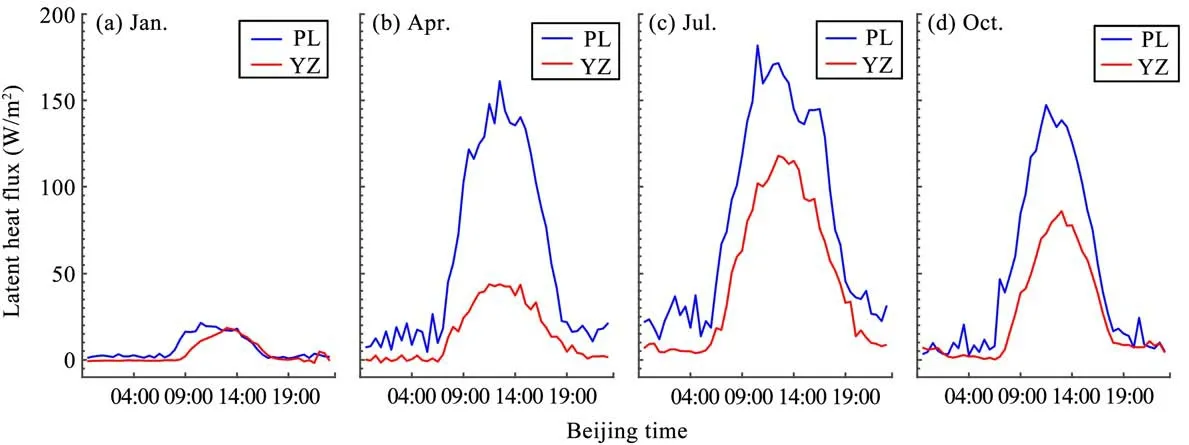
Figure 6 Daily average variation of latent heat flux over four seasons at Pingliang and Yuzhong
3.3 Comparison of soil-heat flux
Soil-heat flux is closely related to the temperature gradient and soil moisture.Figure 7 displays the annual mean variation of soil-heat flux in the three regions. It can be seen that the soil-heat fluxes in the three regions all showed clear seasonal differences. Specifically, the soil-heat flux in summer topped that in other seasons,which in descending order were spring,winter,and autumn.The annual mean soil-heat flux at Dunhuang,Yuzhong, and Pingliang was 1.00 W/m2, 0.82 W/m2, and-1.25 W/m2,respectively.As can be seen from the Figure 7,from March to August,the soil radiated heat into the air, and from September to February, the soil absorbed heat from the air. It was because there was no vegetation cover on the surface at Dunhuang; and the topsoil was a layer of gravelly sand,where the particles were big and the soil-water content was low, making soil pores filled with air and unfavorable to heat transfer. During the observation period, the soil-heat flux at the three places was abnormally large in March, which should be related to the fact that frozen soil absorbed heat at melting.Figure 8 shows the seasonal mean variation of soil-heat flux.The soil-heat flux in the three regions was a positive value in spring and summer,and a negative value in autumn and winter.That is,the atmosphere transferred heat to the soil in spring and summer, and the soil transferred heat to the atmosphere in autumn and winter. In spring and summer, the mean soil-heat flux at Yuzhong was the largest among the three regions, with 4.49 W/m2and 6.83 W/m2, respectively, indicating that the land at Yuzhong transported the most heat to the atmosphere in spring and summer.That was because the underlying surface at Yuzhong was grassland, which continuously released heat to the atmosphere with the growth of vegetation.
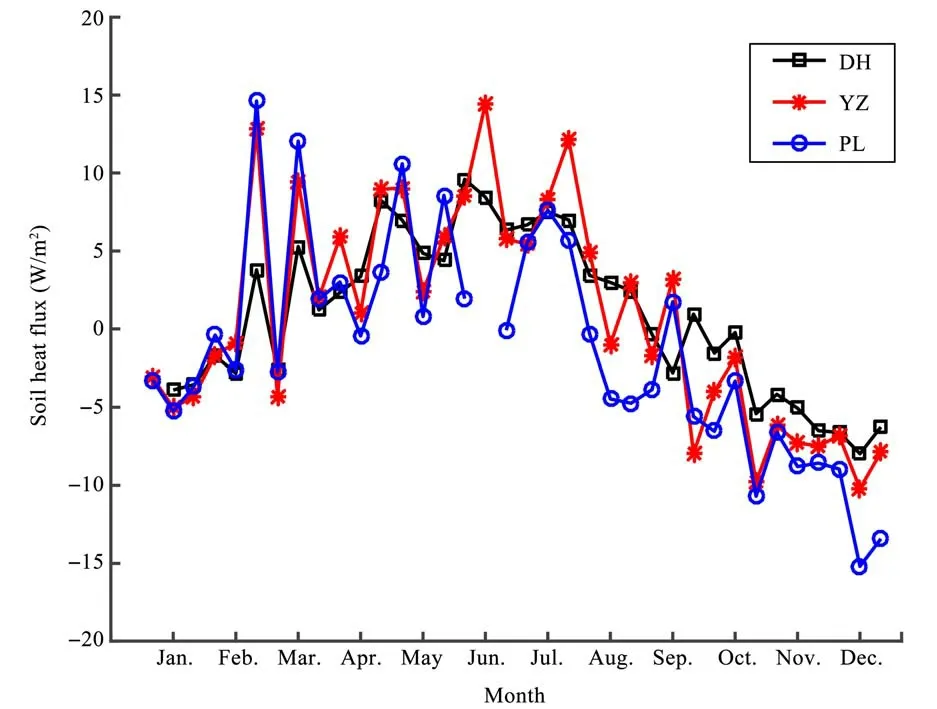
Figure 7 Annual mean variation of soil-heat flux at three stations
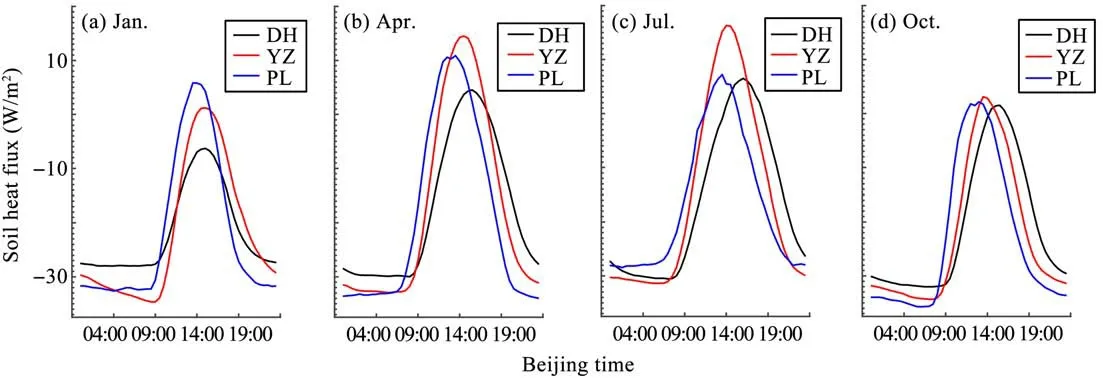
Figure 8 Seasonal mean variation of soil-heat flux at three stations
Figure 9 shows the annual mean variation of surface albedo in three regions, using 2012 observation data for Dunhuang and Pingliang, and 2010 observation data for Yuzhong. To reduce error at sunrise and sunset, the period from 09:30 to 16:30 was selected for comparison. The annual mean surface albedo was largest at Dunhuang, followed by that at Pingliang and the smallest at Yuzhong: 0.24, 0.21, and 0.18, respectively. In theory, surface albedo should show an increase with the increase of latitude. However, the actual situation was that the annual mean surface albedo at Pingliang was higher than that at Yuzhong,which may be caused by the difference of underlying surface. The underlying surface at Yuzhong was covered by grass all year, while there was no vegetation cover after harvest at Pingliang,which was thus better able to absorb short-wave solar radiation. Another possible reason was the lesser snowfall at Pingliang,raising surface albedo in winter, as well as the annual mean.
3.4 Comparison of the Bowen ratio
Figure 10 shows the annual mean Bowen ratio at Pingliang from June 2013 to May 2014 and at Yuzhong from June 2010 to May 2011. It can be seen from the figure that the annual variation trend of the Bowen ratio at Pingliang was relatively more gradual,only with obvious changes in winter when the daily mean could reach the maximum of about 3.28. However, the fluctuation of annual variation at Yuzhong was more obvious, especially in winter and spring,when the daily average Bowen ratio could reach 10.The annual average Bowen ratio at Yuzhong was about 2.06, while that at Pingliang was approximately-0.03. Yuzhong's showing a larger Bowen ratio was probably because Pingliang was relatively more humid and the soil-water content was higher. Generally,the Bowen ratio could reflect the hydrothermal characteristics of the land surface, and its variation trend showed a significant inverse correlation with precipitation. In winter, there was less precipitation, and the Bowen ratio was higher (Malek, 1993). It is worth mentioning that,from the end of July to the beginning of August, the Bowen ratio at Yuzhong reached a small peak, with a daily mean of about 3.23.According to historical precipitation data, there was almost no precipitation during this period at Yuzhong, and the soil moisture was low.
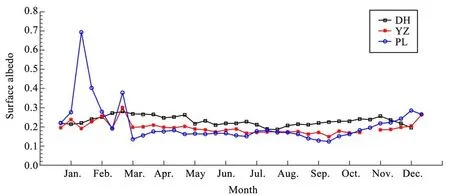
Figure 9 Annual mean variation of surface albedo at three stations
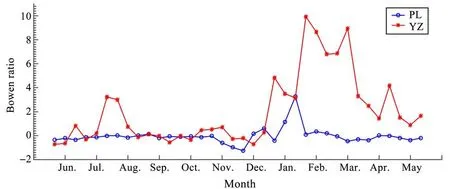
Figure 10 Annual mean variation of the Bowen ratio at Pingliang and Yuzhong
3.4 Comparison of soil thermal conductivity
Figure 11 shows the annual mean variation of soil thermal conductivity at Dunhuang, Yuzhong, and Pingliang; and the mean soil thermal conductivity was 0.26 W/(m·k), 1.15 W/(m·k), and 1.20 W/(m·k), respectively. The annual mean soil thermal conductivity at Dunhuang was smallest, with no obvious fluctuation,as soil thermal conductivity decreased with the increase of soil porosity; and the Gobi had less water content and larger porosity than the other two regions.Because the soil-heat flux was really small (around zero), especially when positive changed to negative or negative to positive, it was easy to amplify the error.Therefore, the soil-heat fluxes, which were very small,were eliminated during calculation(Li et al.,2017).
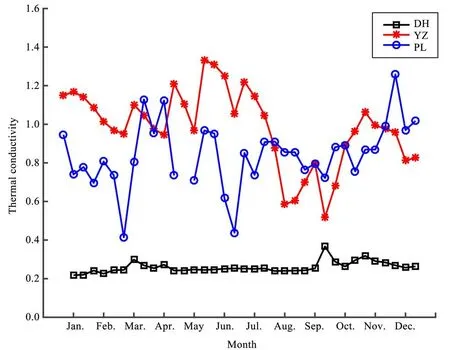
Figure 11 Annual mean variation of soil thermal conductivity at three stations
4 Conclusion and discussion
This research studied differences in the land-surface process in different climate regions in Northwest China by analyzing the annual, seasonal, and daily variations of surface energy and land-surface parameters in arid, semi-arid, and semi-humid areas; and the main conclusions are as follows:
(1) The annual mean net radiation was largest in the semi-humid area, followed by the semi-arid area,and then the arid area: 77.72 W/m2, 67.73 W/m2, and 55.47 W/m2, respectively. Net radiation reached its maximum at noon and its minimum after sunset in all seasons. Summer showed the largest mean net radiation, topping the other seasons, which in descending order were spring,autumn,and winter.
(2) The annual mean sensible heat flux in arid,semi-arid, and semi-humid areas was 85.7 W/m2,37.59 W/m2, and 27.55 W/m2, respectively. The annual mean latent heat flux was 0 W/m2,26.08 W/m2,and 51.19 W/m2, respectively. The annual mean soil-heat flux at the 5-cm soil layer in arid, semi-arid, and semi-humid areas was 1.00 W/m2, 0.82 W/m2, and-1.25 W/m2, respectively. For all three regions, the soil-heat flux in spring and summer was a positive value; and that in autumn and winter was a negative:that is, heat was transferred from the atmosphere to the soil in spring and summer, and transferred from the soil to the atmosphere in autumn and winter.
(3) The annual mean surface albedo was the largest in the arid area, followed by the semi-humid area;and the smallest was in the semi-arid area: 0.24, 0.21,and 0.18, respectively. The annual average Bowen ratio in the semi-arid area was about 2.06, and that in the semi-humid area was about -0.03, which once again indicated that semi-arid area was drier than the semi-humid area. The annual mean soil thermal conductivity in the arid, semi-arid, and semi-humid areas was 0.26 W/(m∙k),1.15 W/(m∙k),and 1.20 W/(m∙k),respectively.
This study was limited by the fact that it selected only Dunhuang, Yuzhong, and Pingliang stations as representatives of arid, semi-arid, and semi-humid areas, so the conclusions are subject to further research and verification. It should be pointed out that due to the different intentions of the observational instruments set up in the three stations,the height and depth of the instruments (as well as the testing time) were slightly different, which may have certain impacts on the results. Although the observational time of the three stations in this paper was not completely consistent, the characteristics of surface energy flux in each region could be generally reflected, as the underlying surface of each site was basically constant, with little change, and there was no great change in the climate in those years. Moreover, the quantitative relationship between each parameter and its influencing factors is worth further study.
 Sciences in Cold and Arid Regions2019年4期
- Sciences in Cold and Arid Regions的其它文章
- Effects of gibberellic acid on tiller-bulb number and growth performance of Lilium davidii var.unicolor
- Holocene lake carbon sequestration,hydrological status and vegetation change,China
- A paleo-hydrological simulation experiment and its verification in an inland basin
- Influence of frost weathering on the recession of surfaces of technogenic landforms in Yakutia
- Editors-in-Chief Guodong Cheng and Ximing Cai
- Guidelines to Authors