Quantitative diffusion-weighted magnetic resonance enterography in ileal Crohn's disease: A systematic analysis of intra and interobserver reproducibility
Hao Yu, Ya-Qi Shen, Fang-Qin Tan, Zi-Ling Zhou, Zhen Li, Dao-Yu Hu, John N Morelli
Abstract BACKGROUND Magnetic resonance enterography (MRE) is increasingly attractive as a noninvasive and radiation-free tool for assessing Crohn's disease (CD). Diffusionweighted imaging (DWI) is recommended as an optional MRE sequence for CD by the European Society of Gastrointestinal and Abdominal Radiology, and has shown a superb potential as a quantitative modality for bowel inflammation evaluation. However, the measurement reproducibility of quantitative DWI analysis in MRE has not been ascertained so far. To facilitate the application of quantitative diffusion-weighted MRE in the clinical routine, systematic investigations of the intra and interobserver reproducibility of DWI quantitative parameters should be performed.AIM To evaluate the intra and interobserver reproducibility of quantitative analysis for diffusion-weighted MRE (DW-MRE) in ileal CD.METHODS Forty-four subjects (21 with CD and 23 control subjects) who underwent ileocolonoscopy and DW-MRE (b = 800 s/mm2) within one week were included.Two radiologists independently measured apparent diffusion coefficients (ADC)of the terminal ileum and signal intensity ratio (SR) of the terminal ileum to ipsilateral psoas muscle on DWI images (b = 800 s/mm2). Between- and withinreader agreements were assessed using intraclass correlation coefficients (ICC),coefficients of variation (CoV), and 95% limits of agreement of Bland-Altman plots (BA-LA LoA). Diagnostic performances of ADC and SR for identifying selected by an in-house editor and fully peer-reviewed by external reviewers. It is distributed in accordance with the Creative Commons Attribution Non Commercial (CC BY-NC 4.0)license, which permits others to distribute, remix, adapt, build upon this work non-commercially,and license their derivative works on different terms, provided the original work is properly cited and the use is non-commercial. See:http://creativecommons.org/licen ses/by-nc/4.0/Manuscript source: Unsolicited manuscript Received: April 17, 2019 Peer-review started: April 17, 2019 First decision: May 9, 2019 Revised: May 20, 2019 Accepted: June 8, 2019 Article in press: June 8, 2019 Published online: July 21, 2019 P-Reviewer: Bruining DH, Gallego J, López-Serrano A S-Editor: Ma RY L-Editor: Wang TQ E-Editor: Ma YJ inflamed terminal ileum from the normal were evaluated by receiver operating characteristic (ROC) curve analysis.RESULTS There were no significant differences in ADC or SR values between the two sessions or between the two radiologists either in the CD or control group (paired t-test, P > 0.05). The intra and interobserver reproducibility of ADC (ICC: 0.952-0.984; CoV: 3.73-6.28%; BA-LA LoA: ±11.27% to ±15.88%) and SR (ICC: 0.969-0.989; CoV: 3.51%-4.64%; BA-LA LoA: ±10.62% to ±15.45%) was excellent for CD.Agreement of ADC measurements was slightly less in control subjects (ICC:0.641-0.736; CoV: 10.47%-11.43%; BA-LA LoA: ± 26.59% to ± 30.83%). SR of normal terminal ileum demonstrated high intra and interobserver reproducibility(ICC: 0.944-0.974; CoV: 3.73%-6.28%; BA-LA LoA: ± 18.58% to ± 24.43%). ADC and SR of two readers had outstanding diagnostic efficiencies (area under the ROC curve: 0.923-0.988).CONCLUSION Quantitative parameters derived from DW-MRE have good to excellent intra and interobserver agreements with high diagnostic accuracy, and can serve as robust and efficient quantitative biomarkers for CD evaluation.
Key words: Magnetic resonance imaging; Diffusion-weighted imaging; Crohn's disease;Ileum; Reproducibility
INTRODUCTION
Crohn's disease (CD) is a life-long, relapsing, chronic inflammatory disease of the gastrointestinal tract that most frequently involves the terminal ileum[1]. Serial evaluation including monitoring of disease and assessment of treatment efficacy is important throughout the patient's life[2-4]. For non-invasive assessment, magnetic resonance (MR) enterography (MRE) is increasingly attractive as an ionizing radiation-free supplement to endoscopy in assessment of CD patients[5-8]. MRE presents several advantages as it not only assesses abnormalities of the bowel lumen[5], but also identifies extra-intestinal complications (abscesses or fistulae)[2,6],offers an assessment of the whole gastrointestinal tract[8], and has the merit owing to its high soft tissue contrast[9,10]. Since the conventional MRE is based upon the qualitative morphological assessment of a lesion, an accurate quantitative MR technique may enable a more objective assessment of clinical therapeutic effect[6,9].
As a promising functional MR imaging (MRI) technique[7,9-12], diffusion-weighted imaging (DWI) could qualitatively and quantitatively evaluate random motion of water molecules at the microstructural level in biological tissues, and is recommended as an optional sequence for CD by the European Society of Gastrointestinal and Abdominal Radiology in the latest consensus statements[13]. Meanwhile, DWI has been shown to be an alternative to contrast-enhanced MRI for the detection of inflamed segments in CD patients, and is suitable for the patients who cannot receive intravenous contrast agents[6,14]. Furthermore, the latest consensus recommendations pointed out that restricted diffusion on DWI was a valuable and supportive sign correlating with the inflammatory lesions demonstrated on endoscopy[15,16]. The apparent diffusion coefficient (ADC) derived from DWI has been reported as a potential quantitative biomarker for monitoring the course of disease and therapeutic efficiency in patients with CD[17].
However, ADC values calculated from DWI could be degraded by variations in field homogeneity, eddy currents, and motion, particularly in hollow organs like the gastrointestinal tract or gallbladder[5,18]. And systematic investigations on measurement reproducibility of quantitative DWI analysis in MRE have not been ascertained so far. The characterization of reader agreement and variability with quantitative parameters is imperative before such parameters are to be incorporated into clinical practice[19-21]. As ADC values could be affected by the image mismatch calculated from DWI with at least two b values[5,8], we proposed an abbreviated proxy for diffusion restriction, a signal intensity ratio (SR), between the terminal ileum and ipsilateral psoas muscle on DWI with an appropriate b value (800 s/mm2), and explored the application of SR and ADC values in CD patients.
The purpose of this study was to investigate the level of inter and intraobserver agreement for ADC and SR measurements from DWI in the terminal ileum, and then to assess the diagnosis efficiency of quantitative ADC and SR for the evaluation of CD.
MATERIALS AND METHODS
Patients
The study was approved by our institutional review board, and informed consent was waived for the retrospective study design. From November 2015 to May 2018, a total of 297 patients underwent MRE examinations for suspected gastrointestinal disorders at our gastrointestinal medical center of the referral university-based hospital. Sixtyone patients were included based on the follow criteria: (1) Complete clinical data available; (2) DWI with a b-value of 800 s/mm2included in the MRE protocol; (3)Colonoscopy was successfully conducted to assess the terminal ileum within one week of the MR enterography; and (4) No bowel surgery performed prior to MRI examination. Among the 61 patients, 12 diagnosed with other diseases and 5 with inadequate MRE images due to serious artifacts were excluded. Finally, the remaining 44 patients, including 21 with CD involving the terminal ileum and 23 with a normal terminal ileum as control subjects, were included for the further analysis. A flowchart of the study population is shown in Figure 1. The diagnosis of CD was confirmed by clinical information and a combination of endoscopic, histological, and radiological investigations according to the European Crohn's and Colitis Organization criterion[22].
MRI data acquisition
MRE was performed in a supine position using a 3.0-T GE scanner (Discovery MR750;GE Healthcare, Milwaukee, WI, United States) with a 32-channel torso phased array body coil. Per protocol, all patients had fasted for at least 6 h before MRE. To achieve adequate distension of the small bowel, about 1500 mL of 2.5% isosmotic mannitol solution was administered orally to the patients 45 min prior to MR scanning.Anisodamine 10 mg was administered intramuscularly 5 min before the MR examination to reduce bowel peristalsis. Conventional MRE was acquired including T2-weighted single shot fast spin echo (SSFSE; TR/TE: a respiratory cycle/68 ms, matrix:288 × 288, slice thickness: 4 mm for coronal/5 mm for axial), the fast imaging employing steady state acquisition (FIESTA; TR/TE: 3.2/1.2 ms, matrix: 288 × 288,slice thickness: 4 mm for coronal/5 mm for axial, flip angle: 45 degrees), and coronal and axial T1 weighted three-dimensional fast spoiled gradient echo (liver acquisition with volume acceleration sequence, LAVA; TR/TE: 3.8/1.7 ms, matrix: 260 × 210, slice thickness: 4 mm, flip angle: 15 degrees).
The axial DWI sequence was obtained using single shot echo planar imaging (SSEPI; TR/TE: a respiratory cycle/minimum, field of view: 38.0 cm × 30.4 cm, matrix:160 × 128, slice thickness: 6 mm) with b values of 0 and 800 s/mm2; the number of excitations (NEX) was 6. The total acquisition time of the whole examination for every patient was approximately 25 min depending on the patient's respiratory rate.
Image analysis
All images were transferred to a workstation (Advantage Workstation 4.6, GE Healthcare) where ADC maps were generated by using a mono-exponential fit. Two gastrointestinal radiologists (R1 with 5 years of experience and R2 with 3 years of experience), both blinded to clinical details as well as endoscopy results, measured the signal intensity (SI) of the terminal ileum (defined as the final 10 cm of the small bowel) and ipsilateral psoas muscle on DWI images with b = 800 s/mm2. Separately and simultaneously, ADC values for the terminal ileum were recorded. For the SI and ADC measurements in the terminal ileum, the images were magnified, and three oval regions of interest (ROI), as large as possible (12-30 mm2) to encompass the bowel wall, were placed on the area of brightest signal on the DWI along with hypointensity on ADC maps (Figure 2), as having been described in previous studies[9,23]. The means of the three measurements (SI and ADC) were used for the further analysis. Then, SI of the psoas muscle on DWI with b = 800 s/mm2was measured by placing a larger oval ROI (60-100 mm2). The SR of the terminal ileum to ipsilateral psoas muscle was calculated according to the prior studies[24,25]by the equation: SR = SIileum/SImuscle, where SIileumand SImusclerepresent the measured SI of the terminal ileum and ipsilateral psoas muscle, respectively. After a washout period of 4 wk, the same two radiologists repeated the above described measurements to assess intraobserver agreement.
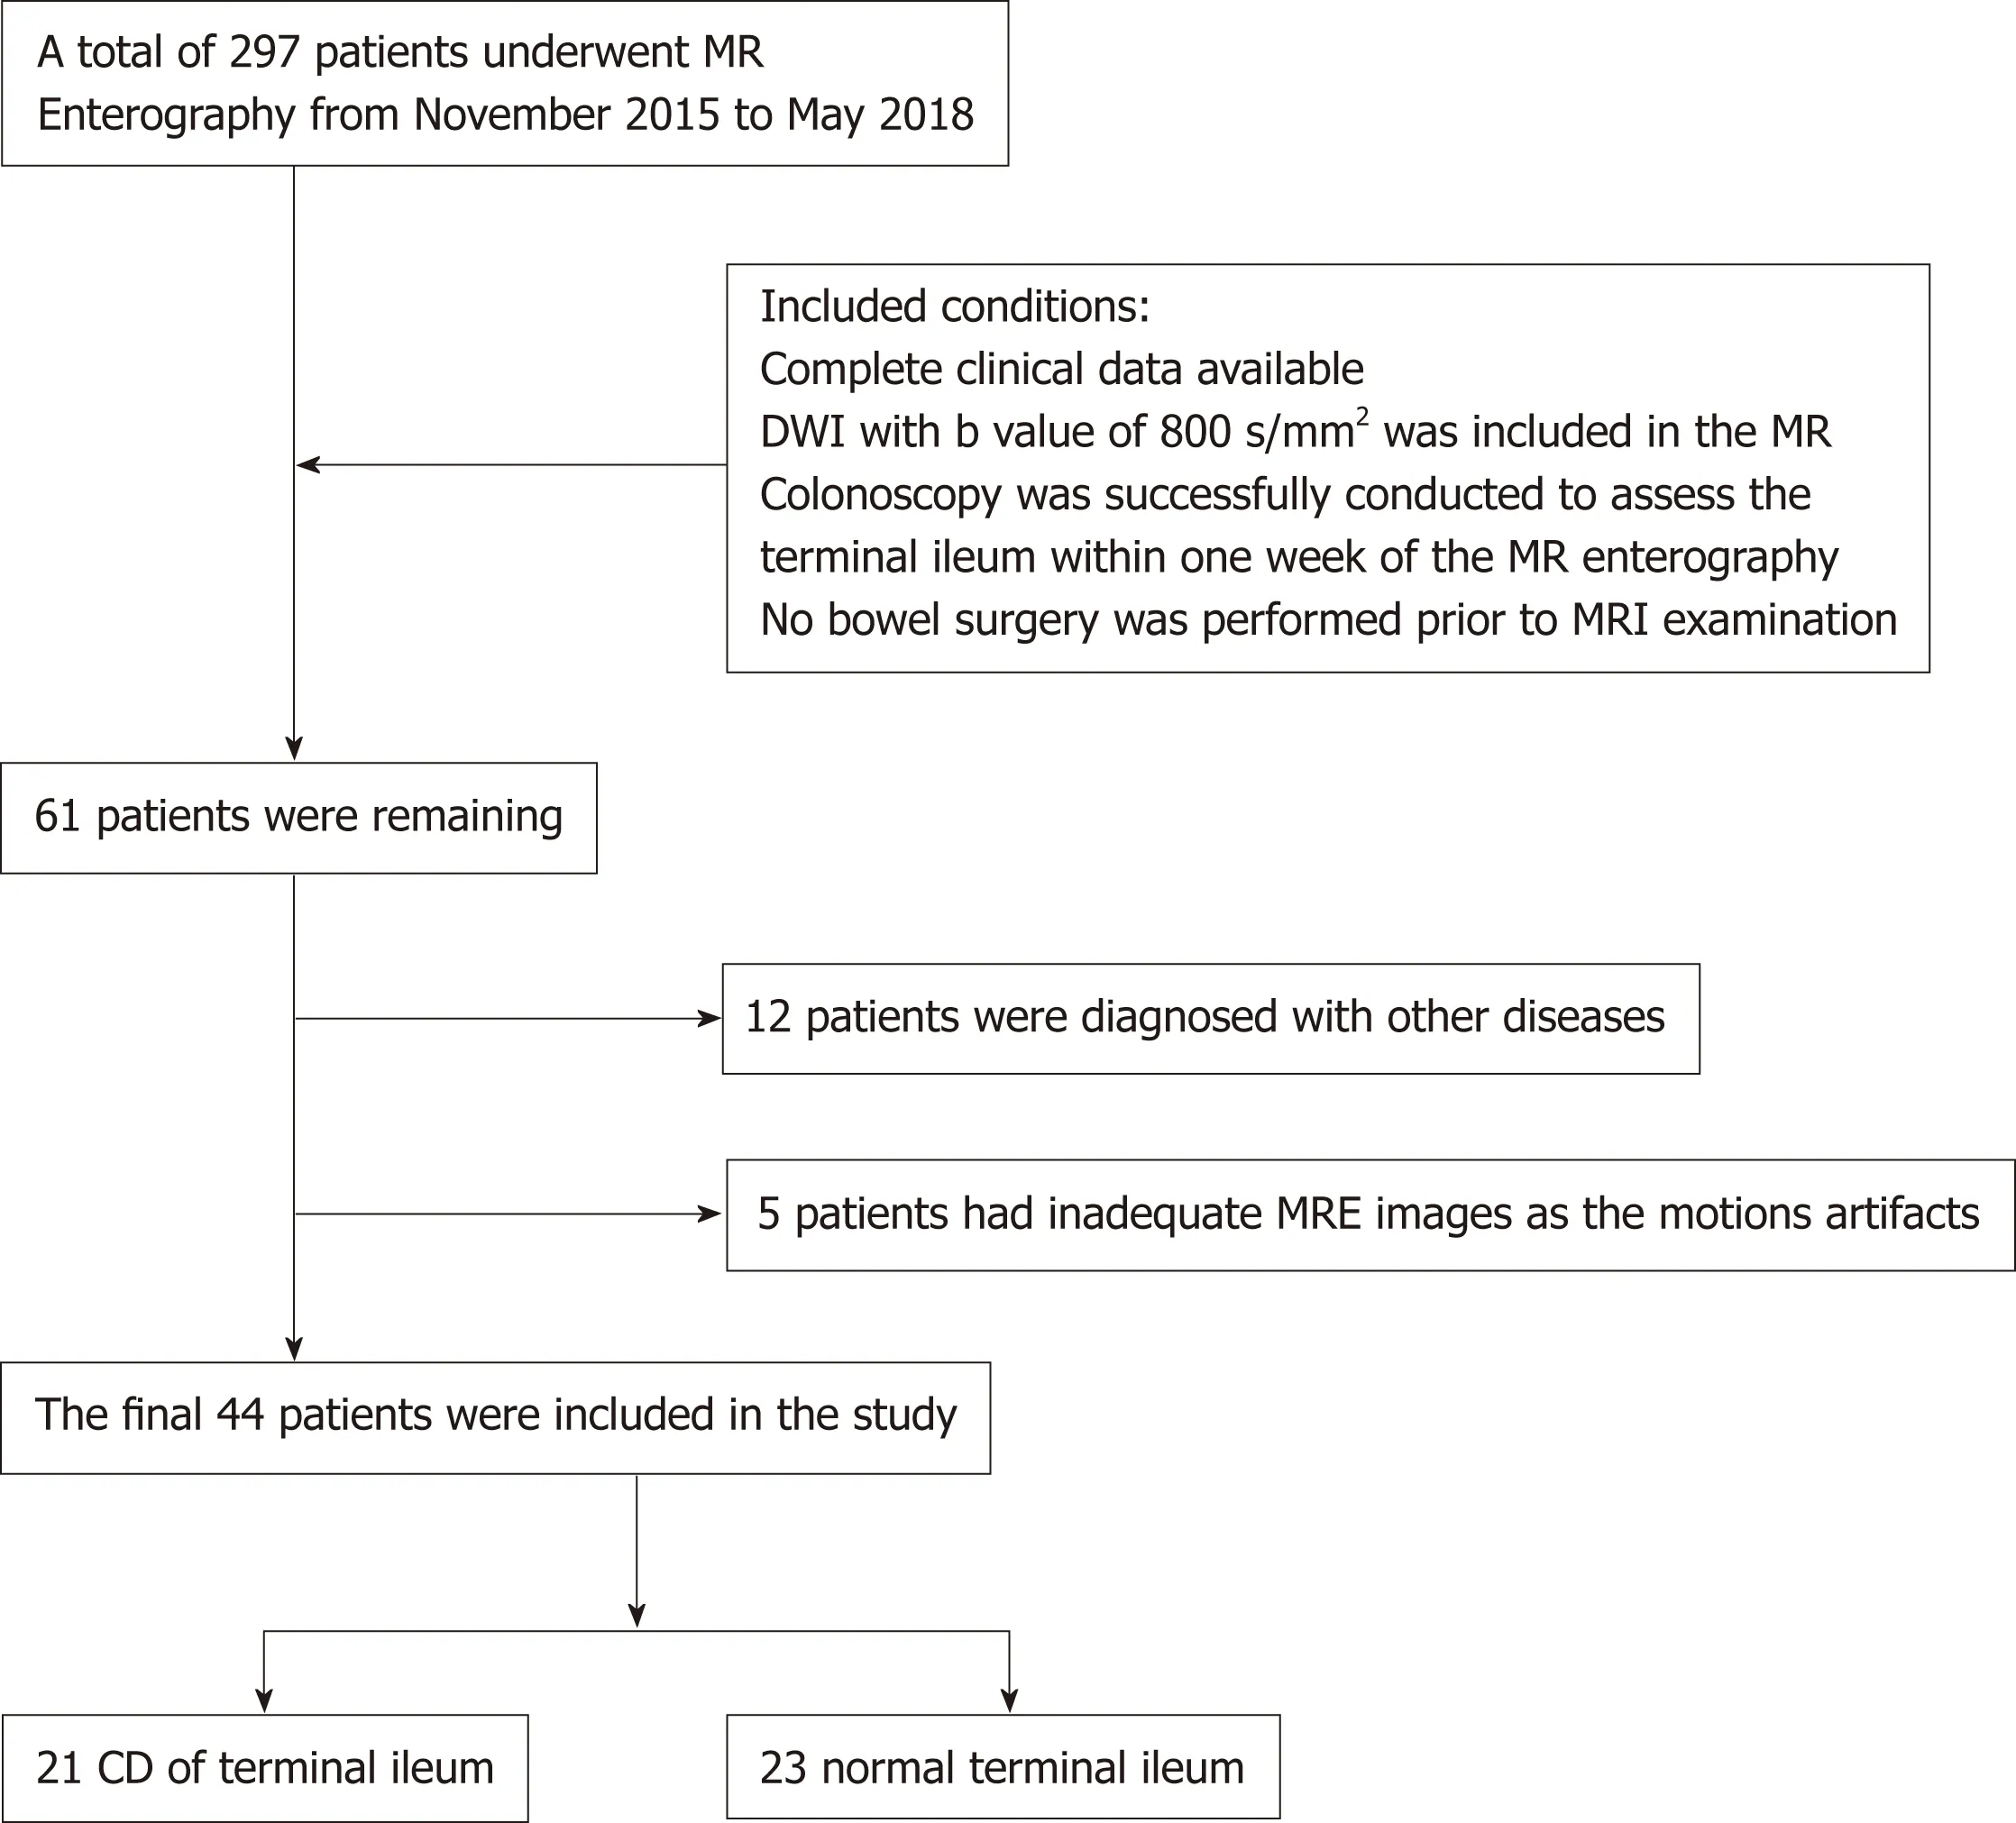
Figure 1 Flow chart illustrating study design. DWI: Diffusion weighted imaging; CD: Crohn's disease.
Reference standard: Endoscopy assessment
The terminal ileum of all the subjects was assessed by ileocolonoscopy as the reference standard. Prior endoscopy, bowel preparation was performed via oral ingestion of about 4 L of polyethylene glycol solution according to the standard protocol. Endoscopy was successfully conducted to assess the terminal ileum in all of the included patients. Endoscopic analysis of the terminal ileum was performed by an endoscopist with 10 years of experience who was blinded to MRE results and clinical data. The colonoscopy findings of the terminal ileum, such as overt ulcers, aphthoid lesions, and erythema or edema, were considered as inflammatory conditions[17,22].
Statistical analysis
Statistical calculations were performed using the Statistical Package for the Social Sciences Software Package (SPSS Statistics, version 20.0; SPSS Inc., Chicago, IL, United States) and MedCalc (release 15.2.2; MedCalc Software, Mariakerke, Belgium). The normal distribution of quantitative parameters was ascertained by the Kolmogorov-Smirnov test. Differences in ADC and SR between the two readers and two sessions within the CD and control groups were compared using a paired t t-test. Inter and intraobserver agreements for SR and ADC measurements were assessed using the intraclass correlation coefficient (ICC), coefficients of variation (CoV) from duplicate measurements, and the Bland-Altman analysis with 95% limits of agreement (LoA).ICC was interpreted as follows: 0.00-0.20, poor; 0.21-0.40, fair; 0.41-0.60, moderate;0.61-0.80, good; 0.81-1.00, excellent. Diagnostic efficiency of the DWI parameters was determined by receiver operating characteristic (ROC) curve analyses. The comparison of the areas under ROC curve (AUROC) was performed between SR and ADC using the method of Delong et al. Spearman's correlation test was used to identify correlation between SR and ADC values in CD patients. P-values less than 0.05 were considered statistically significant.
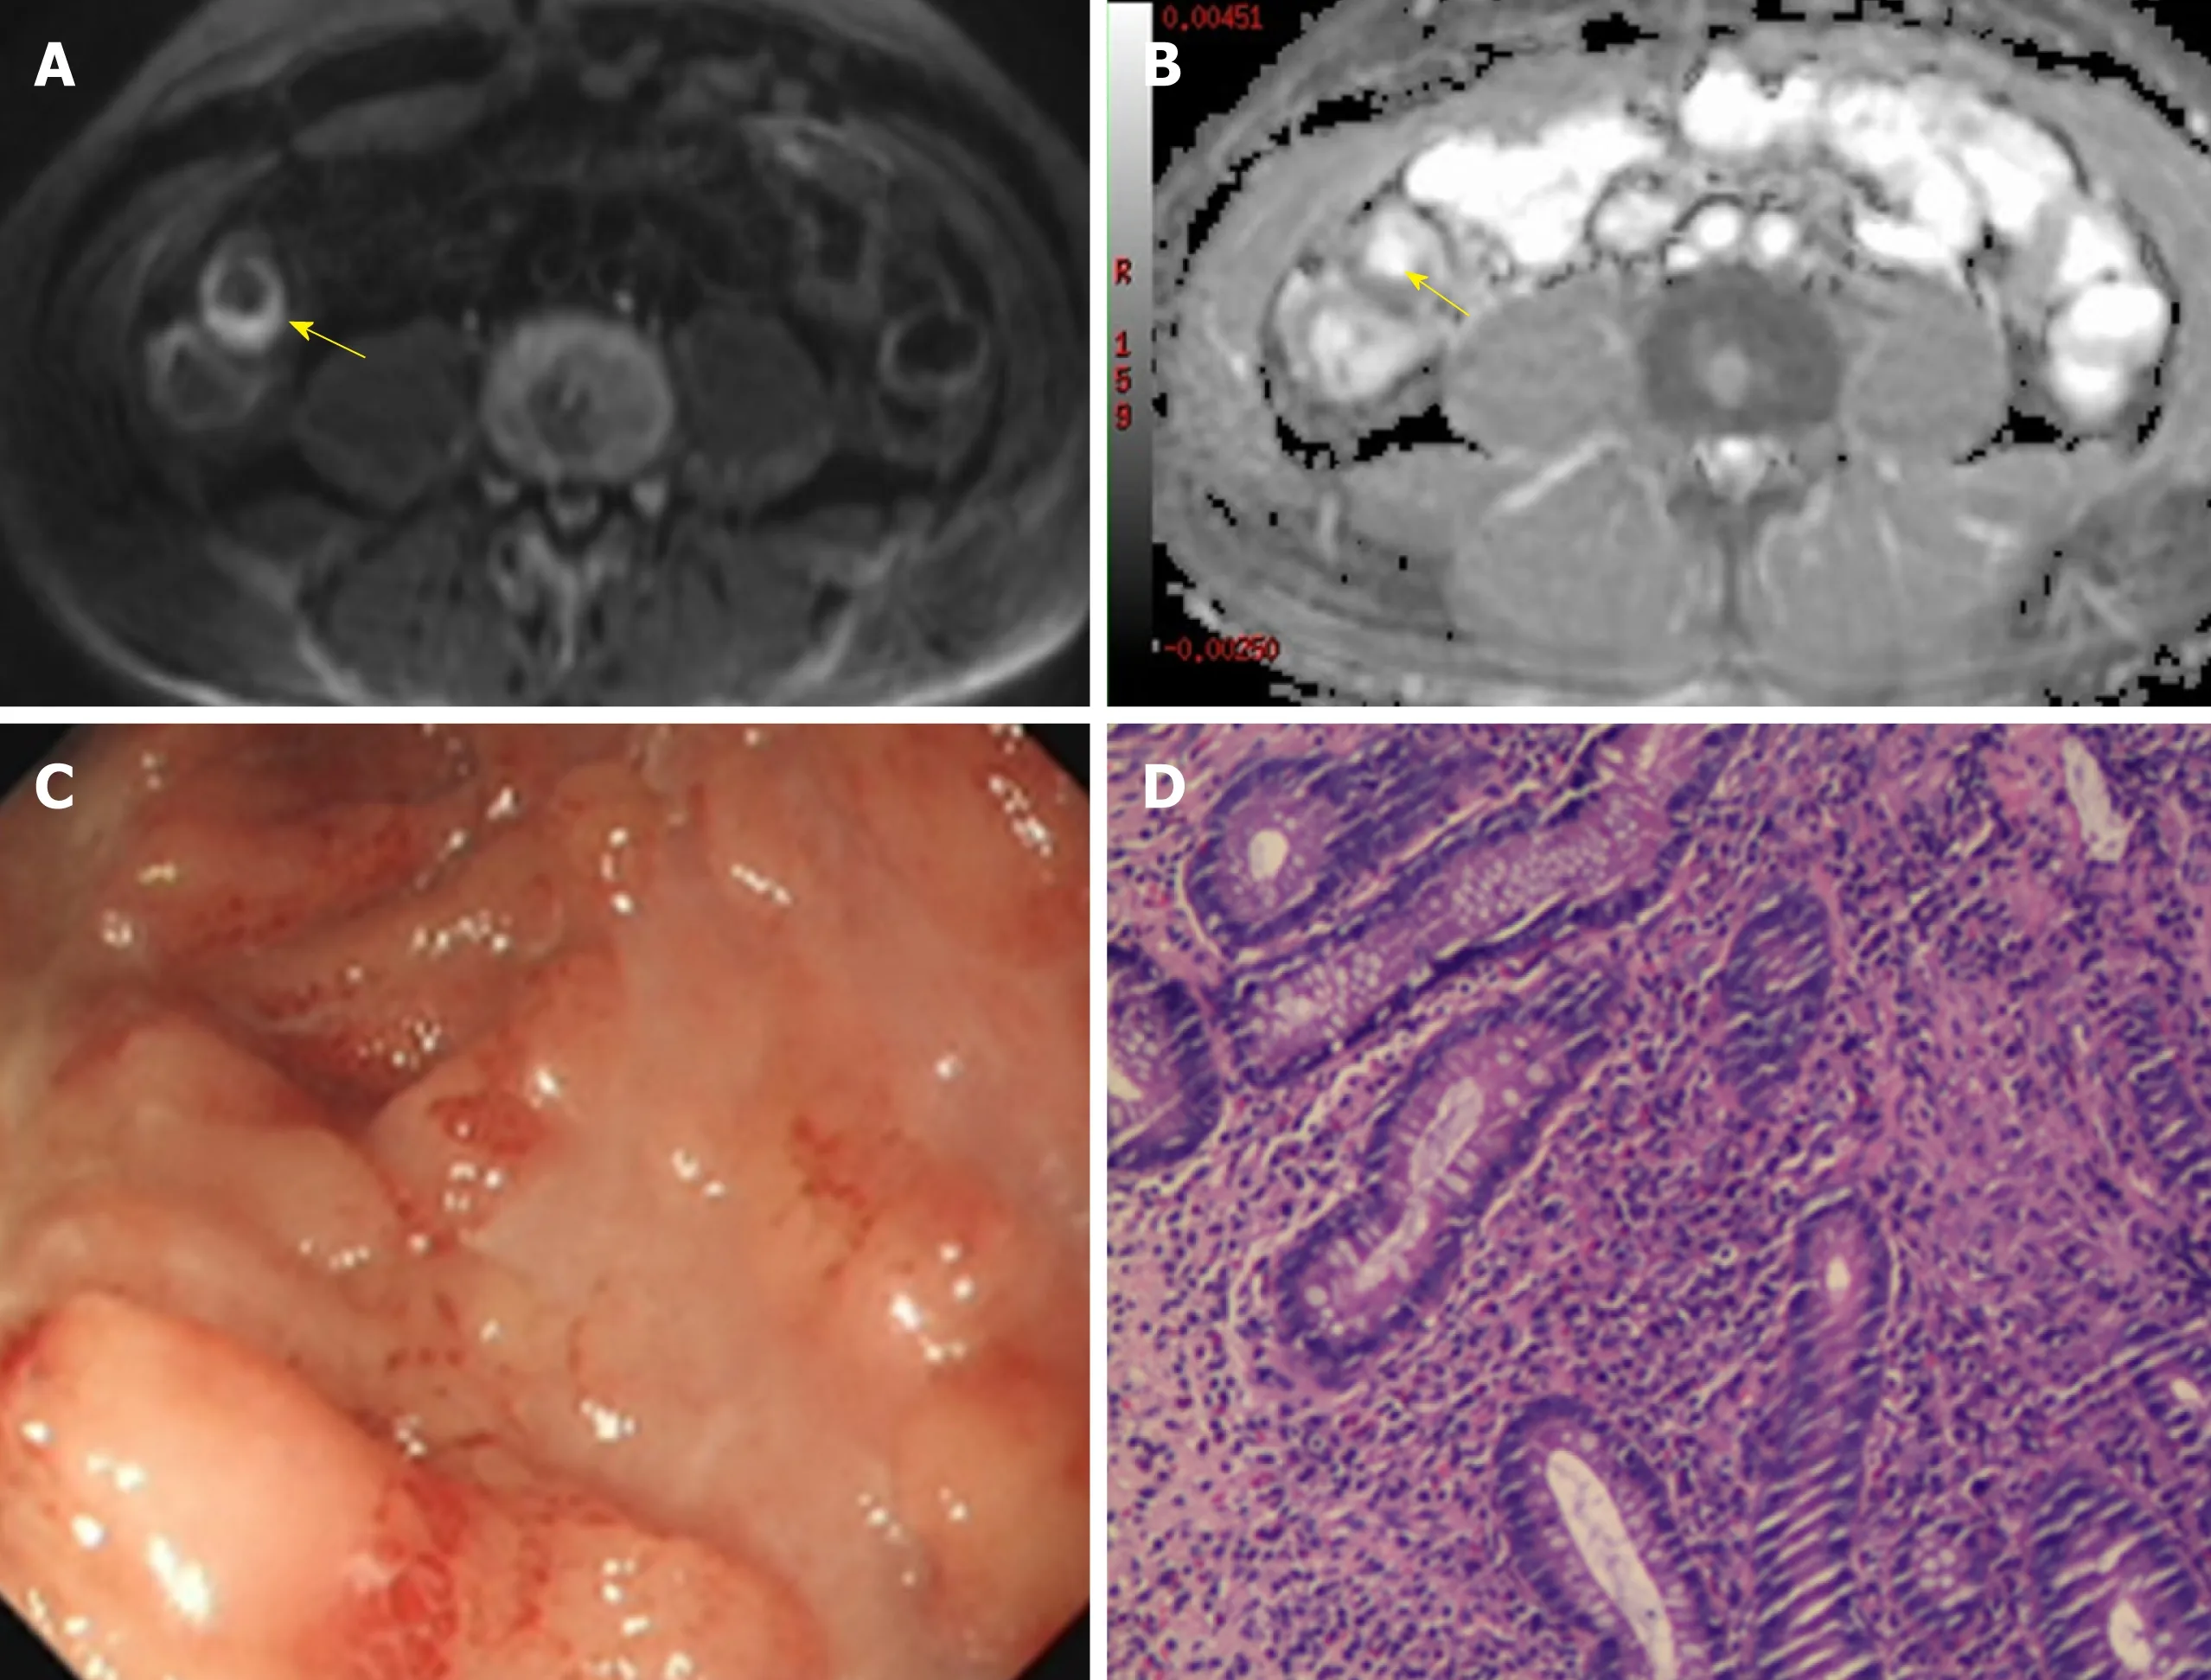
Figure 2 A 48-year-old man with Crohn's disease involving the terminal ileum. A: Axial diffusion-weighted imaging with b = 800 s/mm2 demonstrated high signal intensity of the terminal ileum (arrow). B: The terminal ileum was hypointense (arrow) on the corresponding apparent diffusion coefficient map. C: Ileocolonoscopy showed mucosal ulcers. D: Histopathology demonstrated neutrophil infiltration.
RESULTS
Patient characteristics
A total of 44 subjects (age: Mean ± SD, 44.9 ± 15.7 years; 22 males and 22 females)were included in this study, and all of the DWI images were eligible for evaluation.Twenty-three control subjects had a normal terminal ileum in colonoscopy examination. The remaining 21 CD patients with the terminal ileum involved presented 12 overt ulcers, 5 aphthoid lesions, and 4 erythema or edema conditions according to endoscopy. The patients' data of this cohort are summarized in Table 1.
Comparisons of quantitative ADC and SR between two reading sessions or two radiologists
There were no significant differences (paired t-test, P > 0.05) in ADC or SR values between the two sessions or between the two radiologists either in the CD or control group (Tables 2 and 3). The intra and interobserver agreements of quantitative DWI parameters measurements are shown in Tables 2 and 3 and Figures 3 and 4.
Intraobserver agreement analysis
The intraobserver agreement for SR was excellent in both the CD and control groups with similar results obtained by the two readers (R1: ICC = 0.989, CoV = 3.51%; R2:ICC = 0.979, CoV = 4.64% for CD and R1: ICC = 0.974, CoV = 5.93%; R2: ICC = 0.944,CoV = 8.69% for the normal). Similarly, the ADC measurements in the CD group showed excellent intraobserver reproducibility (R1: ICC = 0.952, CoV = 6.28%; R2: ICC= 0.977, CoV = 4.71%). However, intraobserver agreement was inferior when measuring the ADC on the normal terminal ileum (R1: ICC = 0.736, CoV = 10.47%; R2:ICC = 0.711, CoV = 10.64%). Bland-Altman plots for intraobserver agreement showed rather narrow 95% LoA ranges except for the ADC measurements in the control group; no systematic bias between sessions was present (Figure 3).

Table 1 Clinical characteristics of included subjects
Interobserver agreement analysis
Similar to the analysis of intraobserver reproducibility, all ADC measurements in the CD group and SR in both the CD and normal groups demonstrated excellent interobserver agreement (Table 3). The lowest agreement and highest variability between readers were observed in ADC measurements of the control group (first session: ICC = 0.641, CoV = 11.43%; second session: ICC = 0.736, CoV = 11.07%).Similarly, only the interreader ADC measurements for the control group demonstrated broad 95% LoA ranges (-33.93% to 25.96% for first session; -32.03% to 29.62% for second session) as illustrated in Figure 4.
Spearman's correlation analysis between SR and ADC values in the CD patients
The correlation between the quantitative DWI parameters of SR and ADC is shown in Figure 5. SR was moderately and negatively correlated with ADC values in CD patients for both readers (R1: r = - 0.438, P = 0.047; R2: r = - 0.485, P = 0.026).
Diagnostic efficiency of ADC and SR for differentiating inflammatory bowel segments from the normal
Due to the good to excellent intraobserver agreement of ADC and SR measurements in two sessions of the two readers, the mean ADC and SR values were calculated based on an average from the two sessions for further analysis. ADC and SR from both readers achieved a high diagnostic accuracy for differentiating inflammatory segments from the normal bowel with high sensitivities and specificities (Table 4 and Figure 6). The areas under the ROC curve for SR (R1: 0.981; R2: 0.988) were slightly better than those of ADC (R1: 0.923; R2: 0.929), but these differences were not statistically significant (P-values: 0.117 for R1; 0.067 for R2). The cutoff values maximizing sensitivity and specificity for ADC and SR parameters were approximately 1.80 × 10⁻³mm2/s and 2.00, respectively.
DISCUSSION
DW-MRE has been increasingly utilized for the noninvasive evaluation of CD over the last few years[5-10,14,26]. Meanwhile, quantitative analysis of DW-MRE is gradually drawing attention as an objective biomarker for bowel inflammation[9,17,26-28]. ADC values along with the Clermont score have been reported as having excellent accuracy for identifying inflamed bowel segments and evaluating therapeutic response in CD patients[17,23,26]. However, the measurement agreement for DW-MRE quantitative parameters has not been ascertained to date[8]. To facilitate the application of quantitative DW-MRE into the clinical routine, a thorough study of the intra and interobserver reproducibility of DWI quantitative parameters should be performed,similar to what has been done in other organs[19,20].
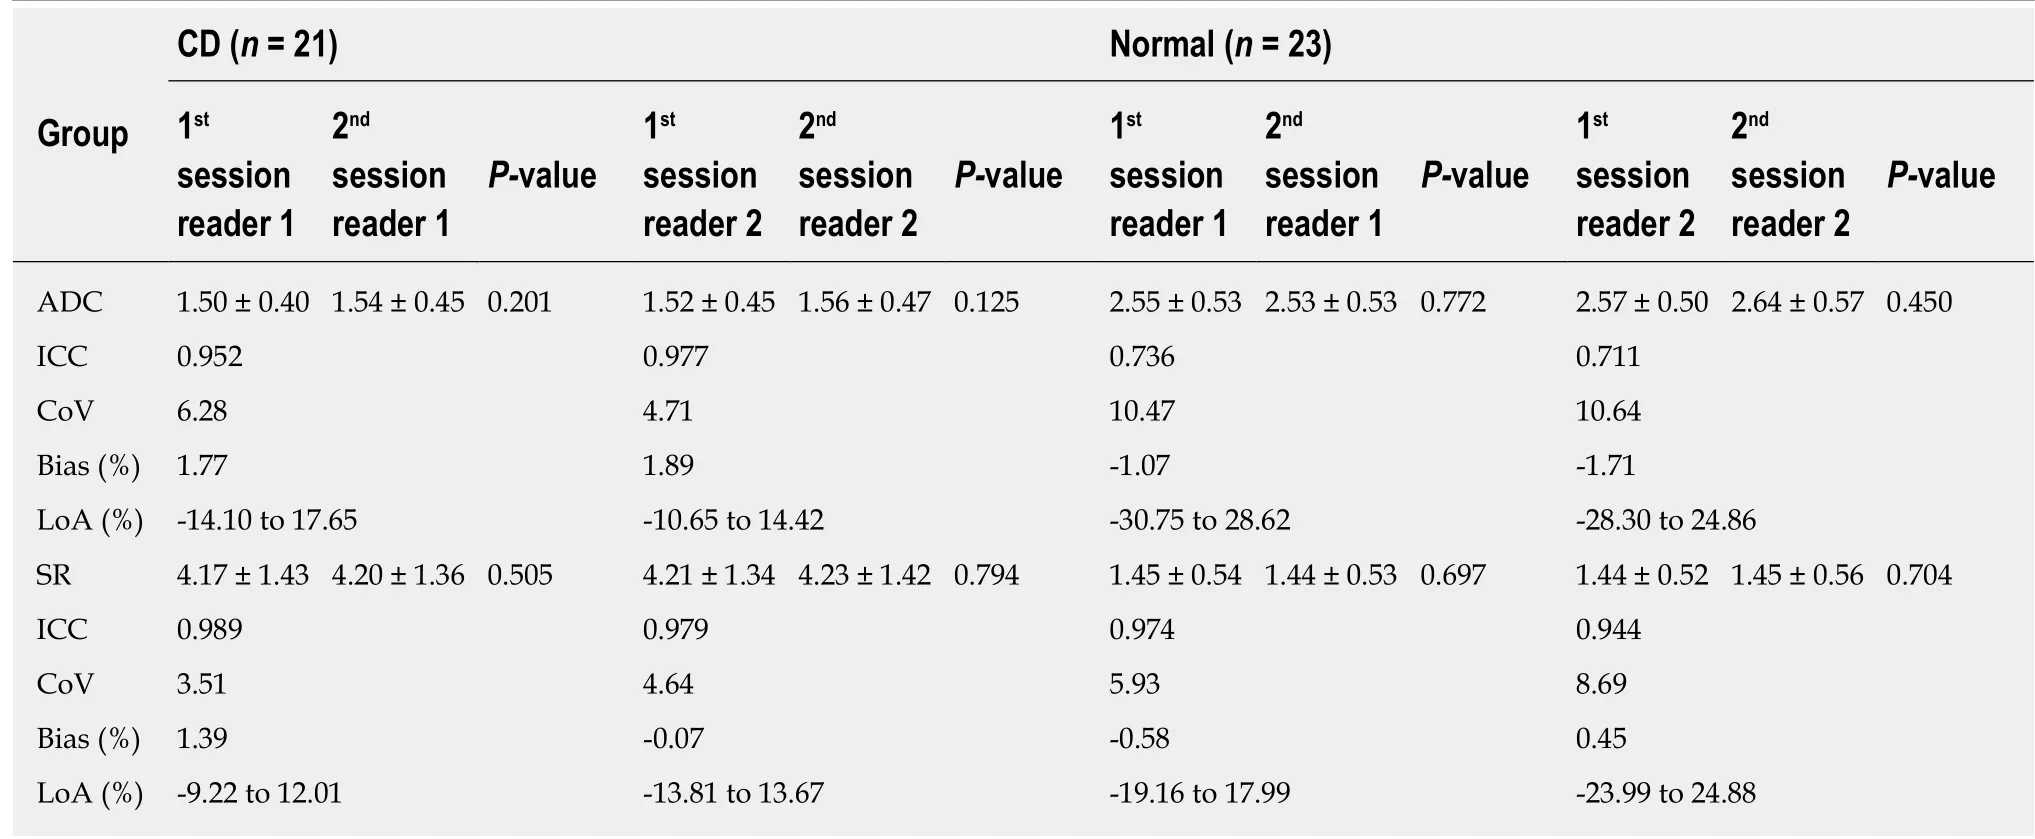
Table 2 lntraobserver agreement and variability of apparent diffusion coefficient and signal ratio measurements between the two readers over two sessions
In the current study, intra and interobserver agreements of ADC measurements in CD patients were excellent with high ICC, low CoV, and a limited 95% LoA range(Tables 2 and 3). ADC values of the terminal ileum in the CD group were robust both between and within individual readers, suggesting that different radiologists could obtain comparable ADC values in CD patients over time. In previous studies[9,23,29],interobserver agreement of measured ADC values in CD patients was also superb with high ICC, similar to our results of ADC analysis between radiologists. As the same with ADC values, excellent intra and interobserver agreements of SR measurement were found in inflamed terminal ileum. As expected, SR demonstrated moderately negative correlations with ADC in CD patients in both readers (Figure 5),indicating that SR could also represent the diffusion condition on DWI just like the ADC value. Therefore, both ADC and SR could act as the robust and quantitative methods for the evaluation of CD patients.
Although the comprehensive Clermont score has been introduced as a valuable tool for the ileal CD assessment in academic studies[12,23,26], the calculation of Clermont score is based on quantitative ADC values and wall thickness along with qualitative signs of bowel ulcer and mural edema. As a completed quantitative analysis of DWI in this study, Clermont score was not applied for its qualitative signs on conventional MRE. And the Kappa values of inter-reader agreement were only fair for the presence of ulcer (0.34) and moderate for the presence of mural edema (0.47) on conventional MRE[30]. Furthermore, ADC values were reported to have similarly high diagnostic performance for CD patients compared with Clermont score in prior studies[9,23]. In addition, ADC measurement from the post-processing ADC maps and SR of the terminal ileum to ipsilateral psoas muscle on b = 800 s/mm2images are relatively convenient to implement in the daily clinical practice.
However, the measured ADC in normal terminal ileum demonstrated lower agreement between sessions and readers (ICC: 0.641-0.736; CoV: 10.47%-11.43%; BALA LoA: ±26.59% to ±30.83%). This might be due to more pronounced partial volume effects of the thin normal intestinal tissues during the ROI placement compared to the thickened inflammatory segments[5]. Additionally, post-processing ADC maps are generated by applying a mono-exponential fit with at least two b values, a technique prone to image degradation due to bowel peristalsis[9,31]. The SR in the subjects with a normal terminal ileum still achieved high intra and interobserver agreements (ICC:0.944-0.974) and was less variable than ADC between sessions and readers. The main reasons could be that SR is calculated from a single b value DWI, limiting the propensity for motion degradation, and acquisition of a single b value DWI image using SS-EPI is rapid, sub-second using the latest acquisition techniques and hardware[8,20]. Hence, SR could be more robust for quantitative DWI assessment in normal or inflamed ileal segments of CD patients. And the measurement of SR avoids the post-processing maps compared to ADC, which would be easier and more applicable in clinic.
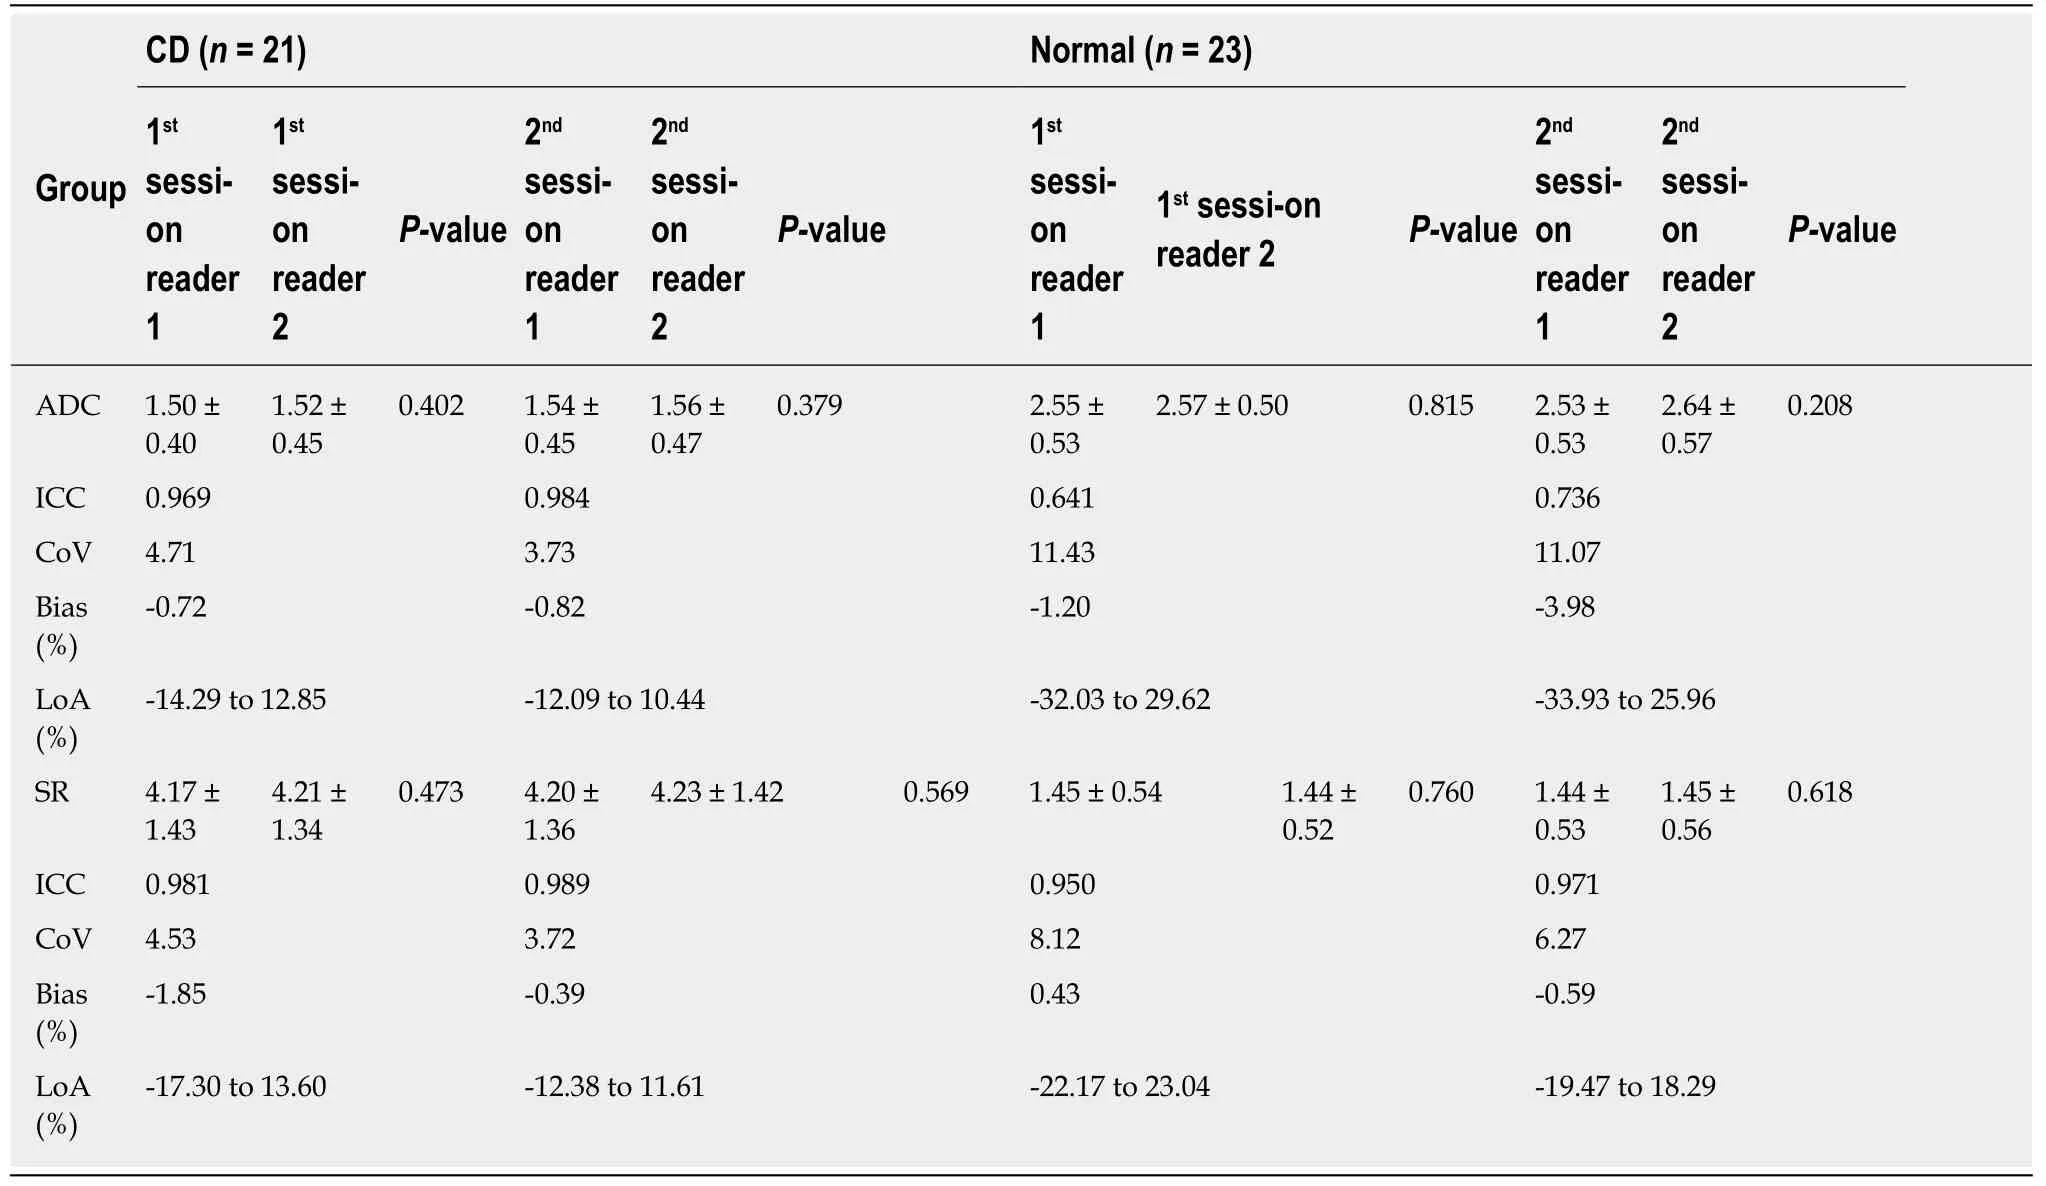
Table 3 lnterobserver agreement and variability of apparent diffusion coefficient and signal ratio measurements between the two readers over two sessions
In line with prior quantitative analysis of DWI on CD patients[9,23,29], the ADC values of inflammatory lesions were significant lower than those of normal segments in this study, and achieved optimal AUROC (R1: 0.923 and R2: 0.929) with high sensitivities and specificities by a threshold value of 1.8 × 10⁻³mm2/s. Furthermore, diagnostic efficiency of SR (AUROC: 0.981 for R1 and 0.988 for R2) was slightly superior to the ADC values. According to our results and Table 4, SR values greater than 2 (meaning more than twice signal intensity of the terminal ileum to ipsilateral psoas muscle)could be used to differentiate inflamed terminal ileum from the normal. Quantitative parameters of ADC and SR from DWI both had excellent diagnostic accuracy for CD.Similarly, the relative signal intensity (rSI) of lesion to muscle demonstrated higher diagnostic performance than ADC in assessing complete tumor response on post neoadjuvant chemoradiotherapy DWI in rectal cancer[24]. The SR, as an alternative modality of ADC, would be a reliable and effective quantitative parameter of DWMRE to identify the normal and inflamed bowel segments based on this initial study.The further exploration of SR in the differentiation of CD stages and medical therapy assessment during CD course is worthwhile in the future study.
However, our study had some limitations due to the retrospective nature and relatively small sample size included. Further prospective trials with larger sample sizes would help to confirm these results. Since DW-MRE examinations of this primary study were acquired from a single center using a same 3.0-T MR scanner, a multicenter study with various MR systems could further increase the applicability of the data. Additionally, ROIs placement on the bowel wall was relatively challenging and subjective for the observers; improvements in automated approaches to ROI placement would be potentially of great value. Finally, the quantitative endoscopic score was not acquired due to this retrospective study.

Figure 3 Bland-Altman plots of intraobserver agreement between 2 two sessions of two readers. Bland-Altman 95% limits of agreement with diffusion weighted imaging parameters including apparent diffusion coefficient and signal ratio from the Crohn's disease group and normal group. The solid line represents the mean relative difference as a percentage and the dashed lines represent the upper and lower 95% limits of agreement. ADC: Apparent diffusion coefficient; SR: Signal ratio;CD: Crohn's disease; SD: Standard deviation; R1S1: First session of reader 1; R1S2: Second session of reader 1; R1S2: First session of reader 2; R2S2: Second session of reader 2.
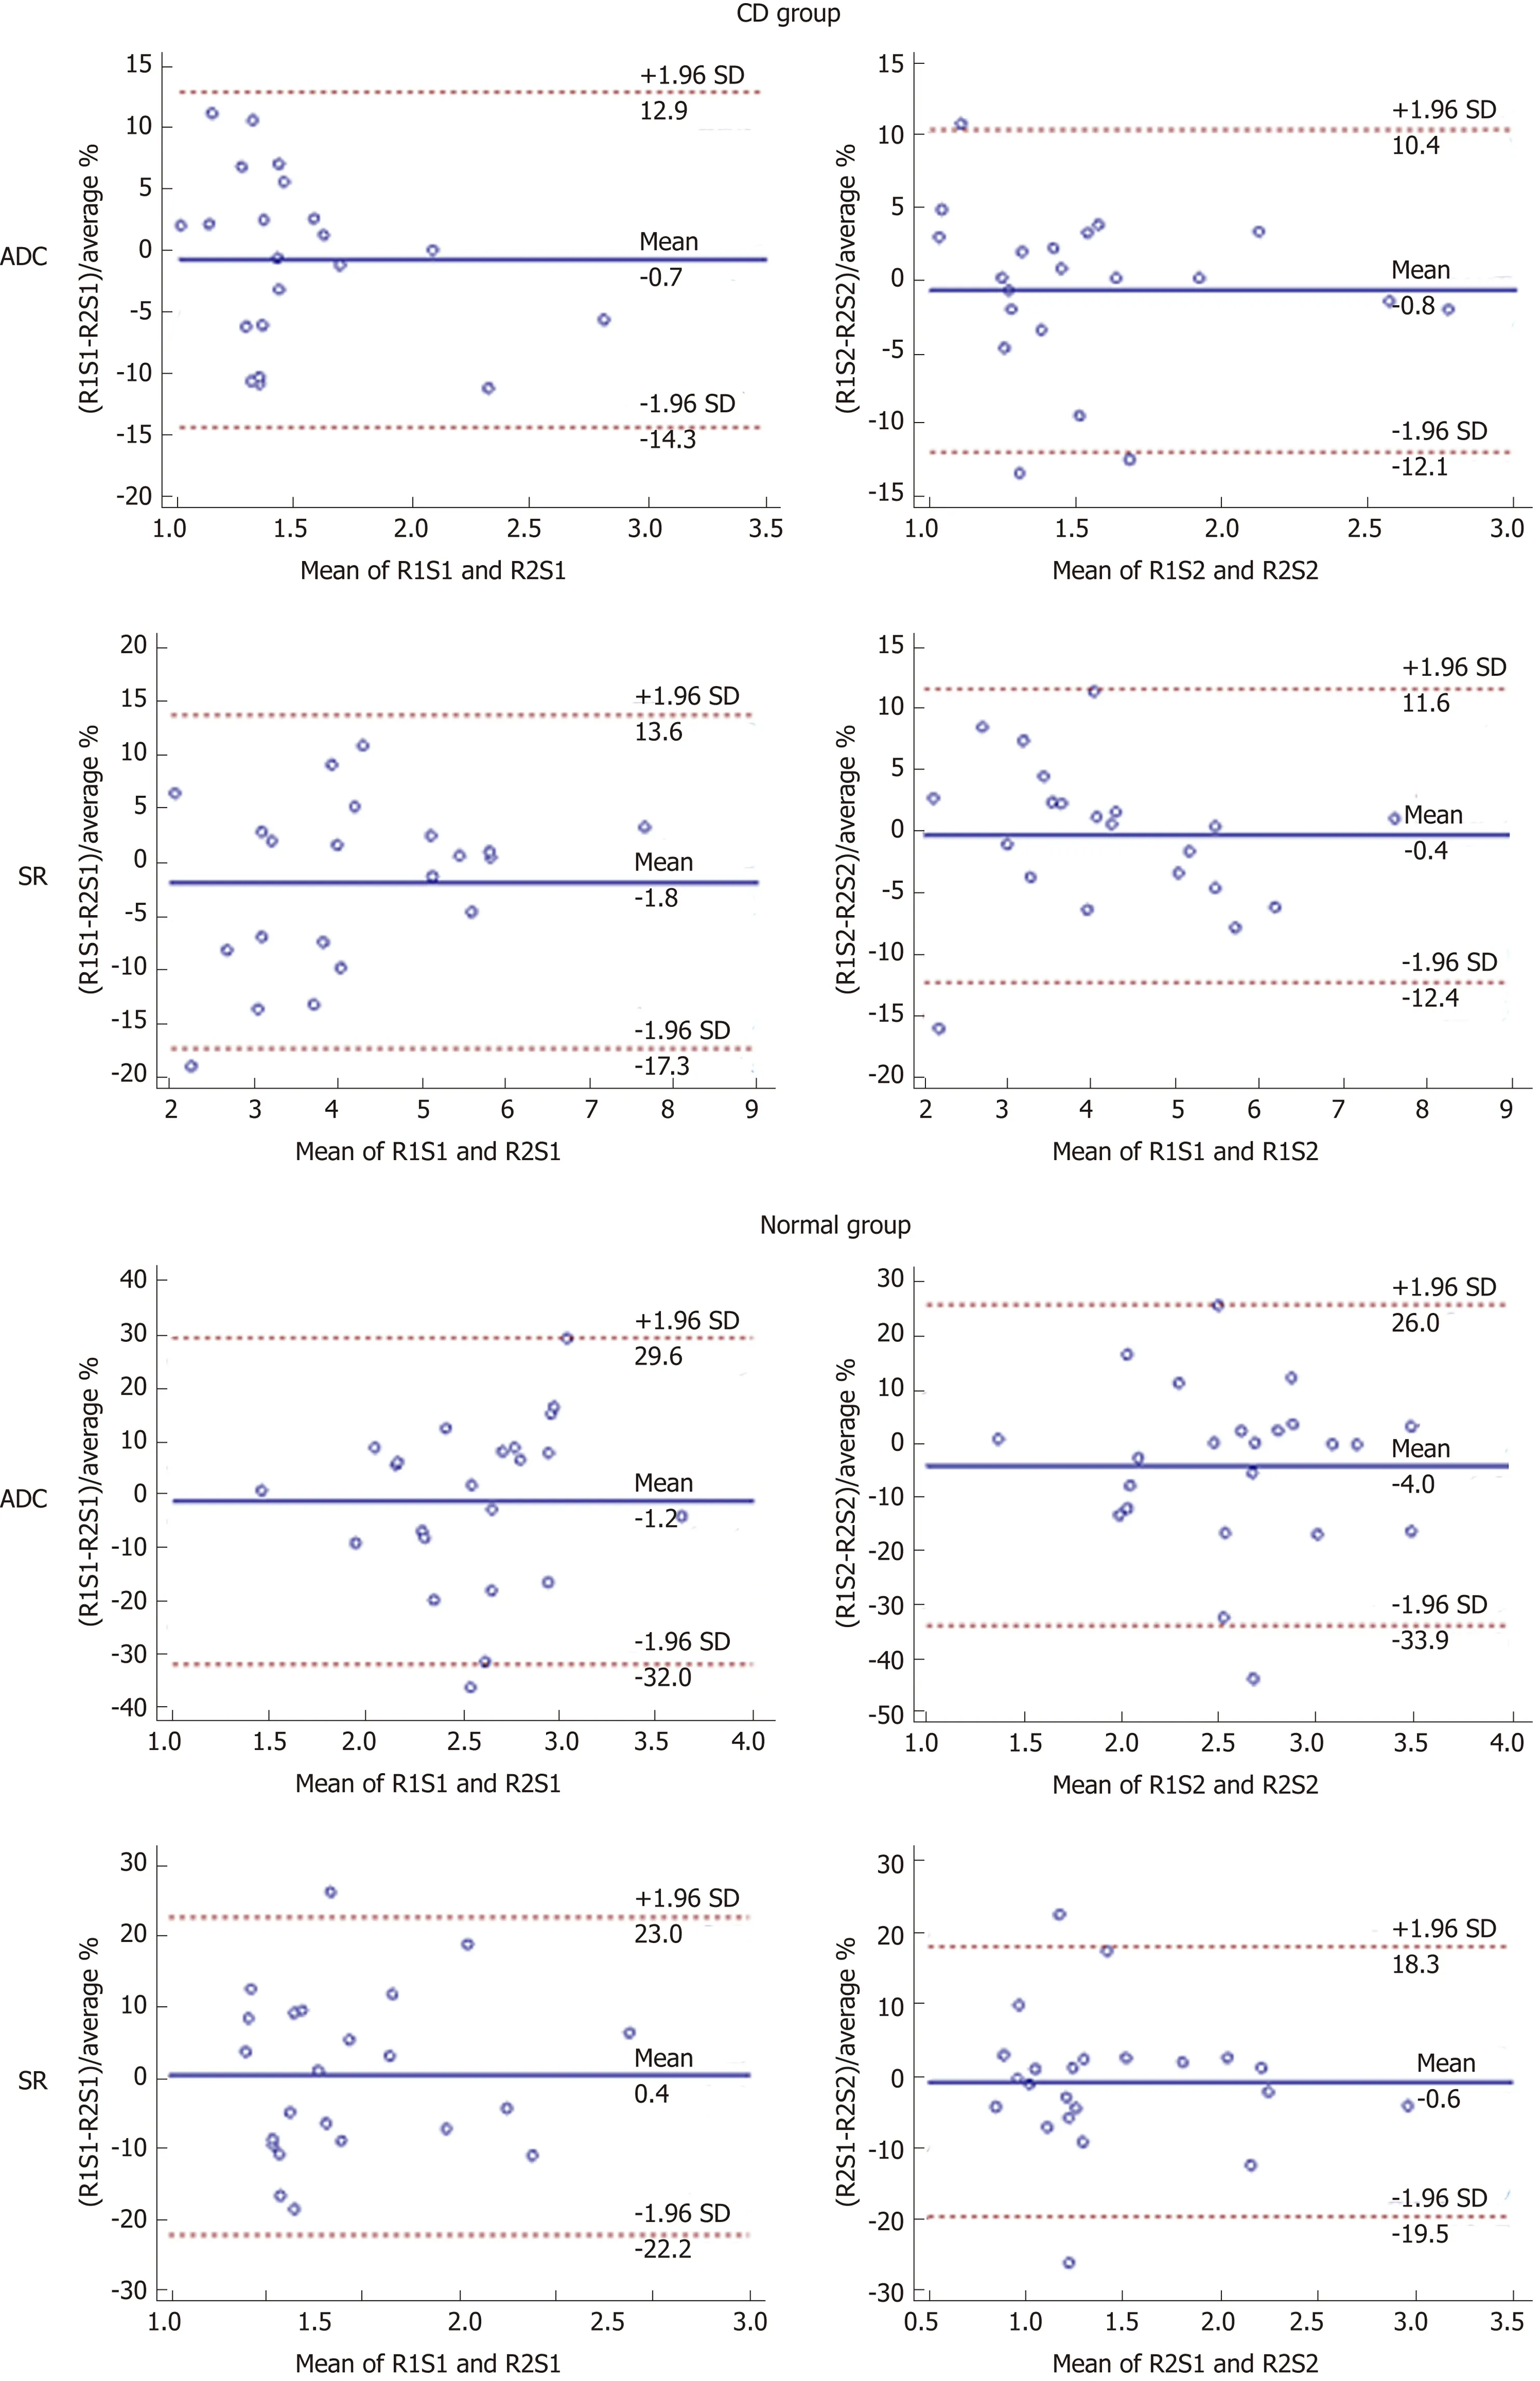
Figure 4 Bland-Altman plots of interobserver agreement between two readers at two sessions. Bland-Altman 95% limits of agreement with Crohn's disease parameters including apparent diffusion coefficient and signal ratio from the Crohn's disease group and normal group. The solid line represents the mean relative difference as a percentage and the dashed lines represent the upper and lower 95% limits of agreement. ADC: Apparent diffusion coefficient; SR: Signal ratio; CD:Crohn's disease; SD: Standard deviation; R1S1: First session of reader 1; R1S2: Second session of reader 1; R1S2: First session of reader 2; R2S2: Second session of reader 2.
In conclusion, the intra and interobserver agreements of quantitative ADC and SR analysis on DW-MRE images were found to be good or excellent in this initial study.Both the ADC and SR demonstrated high diagnostic yield for distinguishing inflamed terminal ileum in CD patients from the normal. Therefore, ADC value or SR could serve as robust and efficient biomarkers to aid in the noninvasive evaluation of CD.

Figure 5 Scatterplots between apparent diffusion coefficient and signal ratio of reader 1 and reader 2. Reader 1: r = -0.438, P = 0.047; Reader 2: r = -0.485, P= 0.026; R1: reader 1; R2: reader 2. ADC: Apparent diffusion coefficient; SR: Signal ratio; R1: Reader 1; R2: Reader 2.
ACKNOWLEDGEMENTS
The authors thank Jian Han from our gastrointestinal medical center for analysis of endoscopy examinations, whose important contributions to this study are indispensable to its success.

Table 4 Diagnostic performance of apparent diffusion coefficient and signal ratio for differentiating inflammatory lesions from normal terminal ileum
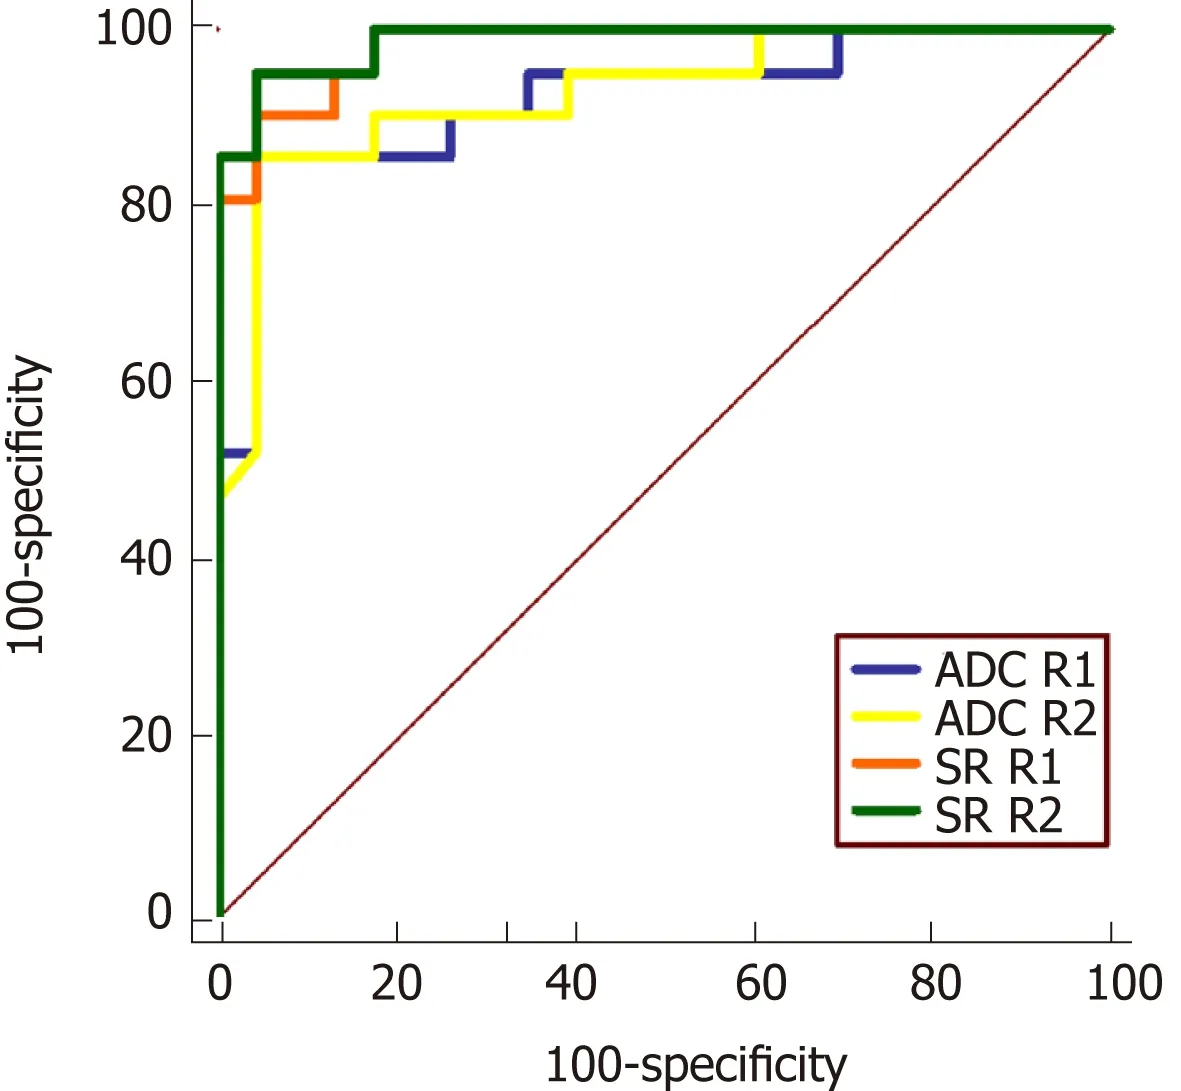
Figure 6 Receiver operating characteristic curve for quantitative apparent diffusion coefficient and signal ratio of the two readers. ADC: Apparent diffusion coefficient; SR: Signal ratio; R1: Reader 1; R2: Reader 2.
ARTICLE HIGHLIGHTS
Research background
The diagnosis and monitoring of Crohn's disease (CD) are important for the clinical therapy during its longstanding course. As avoiding the use of intravenous contrast agents, diffusion weighted (DW) imaging (DWI) is increasingly considered as a promising magnetic resonance(MR) enterography (MRE) technique to the qualitative and quantitative evaluation of CD in recent years, and is recommended as an optional MR sequence for CD. The quantitative DWI analysis may be more objective for CD assessment. However, the measurement reproducibility of quantitative DWI analysis in MRE has not been ascertained so far. Thus, the investigation of intra and interobserver agreements of quantitative DWI parameters could be valuable to facilitate the application of quantitative DW-MRE into the clinical routine.
Research motivation
DWI has shown a superb potential as a quantitative modality for CD evaluation. The characterization of reader agreement and variability with quantitative DWI parameters is imperative before such parameters are to be incorporated into clinical practice. Therefore, it is necessary to investigate the level of measurement reproducibility of quantitative DWI parameters.
Research objectives
This study aimed to explore intra and interobserver reproducibility of quantitative analysis for DW-MRE in CD, and then to assess the diagnosis efficiency of quantitative parameters for the evaluation of CD.
Research methods
Forty-four subjects (21 diagnosed with CD and 23 normal control subjects) who underwent ileocolonoscopy and DW-MRE (b = 800 s/mm2) within one week were included. Two
radiologists, blinded to clinical details as well as endoscopy results, measured the signal intensity (SI) of the terminal ileum and ipsilateral psoas muscle on DWI with b = 800 s/mm2.Separately and simultaneously, apparent diffusion coefficients (ADC) of the terminal ileum were recorded. Then, SI of ipsilateral psoas muscle on DWI with b = 800 s/mm2was also measured by placing a larger oval ROI. Signal intensity ratio (SR) of the terminal ileum to ipsilateral psoas muscle was calculated according to the equation: SR = SIileum/SImuscle. After a washout period of 4 weeks, the same two radiologists repeated the above described measurements to assess intraobserver agreement. Between- and within-reader agreements were assessed using intraclass correlation coefficients (ICC), coefficients of variation (CoV), and 95% limits of agreement of Bland-Altman plots (BA-LA LoA). Diagnostic performances of ADC and SR for identifying inflamed terminal ileum from the normal were evaluated by receiver operating characteristic(ROC) curve analysis.
Research results
There were no significant differences in quantitative DWI parameters (ADC and SR) between the two sessions or between the two radiologists either in the CD or control group (paired t-test, P >0.05). The intra and interobserver reproducibility of ADC (ICC: 0.952-0.984; CoV: 3.73%-6.28%;BA-LA LoA: ±11.27% to ±15.88%) and SR (ICC: 0.969-0.989; CoV: 3.51%-4.64%; BA-LA LoA:±10.62% to ±15.45%) was excellent for CD. Agreement of ADC measurements was slightly less in control subjects (ICC: 0.641-0.736; CoV: 10.47%-11.43%; BA-LA LoA: ± 26.59% to ±30.83%). SR of the normal terminal ileum demonstrated high intra and interobserver reproducibility (ICC:0.944-0.974; CoV: 3.73%-6.28%; BA-LA LoA: ± 18.58% to ± 24.43%). The areas under the ROC curve for SR (reader 1: 0.981; reader 2: 0.988) were slightly better than those of ADC (reader 1:0.923; reader 2: 0.929), but these differences were not statistically significant (P-values: 0.117 for reader 1; 0.067 for reader 2). The cutoff values maximizing sensitivity and specificity for ADC and SR parameters were approximately 1.80 × 10⁻³mm2/s and 2.00, respectively. In addition, SR was moderately and negatively correlated with ADC values in CD patients for both readers(reader 1: r = - 0.438, P = 0.047; reader 2: r = - 0.485, P = 0.026).
Research conclusions
From this study, the intra and interobserver agreements of quantitative ADC and SR analysis from DW-MRE images were found to be good or excellent. Both the ADC and SR demonstrated high diagnostic yield for distinguishing inflamed terminal ileum in CD patients from the normal.Additionly, SR demonstrated moderately negative correlations with ADC in CD patients, and could also represent the diffusion condition of the terminal ileum. Therefore, ADC value or SR could serve as robust and efficient biomarkers to aid in the noninvasive evaluation of CD.
Research perspectives
Quantitative ADC and SR values derived from DW-MRE achieved good to excellent intra and interobserver agreements with high diagnostic accuracy based on this initial study. The further exploration of these quantitative parameters in the differentiation of CD stages and medical therapy assessment during CD course is worthwhile in the future study.
 World Journal of Gastroenterology2019年27期
- World Journal of Gastroenterology的其它文章
- Stricter national standards are required for credentialing of endoscopic-retrograde-cholangiopan-creatography in the United States
- Colorectal peritoneal metastases: Optimal management review
- Eosinophils in the gastrointestinal tract and their role in the pathogenesis of major colorectal disorders
- lmmune suppression in chronic hepatitis B infection associated liver disease: A review
- Device-assisted enteroscopy: A review of available techniques and upcoming new technologies
- ldentifying high-risk individuals for gastric cancer surveillance from western and eastern perspectives: Lessons to learn and possibility to develop an integrated approach for daily practice
