Phenomenological modelling of flow behaviour of 20MnMoNi55 reactor pressure vessel steel at cryogenic temperature with different strain rates
Swgtm Pul , Prth Dey , Snehsish Bhtthrjee , Snji Kumr Ahryy ,Prsnt Shoo ,*, Jynt Chttopdhyy
a Department of Mechanical Engineering, Jadavpur University, Kolkata, India
b Department of Mechanical Engineering, Academy of Technology, Hooghly, West Bengal, India
c Bhaba Atomic Research Centre, Mumbai, India
Keywords:Flow behaviour RPV steel Cryogenic temperature Strain rate
A B S T R A C T In the present study a phenomenological constitutive model is developed to describe the flow behaviour of 20MnMoNi55 low carbon reactor pressure vessel(RPV) steel at sub-zero temperature under different strain rates. A set of uniaxial tensile tests is done with the variation of strain rates and temperature ranging from 10-4 s-1 to 10-1 s-1 and-80°C to-140°C respectively.From the experimental data,family of flow curves at different temperatures and strain rates are generated and fitted exponentially. The strain rate and temperature dependence of the coefficients of the exponential flow curves are extracted from these curves and characterised through a general phenomenological constitutive coupled equation.The coefficients of this coupled equation are optimised using genetic algorithm. Finite element simulation of tensile tests at different strain rates and temperatures are done using this coupled equation in material model of Abaqus FEA software and validated with experimental results. The novelties of proposed model are: (a) it can predict precisely the flow behaviour of tensile tests (b) it is a simple form of equation where fitting parameters are both function of strain rate ratio and temperature ratio, (c) it has ability to characterize flow behaviour with decreasing subzero temperatures and increasing strain rates.
1. Introduction
In nuclear power plant high neutron irradiation causes embrittlement of plant components. The service life of the components becomes shorter. Similar type of embrittlement phenomenon can be observed in sub-zero temperature in the reactor pressure vessel(RPV)steel.Steel loses its ductility with decrease in temperature and becomes completely brittle below a certain temperature [1]. Fracture toughness of steel is probabilistic and scattered in ductile to brittle transition zone and depends on the flow behaviour in this zone. The response of components of nuclear power plant facing PTS(pressure thermal shock)also influenced by strain rate dependence of the material [2,3]. Thus material characterization of RPV steel at low temperatures and different strain rates is very important from the maintenance and design point of view of nuclear power plant. Stress analysis of a critical structure under low temperature and variable strain rates needs a material law to relate strain rate and temperature with flow curve parameters. Available Visco-plastic models are mainly categorized into two types, one is phenomenological and another is physically based constitutive model [4]. Depending upon the area of application these models have its own advantages and disadvantages.The accuracy of prediction, computational time, required number of experimental data, and complicacy of equation constants become the key factor to choose the appropriate model. Basically physically based model is based on micromechanical properties like dislocation motions, thermal activation of molecules, stress field influence on defects,alloy elements etc[5].It can predict more accurate deformation behaviour than phenomenological constitutive model, but finding the material constants for physically based model is difficult[6].Liang and Khan[7]have shown a review about some strain rate sensitive constitutive models. Bodner-Partom [8]model is well-known for capturing the effect of strain rate.Original Bodner-Partom is incapable to capture the effect of temperature.Later many modifications were done on Bodner-Partom model.Khan-Huang [9] developed a model on the same assumption of Bodner-Partom model. Paul [10] has discussed briefly in his paper about some phenomenological models. Amongst them Johnson-Cook (JC) [11], Zerilli-Amstrong (ZA) [12], Lin-Wagoner [13],Rusinek-Klepaczko[14]suggest a constitutive model which address strain rate and temperature sensitivity both. JC model is a simple model of an uncoupled form of equation where flow stress is both function of strain rate and temperature. The main drawback of JC model is that it is not sufficient to capture the flow behaviour at very high strain rates[15,16]and ZA model is not suitable for flow stress prediction after 0.6 Tm[17]. Besides, all these models are applicable for the elevated temperature and not suitable at temperature of cryogenic level with elevated strain rates.
?
In this work it is attempted to develop a constitutive model which predicts flow stress at low temperature and high strain rates suitable for the material 20MnMoNi55. Generally for the bcc material it is known that materials are positively strain rate sensitive.But 20MnMoNi55 RPV steel has shown negative strain rate sensitivity.In this proposed model this negative strain rate sensitivity of this material is also addressed. Two types of approaches are available in literature to develop a constitutive model based on flow stress response with temperature and strain rate[15].Some group of researchers has taken flow stress as a function of temperature;strain rate and plastic strain [18] whereas other group of researchers has taken the rate of strain hardening as a function of temperature,strain rate and plastic strain[19-21].In this work the first approach is taken into consideration. The experimental flow curve is fitted with suitable function for each temperature and strain rate.Then the constants of the fitting curve are plotted with the variation of temperatures and strain rates. A constitutive equation of flow stress is proposed where temperature and strain rate are in a coupled from. To obtain the optimum value of the coefficients of the constitutive equation genetic programming(GP)is used.GP is an evolutionary computational method which is quite popular and frequently used in material domain[22].The evolution technique which is used in GP is hierarchically organized mathematical expressions whose size and form are changed dynamically during the process of simulation. Finally a free form equation is developed and FE simulation of tensile test at each temperature and strain rate is done using the developed constitutive equation as an input for material.Simulated true stress-strain curves are validated with the experimental true stress-strain curves.The material used in the present study is 20MnMoNi55 low carbon reactor pressure vessels steel. 20MnMoNi55 is a German designated material and mainly used in reactor pressure vessel components.A test block of this material is received from Bhaba Atomic Research Centre,India.The chemical composition of the material is given in Table 1.
2. Experimental study
All the tensile tests are done according to ASTM E8 standard procedure in Instron 8801 servo hydraulic machine.Liquid nitrogen is used to achieve cryogenic temperatures. Tests are done in four different temperatures (-80°C, -100°C, -120°C, -140°C) and four different strain rates(5.55×10⁻⁴s-1,1.1×10-2s-1,2.7×10-2s-1, 8.3×10⁻²s-1). All the dimensions of the test specimen are shown in Fig. 1. Dynamic extensometer is used to get the strain value at uniform cross-section part of the specimen. Gauge length of the extensometer is 25 mm and travel is ±5 mm. The tests are done in displacement control mode and different displacement rates/velocities are given as an input. Later strain rates are calculated from corresponding velocities and gauge length of the specimen. 20 min of average thermal soaking time is given for each specimen to gain temperature uniformly throughout the body.Dynamic extensometer is used at 20°C temperature for each strain rate and at further lower temperatures strain is calculated from total extension after correcting the contribution of additional finite compliance of the machine and the part of the specimen beyond gauge length. The total extension is available from LVDT reading and tensile extension can be calculated from extensometer. The difference in these two extensions is due to additional compliance which can be computed at different strain rates and can be correlated to force. Based on these correlations obtained in 20°C correction for additional extension can be done in other temperatures where employment of extensometer is not possible.
The co-relation of the difference between total extension and tensile extension with load consists of two separate sections (see Fig.2),one is linear section and another is nonlinear section.Linear section is up to yield point and nonlinear section where the material gets plastically deformed. At the linear portion, the slope of linear fitting curve is a constant. And for the nonlinear portion a second-order polynomial curve is fitted.This polynomial fit is valid up to ultimate stress point. Using these fitting curves both linear and nonlinear, undesired extensions are calculated and subtracted from total extension. Thus, both linear and nonlinear fitting parameters are used for correction of strain calculation.Detailed test matrix is shown in Table 2.
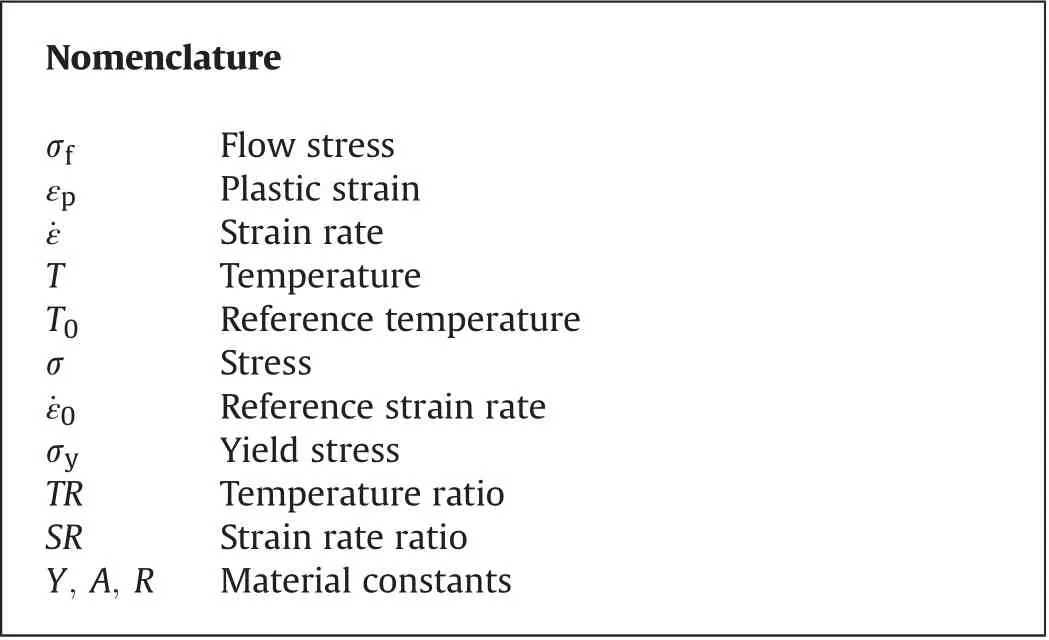
From the tensile testing for each temperature and strain rate,Young's modulus, yield strengths, and ultimate tensile strengths are calculated. Young's modulus is calculated from tensile stress-strain plot at the elastic/linear region. At the elastic zone of the curve the initial slope is considered as Young's modulus at the respective temperature and strain rate condition. This slope is taken in between 10-4to 10-3strain range. Yield point is chosen where 0.2 percent offset line at strain axis cut the tensile stressstrain plot. At the yield point the value of stress is taken as a yield strength of the material. Ultimate strength is taken as the maximum tensile stress in tensile stress-strain plot for each temperature and strain rate testing. From the experimental result it is found that values of Young's modulus, yield and ultimate strength are changing with both strain rate and temperature along with small scatter as expected. Young's modulus is determined by the binding force of atoms, when temperature increases the momentum of the atoms increases. Due to increased momentum the cohesive force between atoms get reduced,hence Young's modulus decreases with increasing temperature.Young's modulus does not vary significantly with strain rate. However it is observed that at 0.011 s-1strain rate and-120°C temperature,the value of Young's modulus is decreased and at -140°C again it is increased. The variation of Young's modulus with respect to strain rate and temperature are shown in Figs. 3 and 4 respectively. Figs. 5 and 6 exhibit the variation of yield strength with strain rate and temperature respectively. The variation of ultimate tensile strength(UTS) with respect to strain rate and temperature are shown in Figs. 7 and 8 respectively. Here in Fig. 7 it can be clearly observed that variation of UTS with strain rate is not uniform for all temperatures. Micromechanically, strength of the material can be described by the storage rate of dislocations in the plastic regime.At the time of plastic deformation, diffusion of interstitial atoms restricts the free glide of dislocation. Hence strain hardening occurs. Increasing temperature increases the momentum of the diffused atom and diffused atoms get driven away from the glide plane. Thus mobility of dislocation increases with increasing temperature which results lower strength. Strain rate has also significant influence on the strength of material. At the time of plastic deformation some new dislocations are generated.Increasing strain rate increases the rate of generation of new dislocations which increases the dislocation density. Therefore with increasing strain rate strength of the material increased. To study the nature of the flow curve, variation of flow stress with decreasing temperature and increasing strain rate at 2%,5%and 10%plastic strain are plotted in Fig.9.Here at-140°C,-120°C,-80°C the value of flow stresses are decreasing with the increasing strain rate.Generally flow stress increases with the increasing strain rate following a power law expression, where the exponent is called strain rate sensitivity [23]. The value of the exponent is generally positive.But here in this case the sensitivity is showing negative,as stress decreases with increasing strain rate. And the flow stress is decreasing with the increasing temperature as expected. A variation of tensile properties with temperature and strain rate is presented in Table 3.
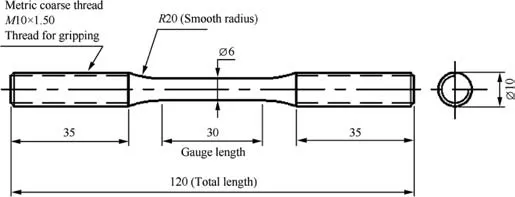
Fig.1. Round tensile specimen geometry.
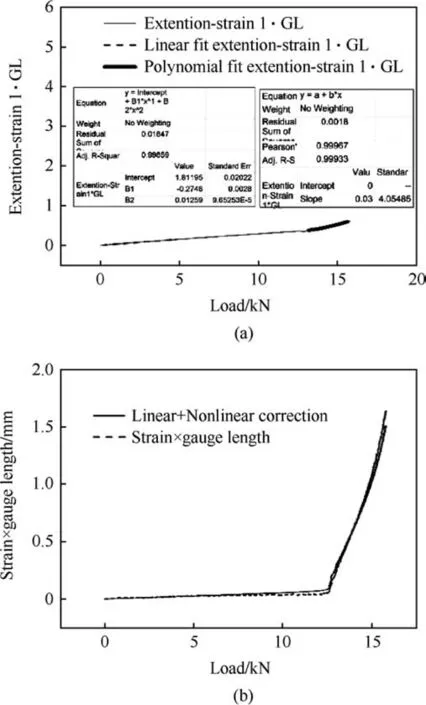
Fig. 2. (a) Undesired extension versus load curve, (b) correlation curve of specimen extension with load.
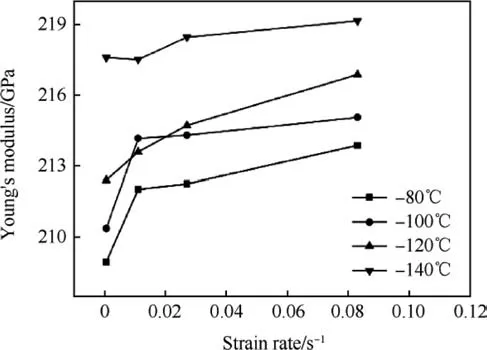
Fig. 3. Young's modulus at different strain rate.

Table 2A summary of test matrix.
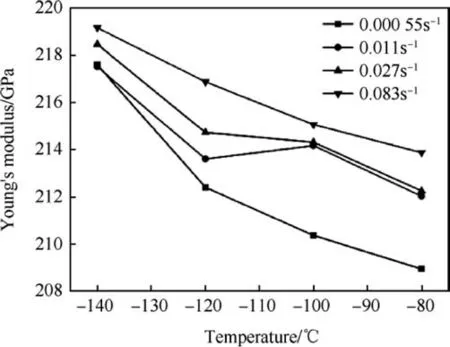
Fig. 4. Young's modulus at different temperature.
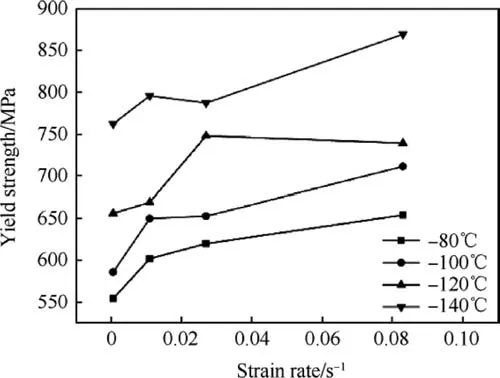
Fig. 5. Yield strength at different strain rate.
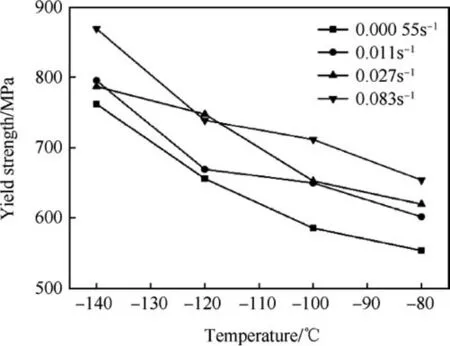
Fig. 6. Yield strength at different temperature.
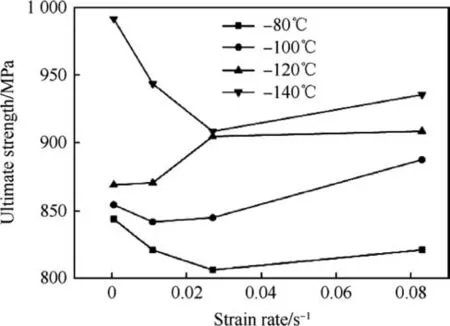
Fig. 7. Ultimate strength at different strain rate.
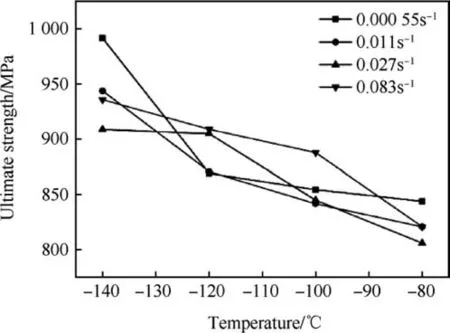
Fig. 8. Ultimate strength at different temperature.
3. Material model to capture temperature and strain rate effect on tensile properties
For developing a constitutive phenomenological Viscoplastic model, generally there are two types of approach are available in the literature. One approach where flow stress (σf) is taken as a function of plastic strain(εp),strain rate(˙ε)and temperature(T)and another is rate of strain hardeningis taken as a function of plastic strain (εp), strain rate (˙ε) and temperature (T). In this work the constitutive plasticity model is developed on the basis of σf(εp) = f(εp,˙ε,T). Lin and Wagnor (LW) [13] presented a constitutive model to capture the effect of temperature and strain rate for interstitial-free steel. The equation can be written as A, B, C, D, m and β are material constants. The material constants are determined by curve fitting on stress-strain curve.Similarly here in this work true stress and plastic strain are fitted with exponential curve as

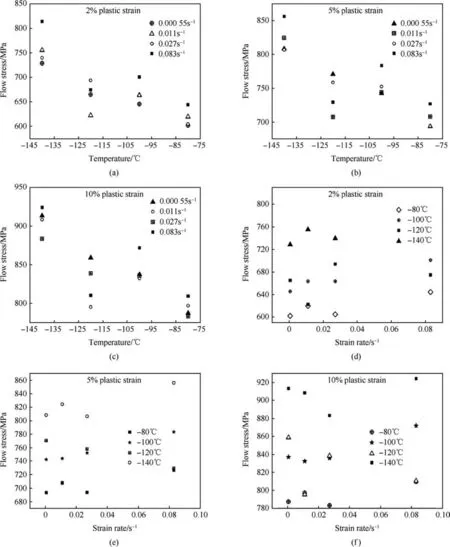
Fig. 9. (a, b, c) Flow stress versus temperature curve at different strain rate for 2%, 5%, 10% plastic strain respectively. (d, e, f) Flow stress versus strain rate curve at different temperature for 2%, 5%,10% plastic strain respectively.
Where,

Where Y, A, R are the material parameters which depends on temperature and strain rate.Fig.10 is the representation of fitting of true stress and plastic strain curve at particular temperature and strain rate. When the value of plastic strain is equal to zero, the value of yield stress(σy) can be written as
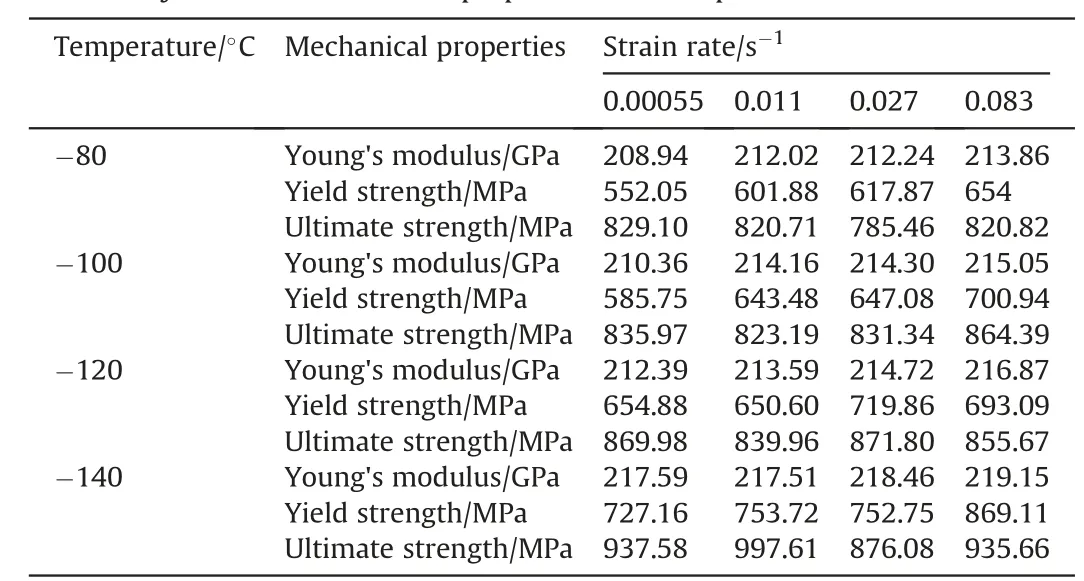
Table 3A summary of variation of tensile properties with temperature and strain rate.
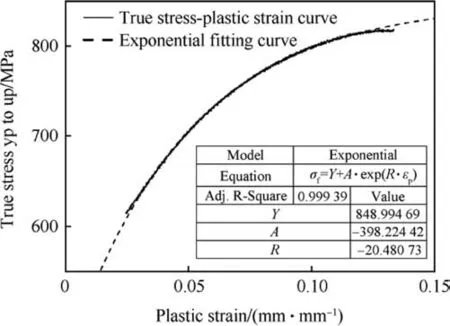
Fig.10. Fitting curve with true stress versus plastic strain curve.

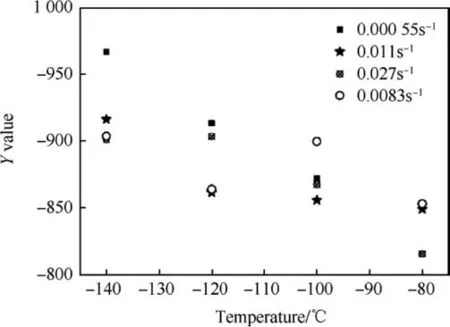
Fig.11. Variation of Y-value with temperature at different strain rates.
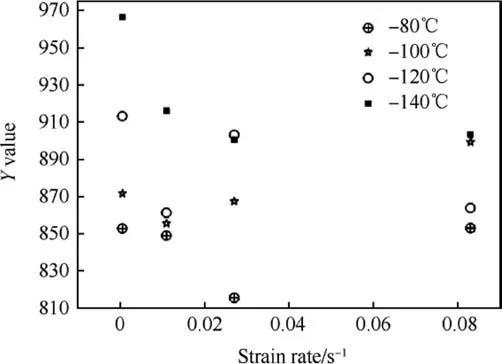
Fig.12. Variation of Y-value with strain rate at different temperatures.
Values of Y, A, R at each combination of strain rate and temperature can be extracted from the fitted curve at each corresponding strain rate and temperature. Yield stress are related to Y and A,and hardening is related to A and R.Thus the variation of Y,A,R are plotted with the temperature and strain rate. The values obtained for Y,A,R at different temperature and strain rates are shown in Table 4 and Figs.11-16 show the variation of Y,A,R with respect to temperature and strain rate separately.
The variation of Y with temperature and strain rate exhibit a specific trend of decreasing with increase either in temperature at all the strain rates (Fig. 11) or in strain rate at all temperatures(Fig.12).But the scatter observed in case of Y vs.strain rate is more.Similarly in Figs.13-16,variation of A and R with temperature and strain rate are plotted.From which trends and scatter are apparent.From experimental results it is observed that each of Y,A and R is a function of both temperature and strain rate. In this work it isattempted to identify the optimum functional form to relate each of Y, A and R with both temperature and strain rate and also the optimum values of the coefficients of the equations using Symbolic Genetic Algorithm.

Table 4Values of fitting parameters at different temperature and strain rate.
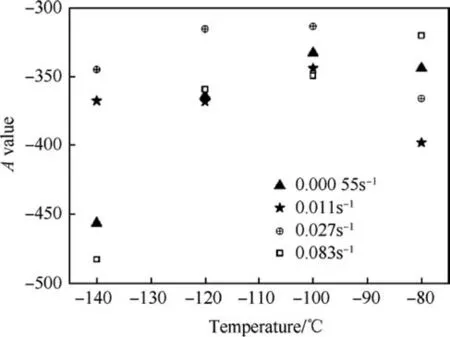
Fig.13. Variation of A-value with temperature at different strain rates.
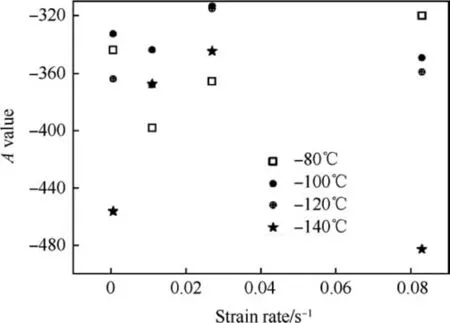
Fig.14. Variation of A-value with strain rate at different temperatures.
Test Temperature and strain rate are respectively divided by a reference temperature(20°C)and a reference strain rate(0.00055 s-1) to obtain non-dimensional strain rate ratio (SR) and temperature ratio (TR). Now each of Y, A and R can be expressed as a function of strain rates ratio (SR) and temperature ratio (TR). In absence any specific trend,the form of the equation requires to be optimised through random searching along with the optimisation of coefficients. Simultaneous searching for form and co-efficient has been implemented by symbolic regression with Genetic Programming. Symbolic Regression is the non-linear, free-form counterpart of Linear Regression. Here each of Y, A and R are assumed to depend on two variables strain rate ratio (SR) and temperature ratio(TR).To test the dependence,a series of physical experiments have been performed,where for different values of SR and TR, values of Y, A and R are obtained. If the correlation and coefficients in the correlations are known then the predicted values of Y,A and R will be known and can be compared with experimental values at that SR and TR to evaluate error at that point. Thus error can be computed at 16 different points (4×4) of SR and TR. Total error can be computed by sum of square of errors at each point.Now the objective of the search algorithm is to optimise both form of the equation and the values of the coefficients to minimise the total error.
These constitutive equations are free form equation evolving through GP. Generally GP works with iterative evolution of generations by creating child mathematical expression from parent mathematical expressions.Parent expressions are constructed from the set of functions F={+,-,*,/}and the set of terminals t={1,TR,SR}.Initial parent expressions are chosen randomly, then crossover of two parents expressions form a child expression. That trial child expression is checked by the fitness to the experimental results by symbolic regression analysis by minimizing the sum of square of errors. Each successive iteration (or generation) chooses mathematical expression from the previous generation based on their fitness, and combines/alters their ‘genetic’ material (i.e. fragments of those expressions) to get better and better expressions each time. With each form genetic search is repeated to optimise coefficients corresponding to a chosen form. Finally the optimum form and coefficients for each of Y, A, R obtained from GP are as

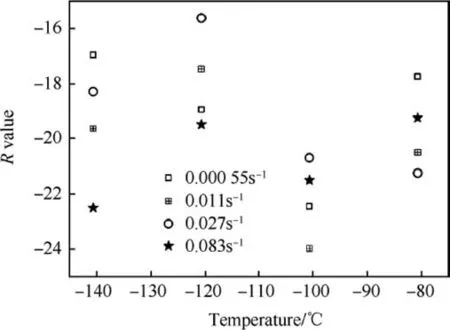
Fig.15. Variation of R-value with temperature at different strain rates.
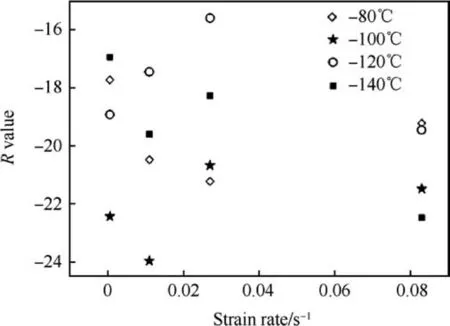
Fig.16. Variation of R-value with strain rate at different temperatures.

The Y,A,R values obtained from GP are plotted with temperature and strain rate and compared with experimental results in Fig.17.
4. Finite element analysis
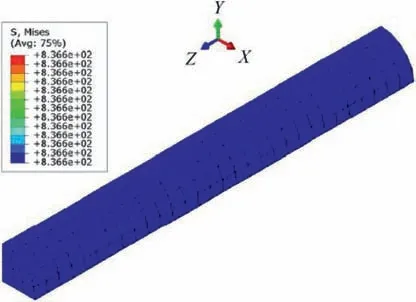
Fig.18. Von-Mises stress and meshing at FEA simulation for quarter model tensile test.
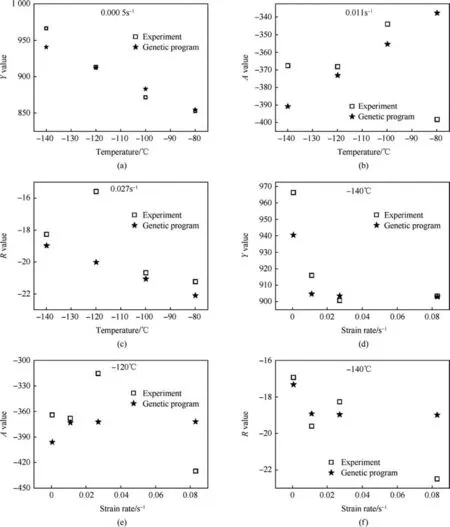
Fig.17. (a, b, c) comparison of Y, A, R values obtained from GP with experimental values at different temperatures, (d, e, f) comparison of Y, A, R values obtained from GP with experimental values at different strain rates.

Fig.19. (a-d, e-h, i-l, m-p) Comparison of simulation and experimental true stress-true strain curves for -80°C, -100°C, -120°C, -140°C at different strain rates respectively.
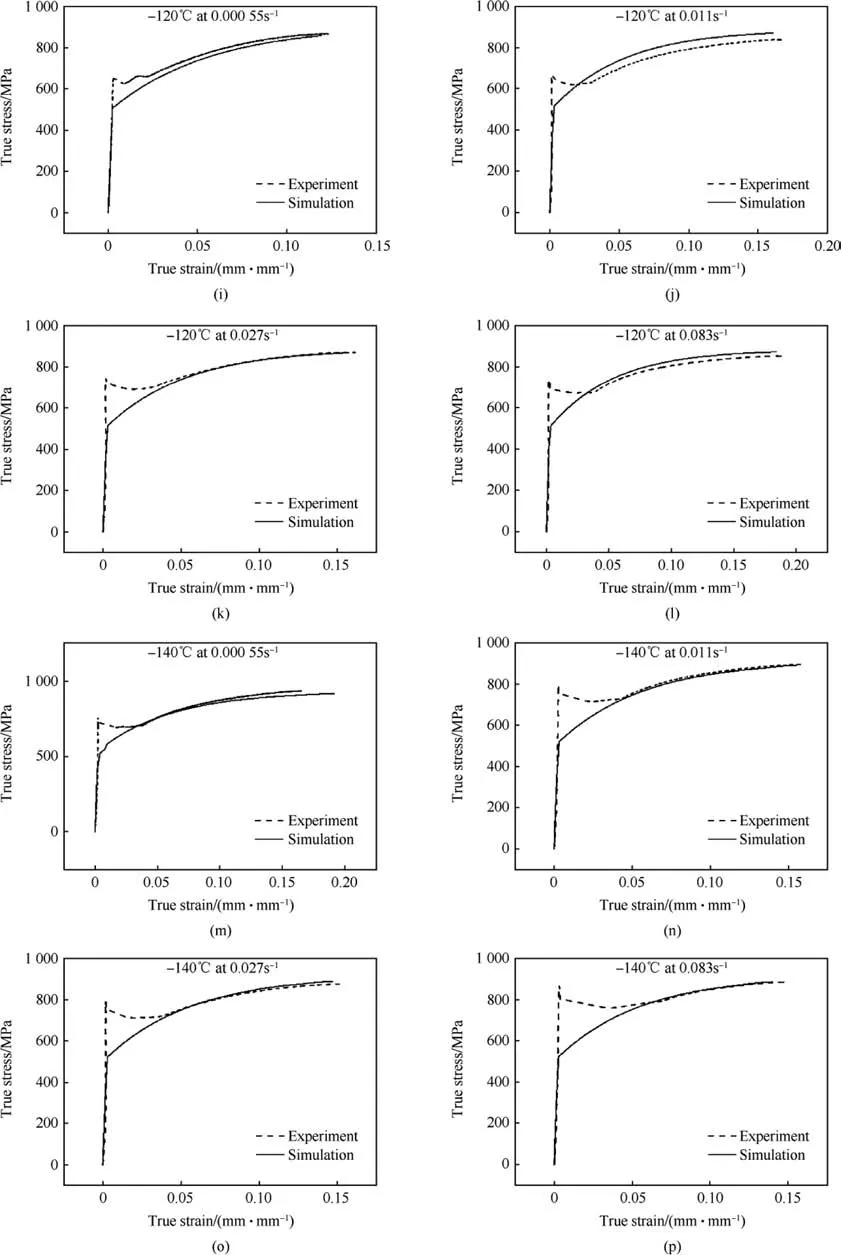
Fig.19. (continued).
The correlation of Y,A and R with temperature and strain rate is established to simulate any tensile test at any temperature and strain rate directly by employing this material model along with the optimum material properties obtained for this material.In order to validate the proposed constitutive model and material properties with the experimental result, finite element simulations of tensile tests at different temperature and strain rates are performed using Abaqus 6.8 FE package. The meshing of quarter axisymmetric model is shown in Fig. 18 Continuum 3D 8 node brick element(C3D8R) is used for meshing. The basic assumptions which are considered for this FE analysis are tensorial form of Hook's law for isotropic elastic behaviour and von-Mises plasticity with isotropic hardening for plastic behaviour.An implicit stress update algorithm is written as a subroutine where stress update is performed. One trial stress is predicted with convergence of elastic predictor and plastic corrector. Initially an increment of total strain is given elastically to predict a trial stress states and then a plastic corrector which is a projection to the predicted trial stress is used to converge the trial stress onto the revised yield surface.This prediction is done iteratively by Newton-Raphson method. The main purpose of this simulation is to compare the simulated stress-strain curves with experimental stress-strain curves.
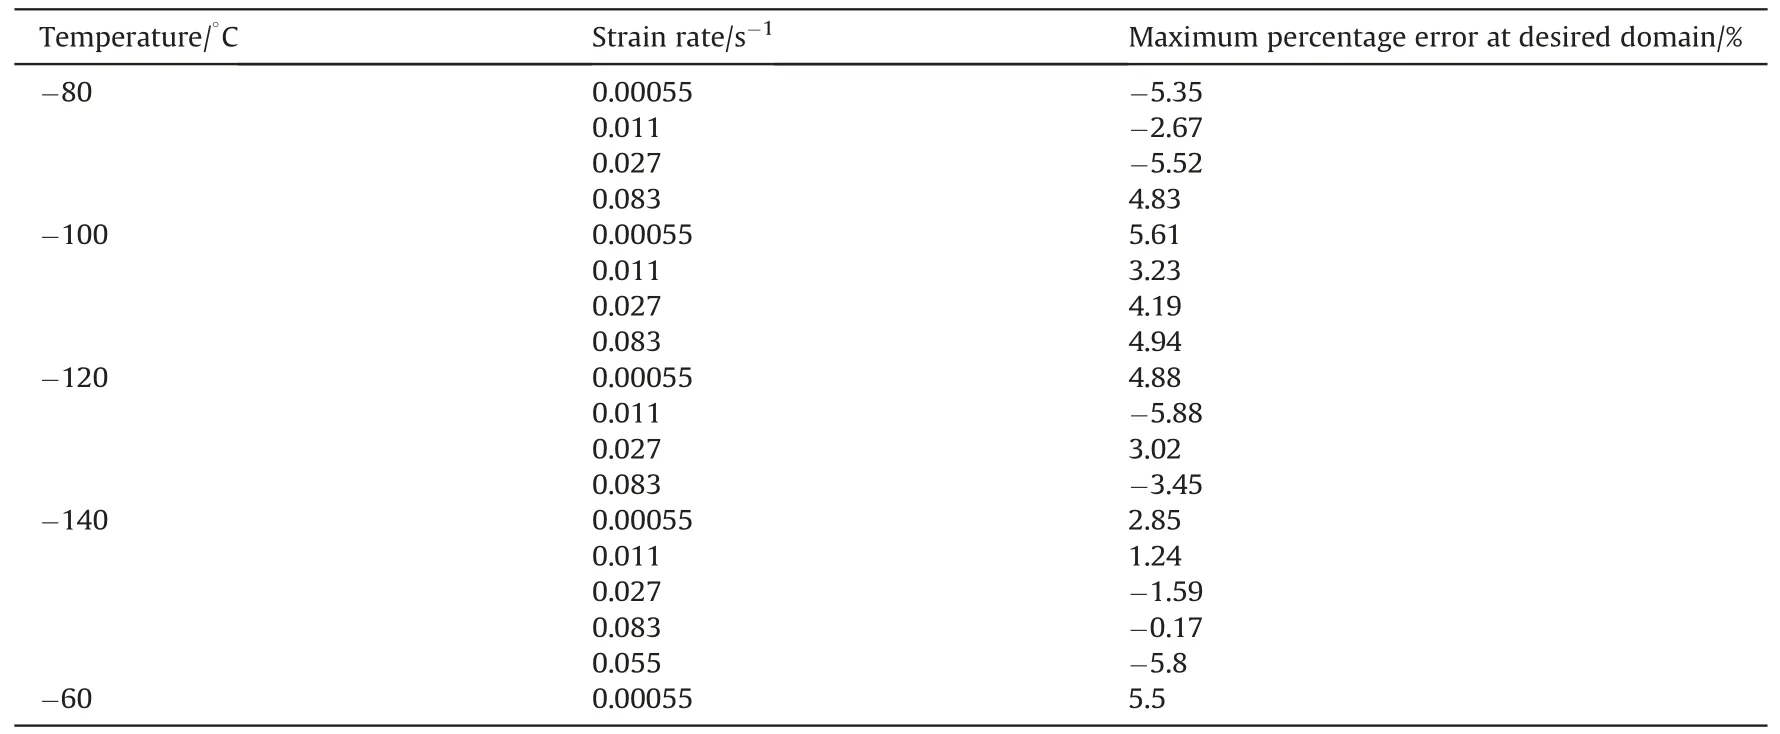
Table 5Maximum percentage error of simulation and experimental stress-strain curves at desired domain of flow curve at different temperature and strain rate.
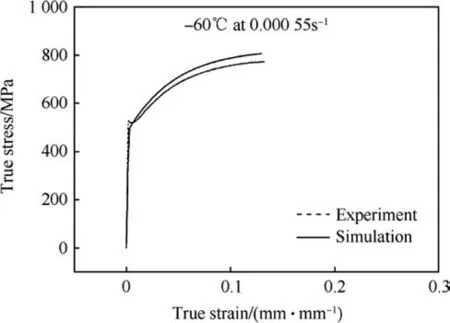
Fig. 20. Comparison of simulated and experimental true stress-true strain curve at -60°C and 0.00055 s-1 strain rate.
From Fig.19 it is shown that simulated stress-strain curves are well matched with experimental stress-strain curves. The maximum deviation of simulated stress value from experimental stress is found at the yielding zone, but in the flow curve at the strain hardening zone the maximum errors are near about ±5% or less.Maximum errors between simulated and experimental stressstrain at all temperature and strain rates are given in Table 5. The values of Y,A and R were extracted without considering the effect of Luder band which is expected in Low Carbon steel. Therefore the prediction of the model(FE simulated results)is not matching with the experimental results at Luder band portion. At lower temperatures the Luder band length becomes longer. But in this work only flow behaviour of the curves are investigated and modelled phenomenologically. Two additional simulations which are out of the test matrix are done in -60°C and at 0.055 s-1and compared with experimental curves to validate the model (as shown in Figs. 20 and 21). It is observed that the stress-strain curves for both cases are matching with good agreement with experimental stress-strain curves.
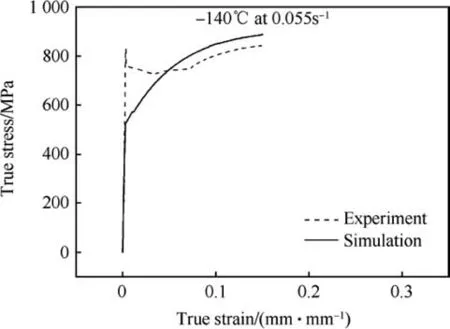
Fig. 21. Comparison of simulated and experimental true stress-true strain curve at -140°C and 0.055 s-1 strain rate.
5. Conclusion
The effect of strain rate and temperature on tensile properties are investigated in different temperatures(-80°C, -100°C, -120°C, -140°C) and strain rates (0.00055 s-1,0.011 s-1, 0.027 s-1, 0.083 s-1). Tensile properties obtained at this temperature range and strain rate range show variation with scatter instead of any monotonic trend. Direct curve fitting is not applicable to correlate the variation of the flow stress with temperature and strain rate.Symbolic Genetic Algorithm is explored to identify the appropriate relation. The material parameters of the constitutive model are then obtained by using symbolic genetic programming using experimental tensile results at various strain rates and low temperatures.To test whether the obtained material parameters are independent of temperature and strain rate finite element simulation of tensile test at other temperature (-60°C)and strain rate(0.055 s-1)is done and validated with experimental results. A good agreement is observed between the finite element stress strain curve and experimental stress strain curve. The relation along with the material parameters is found to be applicable in general for lower temperatures and higher strain rate.
Acknowledgement
The authors would like to acknowledge the support of BARC and UGC-BSR scheme.
- Defence Technology的其它文章
- Body armour - New materials, new systems Ian G. Crouch*
- Special materials in pyrotechnics VII: Pyrotechnics used in thermal batteries☆
- Real-time calculation of fragment velocity for cylindrical warheads
- Heavy metal free primers: Polymorphism of gadolinium and titanium in the context of GSR glass phase Felice Nunziata
- Mitigation of EDFA transient effects in variable duty cycle pulsed signals
- Ballistic impact properties of woven bamboo- woven E-glassunsaturated polyester hybrid composites

