Wood density and carbon concentration of coarse woody debrisin native forests,Brazil
Andréa B.Moreira,Timothy G.Gregoire and Hilton Thadeu Z.do Couto
Abstract Background:With theobjectiveof increasing knowledge on biomassand carbon stocks,and thusimproving the accuracyof published estimates,thepresent studyexplored wood density and carbon concentration of coarsewoody debris(diameter≥10)bydecayclassin a Seasonal Semi-deciduous Forest(SSF)areain the Atlantic Rain Forest and in a Cerrado sensu-stricto(CSS)area(Brazilian savanna),in Brazil.Two stratawereidentified in each areaand ten sampling unitsweresystematic located in each stratum.Datawerecollected according to the lineintersect sampling method.Each tallied element,thediameter,length,and perpendicular width wererecorded at the transect intersection point.Each element wasclassified into adecay class,and thespecieswasidentified when possible.Samplediscswerecut from each element,from which cylindricalsampleswere extracted and oven-dried to determinedensity.These cylindersweremilled and analyzed using a LECO-C632 to determine carbon concentration aspercentageof mass.Results:In both areas,wood density decreased asthedecayclassincreased.For SSFthe mean carbon concentration of allanalyzed sampleswas49.8%with astandard deviation of 3.3,with arangeof 27.9-57.0%across506 observations.For CSSthe generalmean was49.6%with astandard deviation of 2.6,with arangeof 31.2-54.5%over 182observations.Carbon concentration barely changebetween decay classes.Carbon stockwasestimated at 3.3and 0.7MgC/hafor the SSFand the CSS,respectively.Similar resultswereobtained when using a50%conversion constant.Conclusions:Thepresent study concludesthat wood density decreasesasthewoody debrisbecomesmore decomposed,apattern found in manypreviousstudies.Thecarbon concentration,however,barelychangesbetween decay classes,and that result isconsistent with most of theliteraturereviewed.Our carbon concentrationsarevery closeto the50%used most commonly asaconversion factor.Westrongly recommend that futurestudiesof CWD evaluatewood density and carbon concentration bydecayclassto addresstheuncertaintystillfound in theliterature.
Keywords:Carbon concentration,Wood density,Coarse woody debris,Seasonalsemi-deciduousforest,Brazilian savanna
Background
Forests play a main role in the carbon cycle,contributing to a substantial portion of the world's carbon stocks.Collectively,the world's forests store more than 650 billion tons of carbon:44%in biomass,11%in dead wood and litter,and 45%in the soil(FAO 2010).Dead woody debris thus constitutes an important component of the carbon sequestration and carbon stocks occurring in forests,and its quantification in forest inventories becomes even more relevant due to forests'interactions with the greenhouse effect and climate change(Smith et al.2004).Assuch,theassessment of dead woody debris comprisesan essential component of efficient forest management.Moreover,quantifying carbon stocks improves our understanding of climate change and the role of forest carbon dynamics in various future scenarios,and a moreaccuratequantification of dead woody material only increases the accuracy of overarching carbon estimates(Woodall and Williams2005).
Despite this importance,carbon stock data for dead wood and litter remain vague(FAO 2010).The woody debris studies that do exist focus on volume and biomass inventories,eschewing calculations for actual carbon concentrations(Russell et al.2015).Instead,carbon stocks are indirectly estimated through volume estimators and biomass-carbon conversion constants(Woodall and Monleon 2008).Because vegetation sequestersatmospheric carbon in biomass,which iscommonly expressed as a dry weight per unit area,changes in net primary productivity values over time often indicate changes in forest structure(Brown 1997).Biomass values are usually converted to carbon values by multiplying by the constant 0.50(i.e.,computed as 50%of the biomass value).The IPCC(2006)recommends the use of a 47%biomasscarbon conversion factor for tropical rainforests when thereisadearth of dataspecific to thisforest type.
Estimates of the carbon in dead woody debris could be improved by better understanding how carbon concentration variesin woody detritus,and necromassestimates can become more precise when estimating wood density by decay class,species,position with respect to the soil surface,and tissue type(Harmon et al.2013).Carbon stocks can only be estimated precisely and in large-scale if there are detailed forest-type specifications for carbon concentration values(IPCC 2006).
Coarse woody debris(CWD),one of many forms of dead woody debris,is generally defined as fallen dead wood,in various stages of decomposition,located above the soil.Studies of carbon concentration in the CWD of tropical forests by Chao et al.(2017)note four previous publications pertinent to this type of research(Clark et al.2002;Iwashita et al.2013;Meriem et al.2016;Wilcke et al.2005).No studies were found for the Cerrado ecosystem of Brazil,however.With the objective of increasing knowledge on biomass and carbon stocks,and thus improving the accuracy of published estimates,the present study explored wood density and carbon concentration of coarsewoody debrisby decay classin a Seasonal Semi-deciduous Forest area in the Atlantic Rain Forest and in a Cerrado sensu-stricto(Brazilian savannah)area.
Methods
Study sites
This study was conducted at two different areas located in separate ecoregions of the São Paulo State,Brazil.The first area was within the Brazilian Atlantic Forest in a Seasonal Semi-deciduous Forest(SSF),also known as tropical seasonal forest,located inside the borders of the Caetetus Ecological Station.The second area was within the Cerrado ecoregion in an area classified as Cerrado sensu-stricto(CSS)located on the Mogi Guaçu Biological Reserve.In each areatwo stratawerechosen for stratified systematic sampling.
The forest at the Caetetus Ecological Station constitutesoneof themost significant remainingareasof SSFin Brazil.The“semi-deciduous”denomination refers to the seasonal cold weather and the reduced water availability in thesoil,alongsideother environmental factors.Assuch,most of the arborescent specieslosetheir leavesin winter to reduce water consumption and decrease their rates of growth(Tabanez et al.2005).According to the Management Plan,the Conservation Unit coversthecitiesof Galia and Alvinlândia with a total area of 2178ha.Its elevation ranges from 520-680m above sea level,and it isrelatively flat(lessthan 6%).It islocated on thenorthern border area of thehydrographic basin of the Paranapanemariver.The climate according to the Köeppen(1948)classification is“Cwa”:mesothermal dry winter with temperatures below 18°C and above 22°C in summer;total precipitation in the driest month is only 30mm,and total annual precipitation isbetween 1100 and 1700mm(Tabanezet al.2005).In this area,stratum I(SSF1)and stratum II(SSF2)were selected.
The SSF1 stratum wascharacterized by arboreal vegetation of largestaturewith sparseherbaceousand graminoid vegetation.SSF1 contained predominantly deciduous species and has experienced anthropogenic disturbance;it occupies the interfluves and the tops of plateaus with a total area of 777.8ha(area“L"in the Management Plan map).The SSF2 stratum was an area containing dense arboreal vegetation of large stature with a smaller number of deciduous species.Overall,SSF2 was a wellpreserved forest occupying high escarpmentsand plateau edges across a total area of 439.4 ha(area“M"in the Management Plan map)(Tabanez et al.2005).
The Mogi-Guaçu Biological Reserve,thelocation of the cerrado field site,is part of the old Campininha Farm located in the Martin Prado Junior district of the city of Mogi Guaçu in the São Paulo State.With a total area of 470hectares,the landscape is relatively flat(less than a 15%slope).In the area of the Campininha Farm,the elevation rangesfrom 566 to 724 metersabovesealevel.The climate is mesothermal with two well defined seasons:a dry winter(from the months of April to September)and a hot summer(from October to March).The annual average rainfall is 1335mm,and the average temperature is 20.5°C(São Paulo 2015).The unit is divided into two main sections:one designated as area“A”and the other asarea“B”.
Area“A”,where this research was conducted,covers 343.4ha and is dominated by cerrado ecosystems at different regeneration stages,as the area has suffered perturbations like frequent fires and occupation with cattle farming(Mantovani and Martins 1993).With the largest area being a Cerrado sensu-stricto(savanna woodland)formation(spanning from pioneer to advanced successional stages);there are also small patches of herbaceous vegetation near the watercourse.Two strata were also selected in thisarea:CSS1 and CSS2.The CSS1 stratum is characterized as a forested savannah in an advanced successional stagewith an areaof 136.5ha;and the CSS2 stratum isaforested savannah in an intermediatesuccessional stage with an area of 197.5ha(São Paulo 2015).
Field measurementsand sample collection
In the field survey,dead woody debris was classified into size classesaccording to the Keller et al.(2004)classification:small(branches or bamboo with diameter between 2 and 5cm);medium(branches or bamboo with diameter between 5 and 10cm);and large(woody material with diameter greater than 10cm).In thisstudy,only the large elements were measured.Data were collected according to the line intersect sampling(LIS)method,in which an element of downed dead wood was tallied if it was completely intersected by a transect or if it intersected the front end of a transect,following the protocol detailed by Gregoireand Valentine(2008).A professional compass(Suunto KB-20)wasused to alignment thetransectsalong the cardinal directions.A 50 m tape measure was used to lay out thetransects,with correctionsfor slopewhen necessary.Additional details about the field protocolscan be found in Moreira(2017)and Moreira et al.(2019).
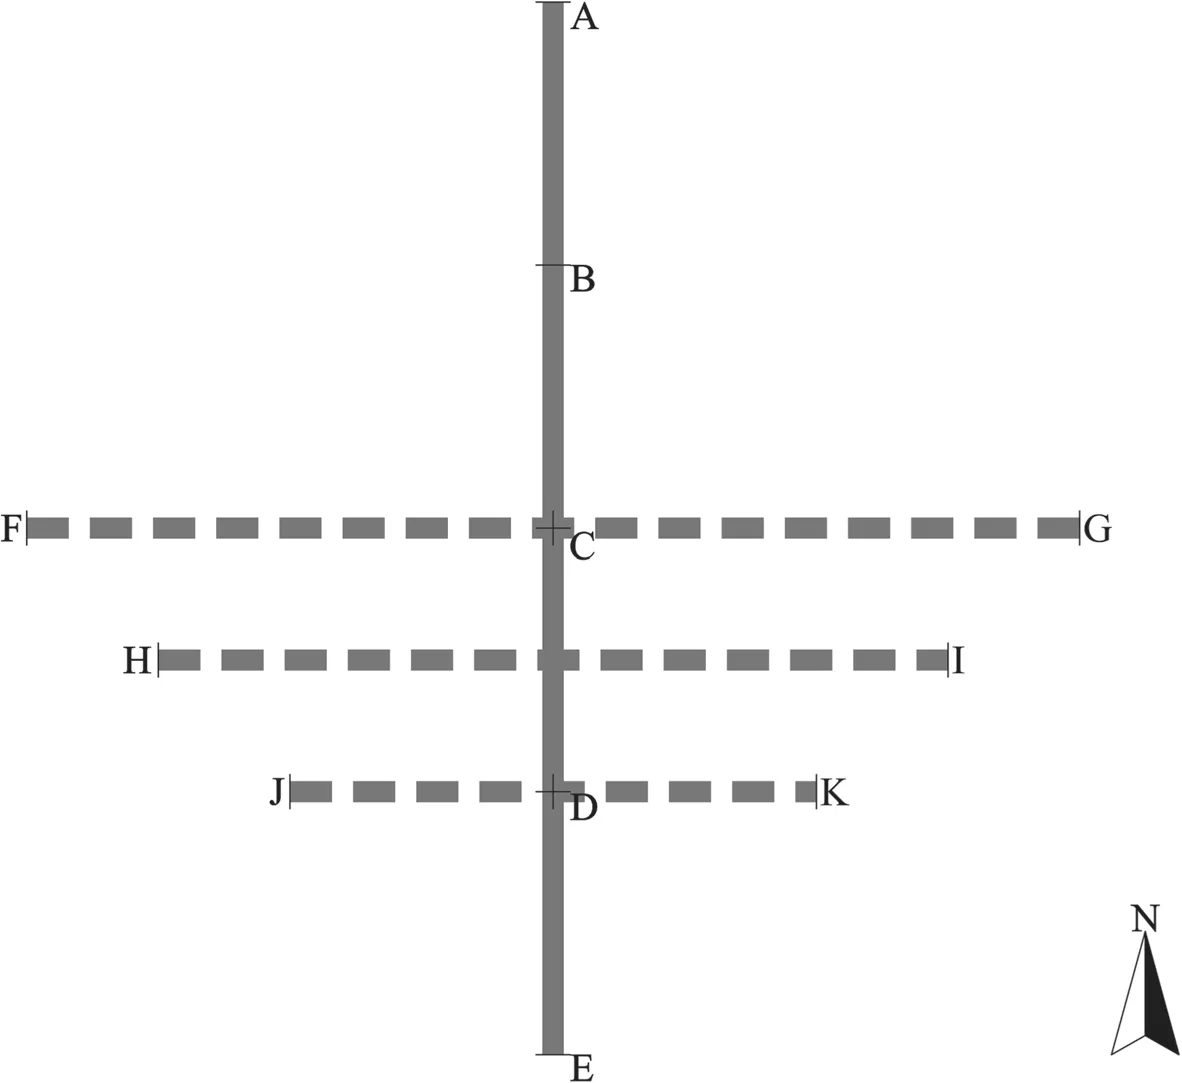
In each stratum of each area,ten sampling units(Fig.1)were installed according to a systematic sampling protocol,with 300m distance between the center points of each sampling unit(point C-Fig.1).Each sampling unit spans650m of transect segments:one200m transect segment in the North-South direction(segment AE-Fig.1);one 200m transect segment in the East-West direction,crossing the center point of the N-Stransect(segment FG-Fig.1);a 150m segment crossing the N-Ssegment in the East-West direction at 25m south of the center point(segment HI-Fig.1);and a 100m East-West segment crossing the N-Ssegment at 50m south of thecenter point(segment JK-Fig.1).
A caliper was used to measure each element's diameter,perpendicular to the central axis,at the point where the segment intersected the element.If bark remained attached to the element,the diameter was measured with it.The length of the element was recorded using a tape measure along the central axis of the element(regardless of its shape).Furthermore,each element's width perpendicular to the transect segment direction was measured according to Gregoireand Valentine(2008).Each element was classified into one of five decay classes according to Harmon et al.(1986).Decay class 1:woody material consisting of solid wood with leaves and/or fine twigs attached to theprincipal part without noticeabledegradation;decay class 2:solid wood material with intact bark but no leaves or fine twigs;decay class 3:solid wood material similar to class 2 except with rotting bark;decay class 4:partially rotten material that can be broken when kicked;and decay class 5:material that is rotten,friable,and can bebroken with barehands.
Though speciesidentification for debrismaterial isdifficult,thisdatawascollected for CWD elementswhenever possible-most frequently when thepresenceof bark and attached branches exhibited particular characteristics of certain species(e.g.,a specific odor).For each element,a disc sample was collected at the transect intersection point,perpendicular to the central axis.These samples were taken using either a chain saw or a manual saw(for elements that had a high degree of decomposition).Samples were packaged,tagged,and carefully transported to the laboratory.
Laboratory analysis
For density calculations from disc samples,the cylinder extraction method proposed by Keller et al.(2004)was used,with the only variation in this study being that the cylinders were removed in a laboratory setting.The extraction of the cylinders wasperformed using a benchmounted drill with a hole saw that produced samples of known diameter.For elements with a high level of decay,sample cylinders were removed manually using an aluminum cylinder.Thelength of thecylinderswasmeasured and confirmed with a digital caliper;although the hole saw(drill bit)had a known volume,the length of the sample cylinders it produced varied according to the width of thedisc brought from thefield.Thesamplecylinderswere oven-dried at 65°C to a constant weight.Dry cylinders wereremoved from theoven and weighed to four decimal placeson an analytical scaleto computefinal dry weight.The sample cylinders from each disc were milled in a knife mill(Wiley type),and sieved through a no.40 mesh,with equipment being vacuum-cleaned between samples to avoid contamination.Carbon concentration measurements were achieved with LECO-C632 carbon combustion and analysis equipment;i.e.,samples are placed in a ceramic chamber that reaches a temperature of approximately 1000°C for about one minute,undergoing combustion in thepresenceof oxygen.The LECO system uses infrared sensors to detect elemental carbon in the outflow of gas from the combustion system,and results are delivered aspercentagemassvalues.For each sample,two replicates were made to determine final carbon concentrations.All laboratory analyses were performed in the Department of Forest Sciences at the University of São Paulo(ESALQ/USP).
Data analysis
The data from the sampling units(650m of transect segments)were used to calculate wood density and carbon concentration.The wood density(ρk)of each kthelement was computed as the average of the sample cylinders'densities,calculated asthe dry weight(g)divided by fresh volume(cm3);average densities were computed for each decay class.For the volume calculation,discswith hollow sections were photographed,and the hollow areas were measured using ImageJ(Rasband 2016).Thus,thevolume for each element(vk)wascalculated as:thecross-sectional areaof the kthelement minusthehollowed cross-sectional area of the kthelement then multiplied by the length of the kthelement.

Fig.1 Sampling unit with atransect in the North-South direction(continuousline,200m),and threetransectsin the East-West direction(dashed lines)
The biomass(bk)value for each kthelement was determined as the product of the element's volume and its density:bk=Vk.ρk.The carbon stock in each kthelement was calculated as the product of its biomass and the carbon concentration average computed via the laboratory analysis by LECO-C632 equipment then averaged according to decay class.From the SSF area,n=506 elements were analyzed for density d carbon concentration;from the CSS area,n = 182 elements wereanalyzed.
From the sampling unit scheme,Moreira et al.(2019)tested different configurations and segments length,selectingthedesign based on theestimateswith thesmallest standard error,narrowest confidence interval,and lowest relative error.The cross-shaped with 150m segment length(segments BEand HI-Fig.1)wasselected for CSS type,and cross-shaped with 200 m segment length(segments AEand FG-Fig.1)for SSF.
The total estimation of biomass/carbon stock per hectareby samplingunits(wascalculated usingthe estimator,where L is the length of both segments that makes the cross shaped design,ykis the parameter of interest(biomass or carbon stock),and wkis the perpendicular width to the transect direction,(θs).The estimation for each unit was replicated,and all estimates were combined for the whole population.See details about the estimators in Moreira(2017),Moreira et al.(2019),as well as Gregoire and Valentine(2008).All data were processed and analyzed using R(RCore Team 2018).
Results
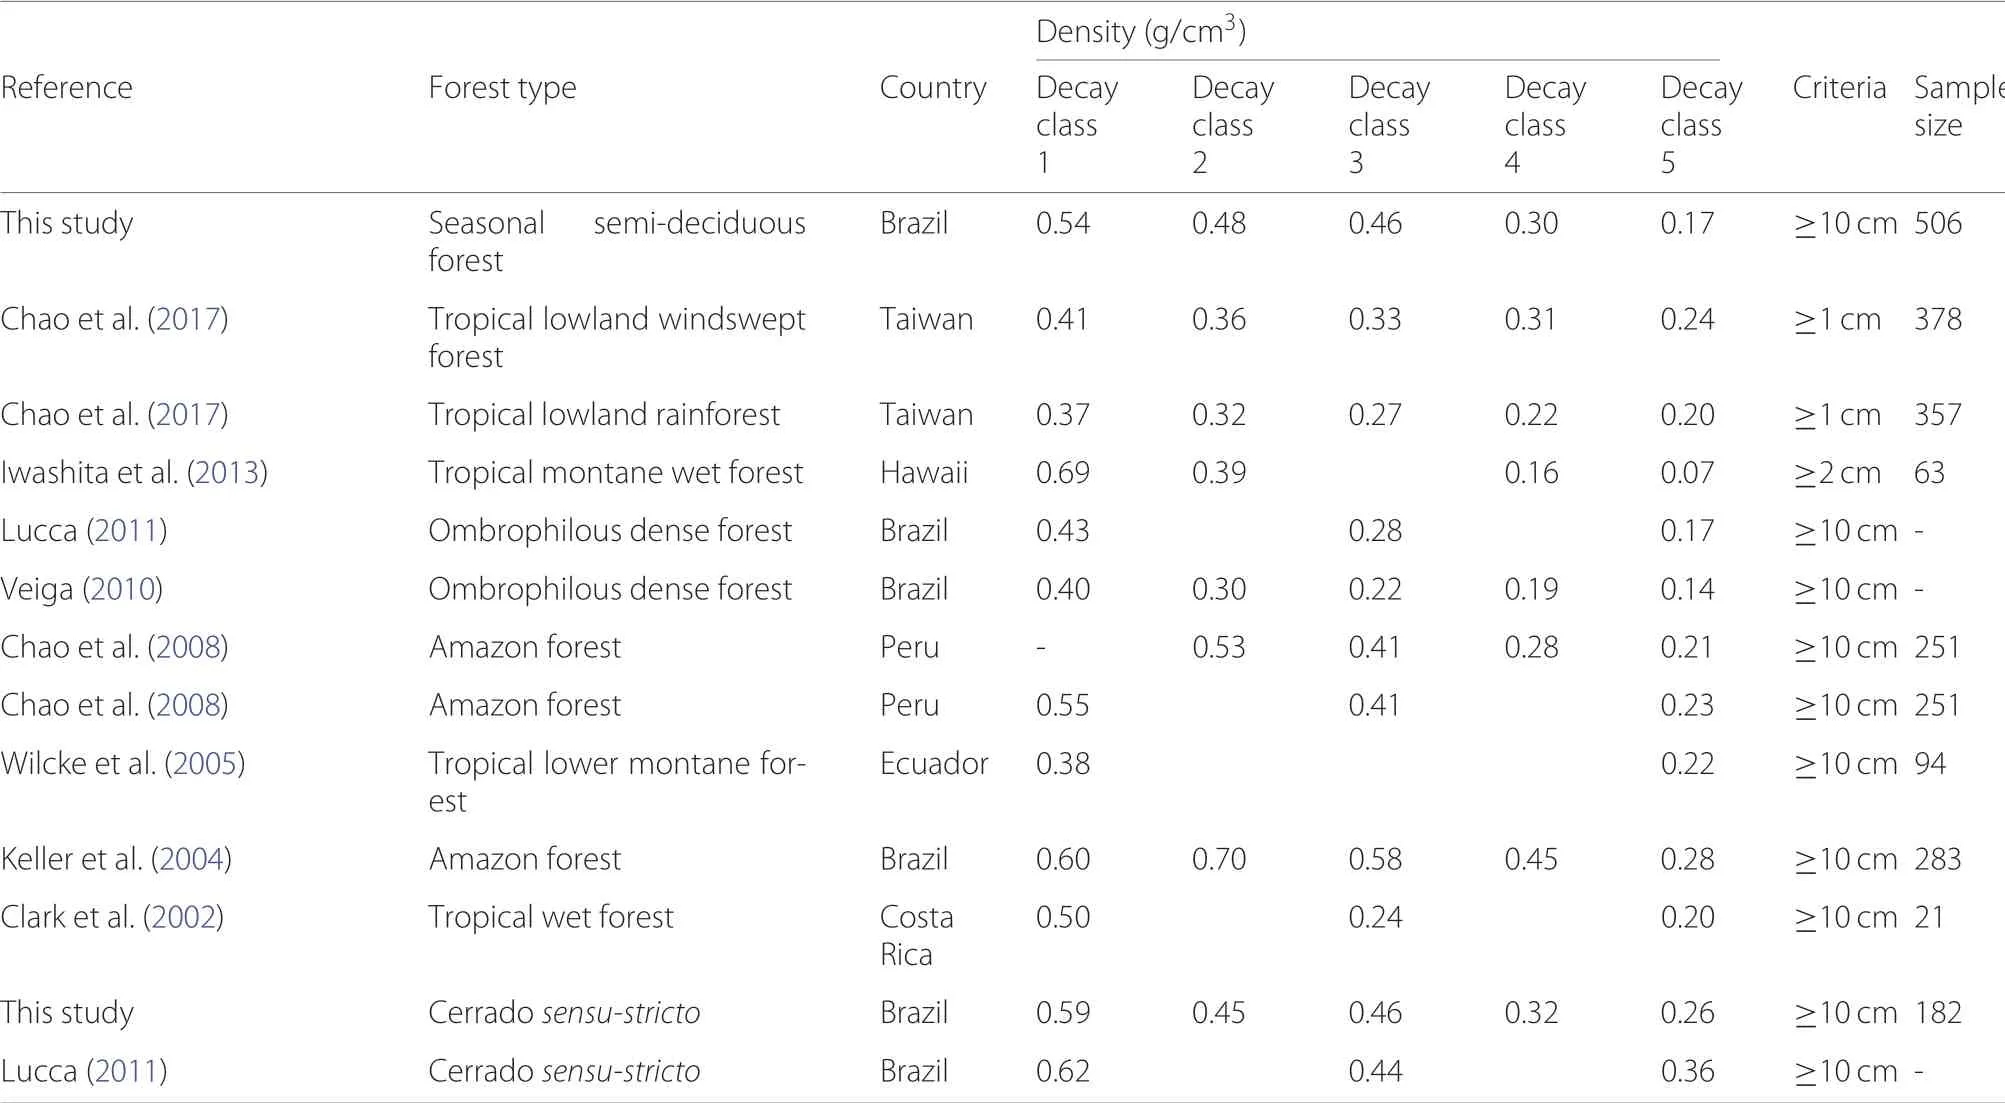
For both areas,as the decay class increases(from freshest to most decomposed material),wood density decreases.Table 1 shows the woody density by decay class results by stratum,as well as combined for each of the two study areas.Table 2 compares density values with other tropical forest and Cerrado studies.
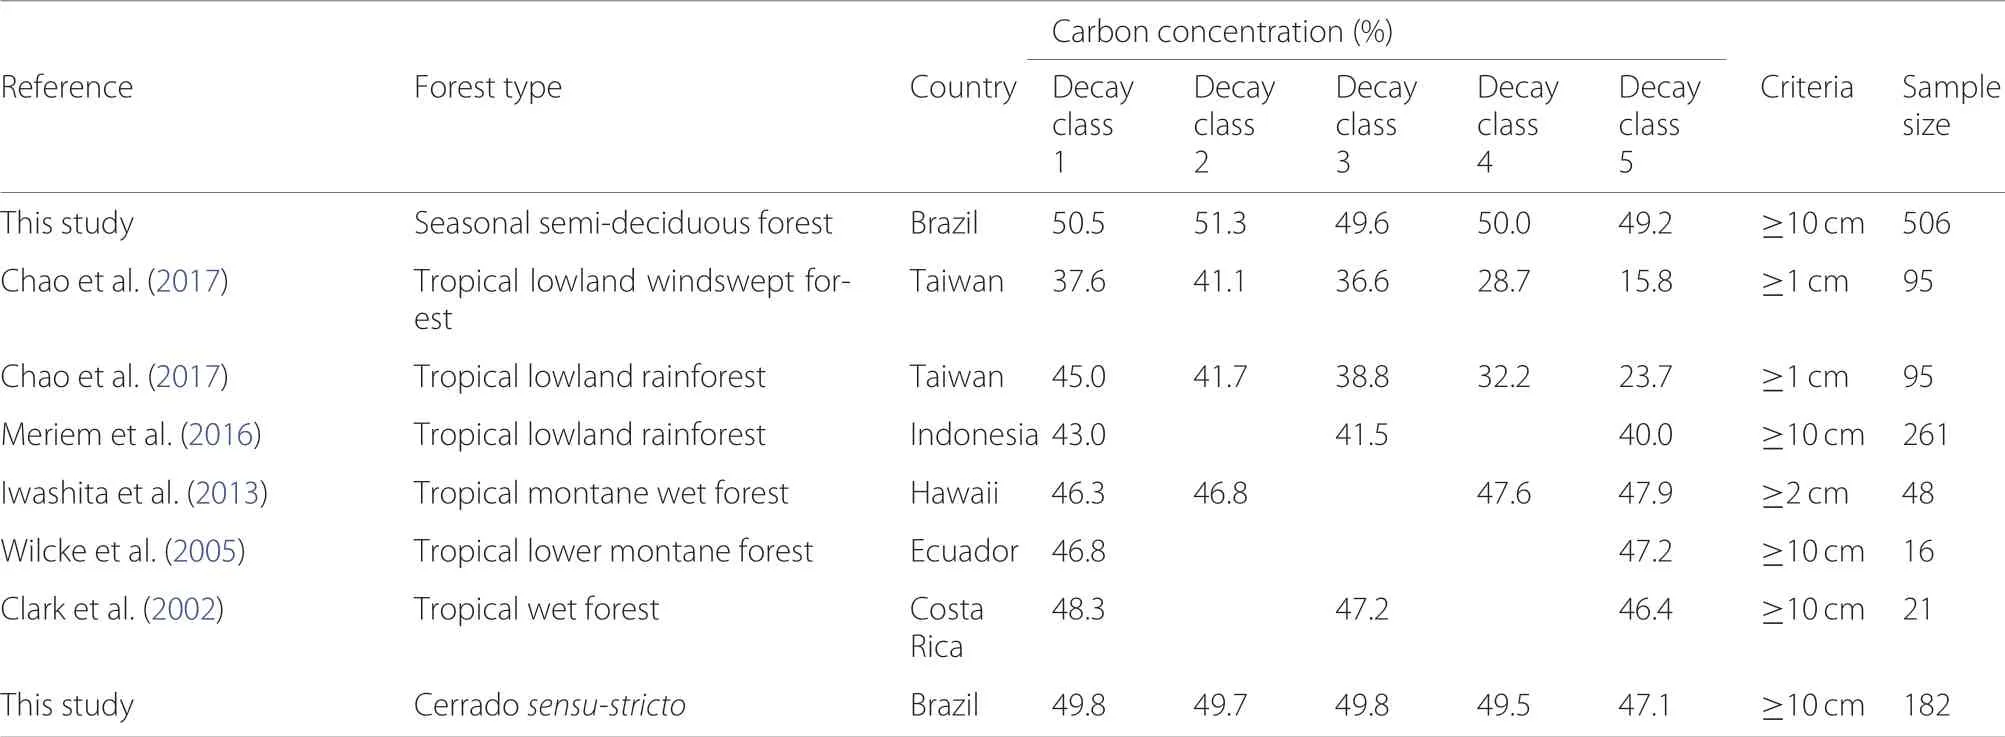
As has been noted,few studies have investigated carbon concentration of CWD.For SSF the mean carbon concentration of all analyzed samples was 49.8%with a standard deviation of 3.3,with a range of 27.9-57.0%across 506 observations.For CSS the general mean was 49.6%with a standard deviation of 2.6,with a range of 31.2-54.5%over 182 observations.Table 3 shows the carbon concentration by decay class found in both strata of both areas of the present study,and Table 4 compares these results with other studies in tropical forests.

Table 1 Averagewood density(g/cm3),by decay class,of coarse woody debrisin thestrataof the two studyareas,the Seasonal Semi-deciduous Forest(SSF)and the Cerrado sensu-stricto(CSS)
Figure 2 is a box plot with SSF and CSS data, with the average values from the studies mentioned in Table 4.No study was found to have investigated carbon concentration of dead woody debris in a Cerrado sensu-stricto ecosystem. Table 5 shows wood density and carbon concentration values by species and by decay class (but only when the species in the determined class was sampled five or more times).
Biomass per unit of area was estimated at 6.7 with a standard error of 0.83 Mg/ha (n=319), and 1.3 with a standard error of 0.25 Mg/ha (n=92) for the SSF and the CSS areas, respectively. Carbon stock were 3.3 with a standard error of 0.42 MgC/ha, and 0.7 with a standard error of, 0.12 MgC/ha for the SSF and the CSS, respectively.With a conversion constant of 50%, similar results of carbon stock were obtained: 3.33 with a standard error of 0.41 MgC/ha for the SSF, and 0.67 with a standard error of 0.12 MgC/ha for the CSS.
Discussion
Our results for wood density follow the general pattern observed in previous studies in which wood density decreases as decay class increases (i.e., the woody debris becomes more decomposed). Only Keller et al.(2004) shows an exception to this trend: class 2 exhibited a larger value than class 1; however, the authors did not propose an explanation for this observation. In decay class 5, the SSF exhibited lower densities compared tothe CSS,which matched the results from Lucca(2011)in an Ombrophilous Dense Forest(0.17g/cm3).The SSF value was also similar to density values from other studies such as Chao et al.(2017);Chao et al.(2008);Wilcke et al.(2005),and Clark et al.(2002).In terms of the present study,the two were similar except for decay class 5 where the CSShad 0.26±0.17g/cm3and the SSF had 0.17±0.12g/cm3.Iwashitaet al.(2013)wastheonly study that showed avery low valuefor decay class5(0.07g/cm3)compared to the other studies.

Table 2 Wood density(g/cm3)of woody debrisfound in the literaturefor Tropical Forestsand Cerrado ecosystems

Table 3 Averagecarbon concentration(%),by decay class,of coarse woody debrisin the strataof the two study areas,the Seasonal Semi-deciduous Forest(SSF)and the Cerrado sensu-stricto(CSS)
Asin thecurrent study,most studiesclassify CWD into five decay classes based on physical properties.Table 2 shows that some studies divide decay status into three or four classes,making the comparison more difficult.Our study produced results similar to those of Chao et al.(2008)who investigated CWD(≥10cm)in the Peruvian Amazon.They first divided elements into five decay classes,but they did not show data for decay class 1,because there was only one sample,as happened with both strata in the CSSarea.However,Chao et al.(2008)combined decay classes1 and 2,and also 4 and 5,to form asystem with threeclasses.That studiesproduced results similar to our decay classes 1,3 and 5.Comparing our resultsfrom the CSSwith Lucca(2011),thevaluesaresimilar for decay classes 1 and 3,but Lucca's are higher for decay class5.
The range of wood density in our data and other studies highlights the importance of measuring wood density to achieve better accuracy for estimates of CWD biomass(Chao et al.2017;Harmon et al.2008;Harmon et al.2013).In thefield,wewereableto identify 38 different speciesin the SSFareaand 18 in the CSS.Thespecieswasmost easily identified in decay classes1 and 2,whereasthespecies could be identified on only about 50%of the samples in decay class 4 and 5.If we restrict the list to those with more than five observation,then there only 11 species from SSF and 5 from CSS from Table 5.Of those,only five species have density estimates from more than one decay class.The densities generally decline with increasing decay class,but the patterns vary,as also observed by Harmon et al.(2008)who speculated that the patterns were influenced by many environmental conditions.
Though species identification for CWD is very difficult,if measurements on woody debris for specific species are available this data might help better understand variance patterns(Chao et al.2017).Table 5 demonstrates how few opportunities there are to examine species-level trends across decay class in CWD samples collected in tropical,mixed-species forests.This isparticularly truewhen thefocusof thestudy isestimating biomass and carbon and not specifically the density pattern by decay class.A study focused on the pattern likely restrict the scope to a small number of species that are well represented in a several decay classes.

Table 4 Carbon concentration(%)of woody debrisfound in the forestry literature for Tropical Forestsand Cerrado ecosystems

Fig.2 Box plot from the datacollected in the seasonalsemi-deciduousforest(SSF)and in the Cerrado sensu-stricto(CSS);wherethetrianglesarethe averagesfrom reference studies(Table 4)
In the few studies reporting carbon concentration(Table 4 and Fig.2)for tropical forests there are few contradictory results.The present study's results parallel Iwashita et al.(2013);Meriem et al.(2016),and Wilckeet al.(2005)wherethecarbon concentration barely changes within the decay classes.Clark et al.(2002)showed a small decrease in carbon concentration with an increase in decay class,and Chao et al.(2017)found in both areas that the carbon concentration decreases notably with thedecay class.
Chao et al.(2017)and Clark et al.(2002)found that thevarianceof carbon concentration increaseswith decay classes;i.e.,the higher the class,the higher the variability.Our results showed that the variance of carbon concentration increased until decay class 4,and then started to decreased.Chao et al.(2017)hypothesized that the fraction of fixed carbon is unlikely to be maintained in tropical forests with high biodiversity because of the many decomposition trajectories involving woody debris substrate quality,the myriad of microorganism activities,and the climatic conditions.Harmon et al.(1986)concludes decomposition is summarized in two major processes:physical/biological fragmentation of the material and mineralization(i.e.,soil leaching and respiration).
The results from our study show that the density of CWD declines with increasing decay class whereas the carbon concentration remains relatively constant at approximately 50%by mass.Thissuggests that those who sample CWD for carbon accounting should bemoreconcerned about the density values used to convert volume to biomass than the carbon concentration.Harmon et al.(2013)reached a similar conclusion after reviewing estimates of density and carbon concentration in the United States,Mexico,and Russia.They speculated that theerror in biomassestimateswhen using field estimatesof density would be in the range of 4-7%(Harmon et al.2008)but could be as high as 50%when using external estimates such as models.Those biomass errors,of course,would lead directly to carbon errorsof similar magnitude.

Table 5 Wood density(g/cm3)and carbon concentration(%)averagesof coarsewoody debrisby speciesand decay classfor the Cerrado sensu-sctricto(CSS)and Seasonal Semi-deciduous Forest(SSF)areas,with sample size n≥5,standard deviation in the parenthesis
In contrast,Chao et al.(2017)showed that they had overestimated carbon stock valuesby 17-36%when using the constant of 50%.They strongly recommended the evaluation of carbon concentration for CWD at the sitelevel,especially for tropical forests.Chao et al.(2017)did note that their results diverged from those obtained in other studies and recommend further investigations,suggesting that some underlying mechanisms may have been different.This divergence of trends both in the behavior of wood density in some species and in the variance of carbon concentration might be related not only to species,but also to different vegetation type,different environmental factors,such as temperature,rainfall,moisture,ground mineralization conditions,fire frequency,fungal and insect activity,and other factors,but unfortunately we cannot address those issues with our data.
Conclusions
Wood density and carbon concentration of dead woody debris are important variables for accurate estimation of biomass and carbon stocks.The present work supports numerous studies indicating that,in general,as woody debris becomes more decomposed(i.e.,as its decay class increases)its density decreases.There needs to more extensive studies of wood density and decay classes in the Atlantic Rain Forest and the Cerrado,with particular emphasis on the species level.The decay classes need to be adopted as a general methodology and there needs to be more work on consistent definitions and interpretation to facilitate comparisons between studies.Until we have more confidence about applying published values of density,it seems prudent to recommend that subsampling for wood density by decay class become a standard component of CWD inventories,especially in complex mixed-species forests.The density estimates are so important,the patterns by decay class are so variable and the species identification of dead material is so often problematic that subsampling for density is worth the additional cost and effort.
Very few studies were found that measured the carbon concentration of coarse woody debris,as most use the common conversion factor of 50%.The carbon concentrations reported in this study are not meaningfully different from the conventional conversion factor of 50%in any of our decay classes,but there are a few studies that contradict these findings.We recommend,therefore,that there should be more studies of carbon concentration in decay classes to explore those differences.
Abbreviations
CSS:Cerrado sensustricto;CWD:Coarse woodydebris;LIS:Line intersect sampling;SSF:Seasonal semi-deciduousforest
Acknowledgments
The authorswould like to thank São Paulo Research Foundation(FAPESP)for thefinancialsupport given to thisproject.
Funding
Thisstudywasfunded bythe São Paulo Research Foundation(FAPESP)through adoctoratescholarship(Grant no.2013/10922-2)and a Research Internship Abroad(Grant no.2014/14213-9).
Availability of data and materials
The datacannot be shared at the moment of thismanuscript'spublication because the authorsare still working on supplementaryanalysesto be published at alater date.
Use of plants
Thisresearch involvesworking with plantsthrough thecollection of coarse dead woodydebrissamplesfrom two remnant areasof the Brazilian Atlantic Forest and Brazilian Savanna,both of which areadministered by the government of the State of São Paulo.All local,nationaland international guidelinesand lawshavebeen followed,including theacquisition of appropriate required permissionsfor the fieldwork.
Authors'contributions
ABM,TGGand HTZCconceived and designed thefield and laboratory protocol;ABMperformed the field workand laboratoryanalysis;ABManalyzed thedata;TGGand HTZCcontributed to theanalysis;and ABMwrotethepaper.All co-authorsassisted the lead author in writing and revising the manuscript.Finally,allauthorsread and approved thefinalmanuscript.
Ethicsapproval and consent to participate
Not applicable.
Consent for publication
All authorsconsent to the publication of thismanuscript.
Competing interests
Theauthorsdeclarethat they haveno competing interests.
Received:16 October 2018 Accepted:8 March 2019

- Forest Ecosystems的其它文章
- Improved simulation of carbon and water fluxes by assimilating multi-layer soil temperature and moisture into process-based biogeochemical model
- Potential gains from spatially-explicit coordinated planning between two large public ownerships in Minnesota
- South Carolina forestland owners'willingness to accept compensations for carbon sequestration
- Climate forcing of tree growth in dry Afromontane forest fragments of Northern Ethiopia:evidence from multi-species responses
- What is a tree in the Mediterranean Basin hotspot?Acritical analysis

