April 2019

Recent price movement
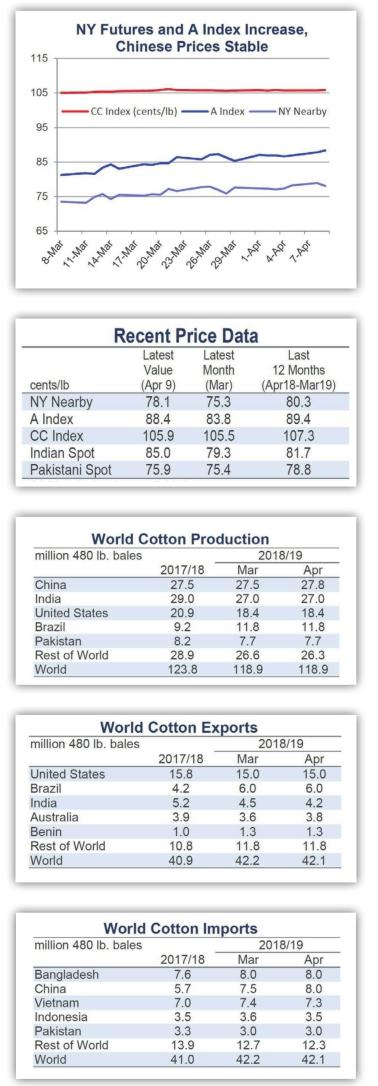
Benchmark prices either increased or were stable over the past month.
Prices for the May NY futures contract increased, climbing from levels near 75 cents/lb in mid-March to those near 79 cents/lb recently. The July contract, which now represents more open interest, also rose and has maintained values slightly higher than those for the May contract.
The A Index climbed from values near 82 cents/lb near the middle of last month to those near 88 cents/lb most recently.
Chinese cotton prices represented by the CC Index (3128B) were comparatively stable in both international and domestic terms, holding to values near 105 cents/lb and 15,600 RMB/ton.
Indian spot prices (Shankar-6 quality) increased in both international (from 77 to 85 cents/lb) and domestic terms(from 42,500 to 46,200 INR/candy).
Pakistani spot prices were steady at values close to 75 cents/lb or 8,700 PKR/ maund.
Supply, demand, & trade
This months USDA report included only marginal changes to global production, consumption, and trade estimates. The world production number increased just 45,000 bales, leaving last months estimate essentially unchanged at 118.9 million. The world mill-use figure was lowered 412,000 bales to 123.2 million. Along with a slight reduction to 2018/19 beginning stocks, the net effect was a 359,000 bale increase to the forecast for global ending stocks (to 76.4 million).
The only notable country-level revisions for production were for China(+250,000, to 27.8 million) and Burkina Faso (-200,000, to 1.0 million). For milluse, the largest changes included those for Turkey (-300,000, to 6.5 million), the U.S. (-100,000, to 3.1 million), and Vietnam (-100,000, to 7.2 million).
The global forecast for trade was essentially unchanged (-87,000 bales, to 42.1 million), but there were a series of significant country-level updates. In terms of imports, the largest adjustments were for China (+500,000 bales, to 8.0 million), India (-200,000, to 1.4 million), Turkey (-200,000, to 3.0 million), and Vietnam (-100,000, to 7.3 million). In terms of exports, the largest adjustments were for Australia (+200,000, to 3.8 million), Turkey (+100,000, to 0.5 million), India (-300,000, to 4.2 million), and Burkina Faso (-150,000, to 1.1 million).
Price outlook
As planting has begun in many northern hemisphere producing countries, attention has shifted ahead to the upcoming crop year. Next month, the USDA will issue their first comprehensive set of supply, demand, and trade estimates for 2019/20. These projections will inform baseline expectations, but will have to be based on important assumptions regarding macroeconomic conditions, the trade environment, and the weather.
For cotton prices, a key variable in recent years has been the allocation of stocks inside and outside of China. As has also been the case in recent crop years, there has been considerable uncertainty when attempting to predict those allocations.
On the Chinese side of the equation, uncertainty stems from reserve stocks and imports. In each of the past three crop years, the Chinese government has conducted auctions of reserve supplies in the spring and summer. In each of the past two years, those sales began in March. This year, sales have not begun, and there has been no official statement as to whether or not sales will eventually occur. Inspections of warehoused reserves have been reported. This has been interpreted as preparation for an impending round of auctions, but no announcement has been made.
Chinese officials suggested last fall that reserves could be near a minimum target level. Correspondingly, the further drawdown of reserves that would result from another round of auctions could prompt the Chinese government to purchase imports to replenish its supplies. Imports could also increase with the release of additional quota allowing Chinese mills to access the international market directly. Regardless of whether it is the Chinese government or Chinese mills doing the importing, the central question is if Chinese stocks nationally (private and governmental) have reached a level where they can be expected to stabilize or if they will be allowed to decrease further.
Stabilization of Chinese stocks requires China to import a volume equal to its production deficit. The USDAs current estimates put Chinas production deficit in 2018/19 at 13 million bales. If the deficit is maintained in 2019/20 and China decides to stabilize stocks, Chinese imports will need to increase five million bales (current USDA forecast for Chinese imports in 2018/19 is 8.0 million bales).
With respect to the allocation of stocks inside and outside of China, a dominant variable for the collective world-outside-China has been the weather. While also a factor in India, this has been especially true for the U.S., where drought and hurricanes wiped out several million bales of production in 2018/19. With U.S. acreage predicted to be stable, a return to neutral/beneficial growing conditions in 2019/20 would result in a very large U.S. crop (USDA forecast in February was 22.5 million bales, current 2018/19 estimate is 18.4 million).
The potential increase in production from the U.S. alone suggests that it will not be difficult for China to find the imports it would need to stabilize stocks. However, India, and most other cotton exporters are also projected to grow more cotton next crop year. For prices, this exposes a vulnerability. If the weather is good and if China does not significantly increase imports, the world-outsideChina could face a significant increase in stocks. If that proves the case, prices globally could face downward pressure.
- China Textile的其它文章
- Deepening opening and collaboration to lead high quality development
- May 2019
- China Fashion Week A/W 2019/20:Meeting the future
- Young Entrepreneurs Village and 17QCC.com start the new eco—economic engine of e—commerce in 2019
- Shishi Fashion Week 2019:Design & Times
- MSREXPO2019 and STCF2019 successfully held in Shishi

