
Analysis of vegetation changes and dominant factors on the Qinghai-Tibet Plateau,China
2019-05-09 07:33:50HongWeiWangYuanQiChunLinHuangXiaoYingLiXiaoHongDengJinLongZhang
HongWei Wang ,Yuan Qi,ChunLin Huang ,XiaoYing Li,2,XiaoHong Deng ,JinLong Zhang
1.Northwest Institute of Eco-environment and Resources,Chinese Academy of Sciences,Lanzhou,Gansu 730000,China
2.University of Chinese Academy of Sciences,Beijing 100049,China
ABSTRACT This research was undertaken to clarify the characteristics of vegetation change and its main influencing factors on the Qinghai-Tibet Plateau.Using the greenness rate of change(GRC)and correlation factors,we analyzed the trend of vegetation change and its dominant factors from 2000 to 2015. The results indicate that the vegetation tended to improve from 2000 to 2015 on the Qinghai-Tibet Plateau,with the improved area accounting for 39.93% of the total;and the degraded area accounting for 19.32%. The areas of degraded vegetation are mainly concentrated in the low-relief and intermediate-relief mountains of the high-altitude and extremely high-altitude areas on the Qinghai-Tibet Plateau, as the vegetation characteristics are impacted by the terrain. Temperature and precipitation have obvious response mechanisms to vegetation growth, but the effects of precipitation and temperature on vegetation degradation are not significant over a short time frame. Overgrazing and population growth are the dominant factors of vegetation degradation on the Qinghai-Tibet Plateau.
Keywords:Qinghai-Tibet Plateau;remote sensing;vegetation activity;degraded;dominant factors
1 Introduction
Climate change and environmental issues are two key elements of global change research,which analyzes challenges to the survival of humans and the sustainable development of the global socio-economy(Wang et al., 2008; Moss et al., 2010). As an important component of the terrestrial ecosystem, vegetation is a natural link to the water cycle, energy exchange, and biogeochemical cycle on the terrestrial surface (Peng et al., 2012). Vegetation dynamics are closely associated with ecosystem services, such as biodiversity,soil and water conservation,wildlife habitats, and food and fiber production (Godinez-Alvare et al.,2009;Smith et al.,2014).
Remote-sensing data has become the most important source for monitoring and evaluating global vegetation dynamics at large spatial scales, based on the great advantages of long time-series span and wide coverage (Zhang et al., 2011; Peng et al., 2012;Dardel et al.,2014).The normalized difference vegetation index (NDVI) is an important indicator for characterizing surface plant growth and monitoring vegetation changes (Stow et al., 2004; Jamali et al.,2014; Tian et al., 2016). NDVI is mainly derived from advanced very high-resolution radiometer(AVHRR), Système Probatoire d'Observation de la Terre VÉGÉTATION (SPOT VGT), and moderateresolution-imaging spectroradiometer (MODIS) remote-sensing data, which can detect regional and global land-vegetation processes and how they change temporally and spatially across seasonal and interannual scales (Pinzon and Tucker, 2014; Tian et al., 2015; Otto et al., 2016).AVHRR NDVI data have been available since 1981,which provides a long time sequence and is used for drought monitoring, vegetation-change monitoring, land-cover change, climate relations, and other fields of inquiry (Anyamba and Tucker, 2012; Waylen et al., 2014; Xu et al., 2014;Tian et al., 2016). However, these data have inadequacies such as low spatial resolution, a wide band vulnerable to water vapor interference, etc. (Fensholt et al., 2009). The SPOT/VGT sensor began to obtain data in April 1998 for global vegetation-cover observation. Its band information is rich and has the advantages of a red band sensitive to chlorophyll content, a near-infrared band removed from the water vapor absorption zone, and a high spatial resolution(Fensholt et al., 2009). MODIS NDVI data improved the spatial resolution, temporal resolution, spectral resolution, and chlorophyll sensitivity, which were superior to AVHRR NDVI and SPOT VGT NDVI data, excluding atmospheric water vapor interference. Additionally, MODIS NDVI has promise for vegetation dynamic monitoring (Huete et al., 2002).Therefore, MODIS NDVI data were selected to analyze the vegetation activities on the Qinghai-Tibet Plateau.
The Qinghai-Tibet Plateau is one of the most sensitive areas responding to global climate change and global environmental change, and is recognized as a hot spot for coupled studies on global terrestrial ecosystem change and global climate change. This paper calculated the greenness rate of change (GRC) on the Qinghai-Tibet Plateau and then quantitatively analyzed the relationship between vegetation change and land use, topography, climate, and human activities.This research has scientific and practical significance for the study of the response and feedback mechanisms of vegetation restoration and global climate change on the Qinghai-Tibet Plateau.
2 Data and methods
2.1 Study area
The Qinghai-Tibet Plateau is known as "the third pole of the earth" and "the roof of the world." It is a"sensitive area" of climate change in the Northern Hemisphere, containing many glaciers, permafrost,wetlands, lakes, and large areas of grassland and forest ecosystems, and is an important source of water for Asia(Sun et al.,2012;Zhang et al.,2014).The alpine meadow, alpine steppe, and alpine swamp-meadow grassland are widely distributed on the Qinghai-Tibet Plateau;and they are an important part of the Qinghai-Tibet Plateau ecosystem and the basis of the regional economic development of animal husbandry(Wang et al.,2002).With changes in the water and hydrological conditions, the pattern, process, and function of the Qinghai-Tibet Plateau ecosystem have changed. Grassland degradation, forest fluctuation,wetland disappearance,and intensification of desertification have seriously affected the environment, socioeconomic development and production, and the life of the local people on the Qinghai-Tibet Plateau (Yao and Zhu, 2006; Zhu et al., 2015; Wang et al., 2016;Hu et al.,2017).
2.2 Data
2.2.1 DEM data
Digital elevation model(DEM)(90m×90m resolution) data are from the U. S. Geological Survey(USGS) Earth Resources Observation and Science(EROS) Center (https://eros. usgs. gov). DEM data were processed by geometric correction, registration,and projection transformation.Figure 1 shows the distribution of DEM and meteorological stations on the Qinghai-Tibet Plateau.
2.2.2 MODIS NDVI data
MODIS NDVI data are freely available for download from the National Aeronautics and Space Administration (NASA) (http://www.nasa.gov), including the Terra's and the Aqua's 1-km-resolution monthly synthetic-vegetation-index products MOD13A3 and MYD13A3, from 2000 to 2015. The MODIS reprojection tool (MRT) is used to preprocess the image mosaic, data-format conversion, and projection conversion. The average monthly MOD NDVI and MYD NDVI have a correlation coefficient of 0.991 on the Qinghai-Tibet Plateau, as was calculated by taking the weighted average of the two types of data(Figure 2).
2.2.3 Other data
Meteorological data came from the China Meteorological Data Service Center (CMDC) (http://data.cma. cn), including indicators of the Qinghai-Tibet Plateau and the surrounding area. One-hundred-andnineteen weather stations provided monthly average temperature and precipitation data from 2000 to 2015.The weather-station data were preprocessed,and missing values were removed.
The land-use (1km×1km resolution) data were derived from the Cold and Arid Regions Science Data Center(http://westdc.westgis.ac.cn).
The statistical data were derived from the National Bureau of Statistics (NBS) of China national data(http://data.stats.gov.cn).
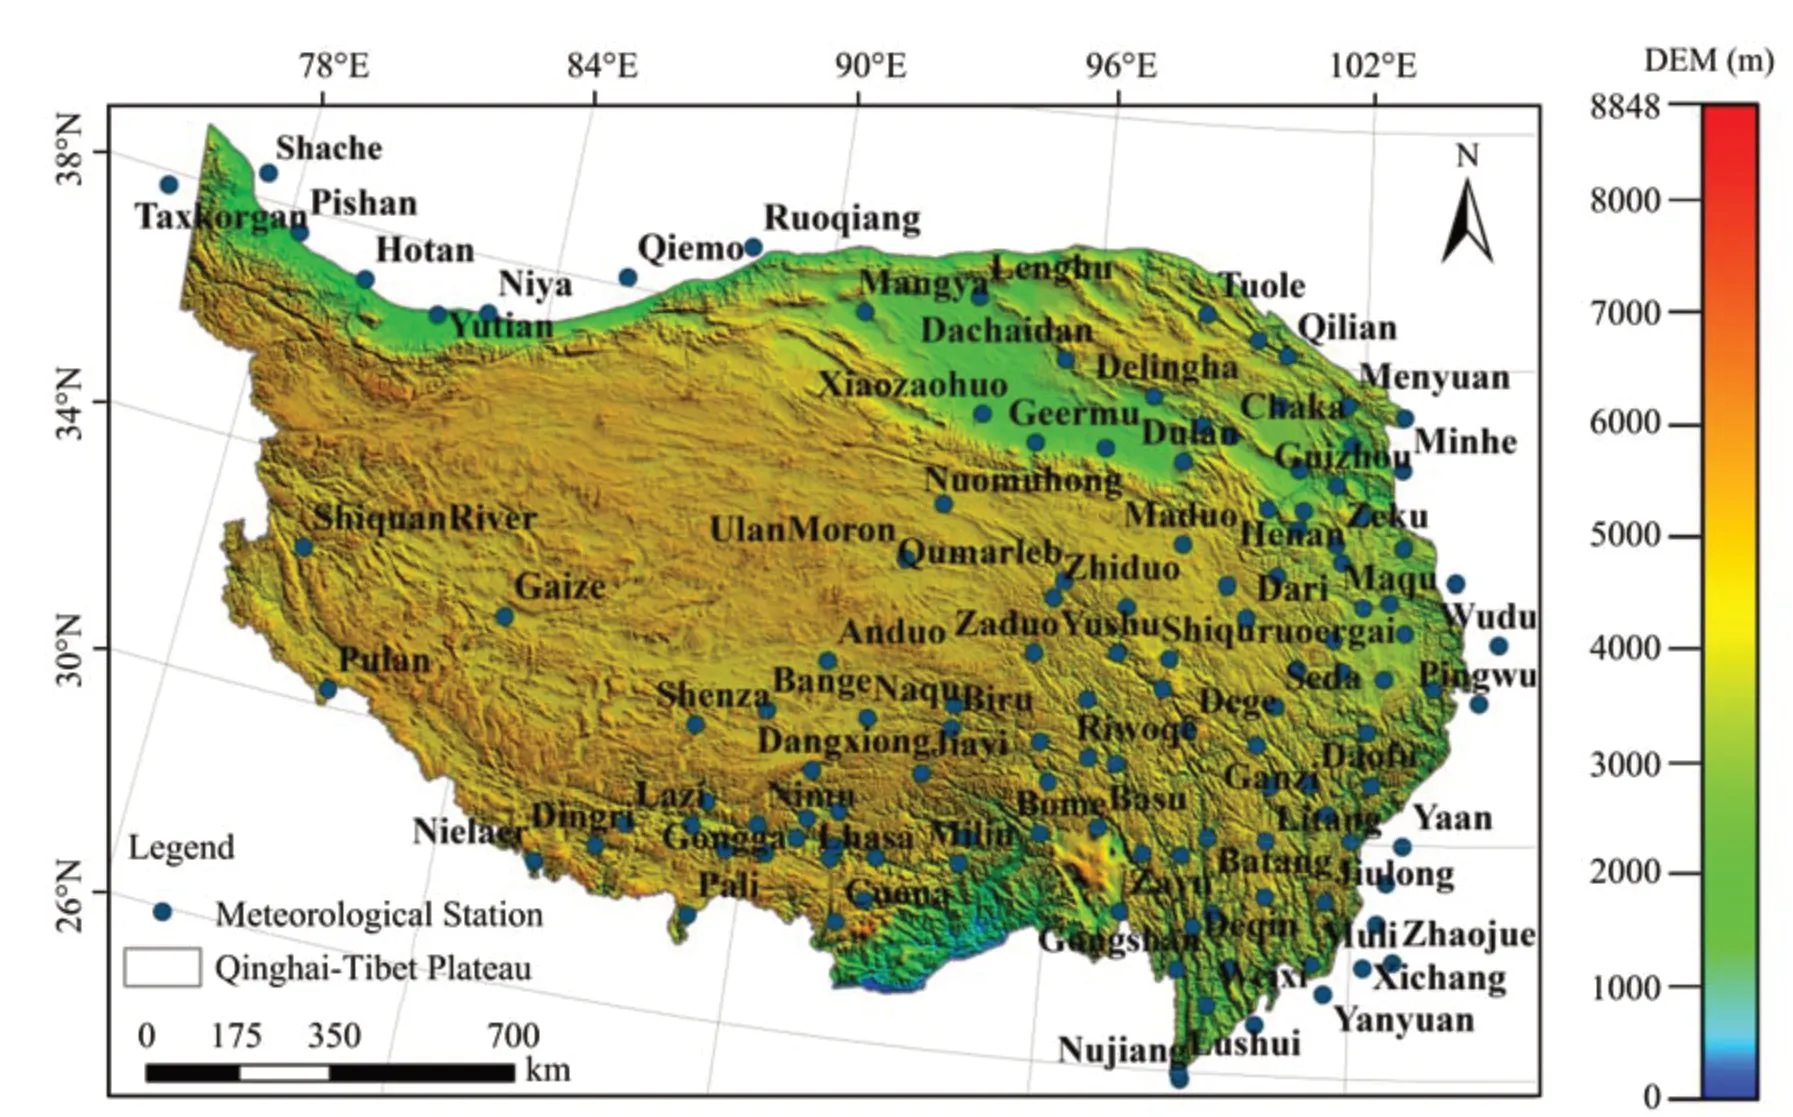
Figure 1 Spatial distribution of DEM and meteorological stations on the Qinghai-Tibet Plateau
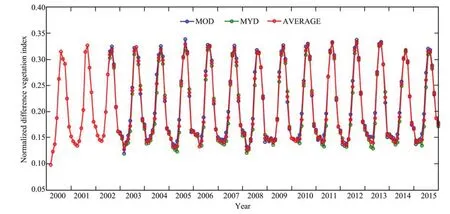
Figure 2 Time-series of NDVI values among MOD13A3,MYD13A3,and the average monthly NDVI on the Qinghai-Tibet Plateau from 2000 to 2015
2.3 Methods
2.3.1 Trend analysis
Linear-regression analysis can simulate the trend of each grid. This method was used to simulate the GRC of vegetation and analyze the change rates of NDVI (Stow et al., 2003), as shown in the following formula:
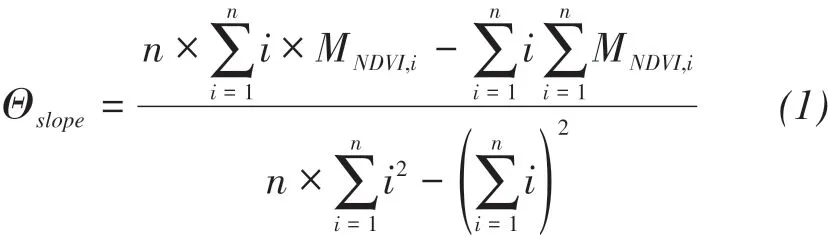
where Θslopeis the slope of the unary linear-regression equation; n is the serial number of years 2000-2015;and MNDVI,iis the maximum NDVI value of the growing season in the i th year.
2.3.2 Spearman's rank correlation analysis
The relationship between vegetation change and climate response was analyzed for the Qinghai-Tibet Plateau. Because the data is not subject to the normal distribution, Spearman's rank correlation coefficients were used (Croux and Dehon, 2010). The formula is as follows:
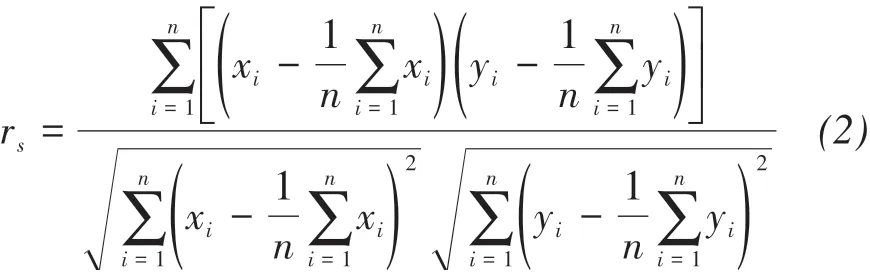
where rsis Spearman's rank correlation coefficient; n is the time-series; and xi,yiare the rank of each variable in the time-series i(1≤i≤n).The statistical significance of the correlation coefficient is verified by the ttest method.
3 Results and discussion
3.1 Monitoring of vegetation activities on the Qinghai-Tibet Plateau
Based on the monthly mean MODIS NDVI data on the Qinghai-Tibet Plateau, the maximum growing season of vegetation was calculated. From Figure 6a for the one cycle, based on MODIS NDVI data of the maximum growing season from 2000 to 2015,the GRC was calculated for 2000-2005/2005-2010/2010-2015/2000-2015(Figure 3)to analyze the rates of change of NDVI on the Qinghai-Tibet Plateau.The results, as presented in Table 1, show that (1) (from Figure 3a) the vegetation improved from 2000 to 2005, with the improved area and degraded area accounting for 60.09% and 24.45%, respectively; from Figure 3b, the improved area and degraded area were nearly equal to each other for 2005-2010, accounting for 38.33% and 38.83%, respectively; and from Figure 3c, the degradation of vegetation is serious for 2010-2015, with a degraded area as high as 55.48%.This degradation was mainly concentrated in the eastern region of the Qinghai-Tibet Plateau. (2) Overall,there was an improvement of vegetation from 2000 to 2015 on the Qinghai-Tibet Plateau (Figure 3d). The improved area accounted for 39.93%, while the degraded area accounted for 19.32%.The degraded area was mainly concentrated in the Naqu, Dangqiong,Sangri, Naidong, Qusong, Luolong, Gonghe, Gangcha regions.
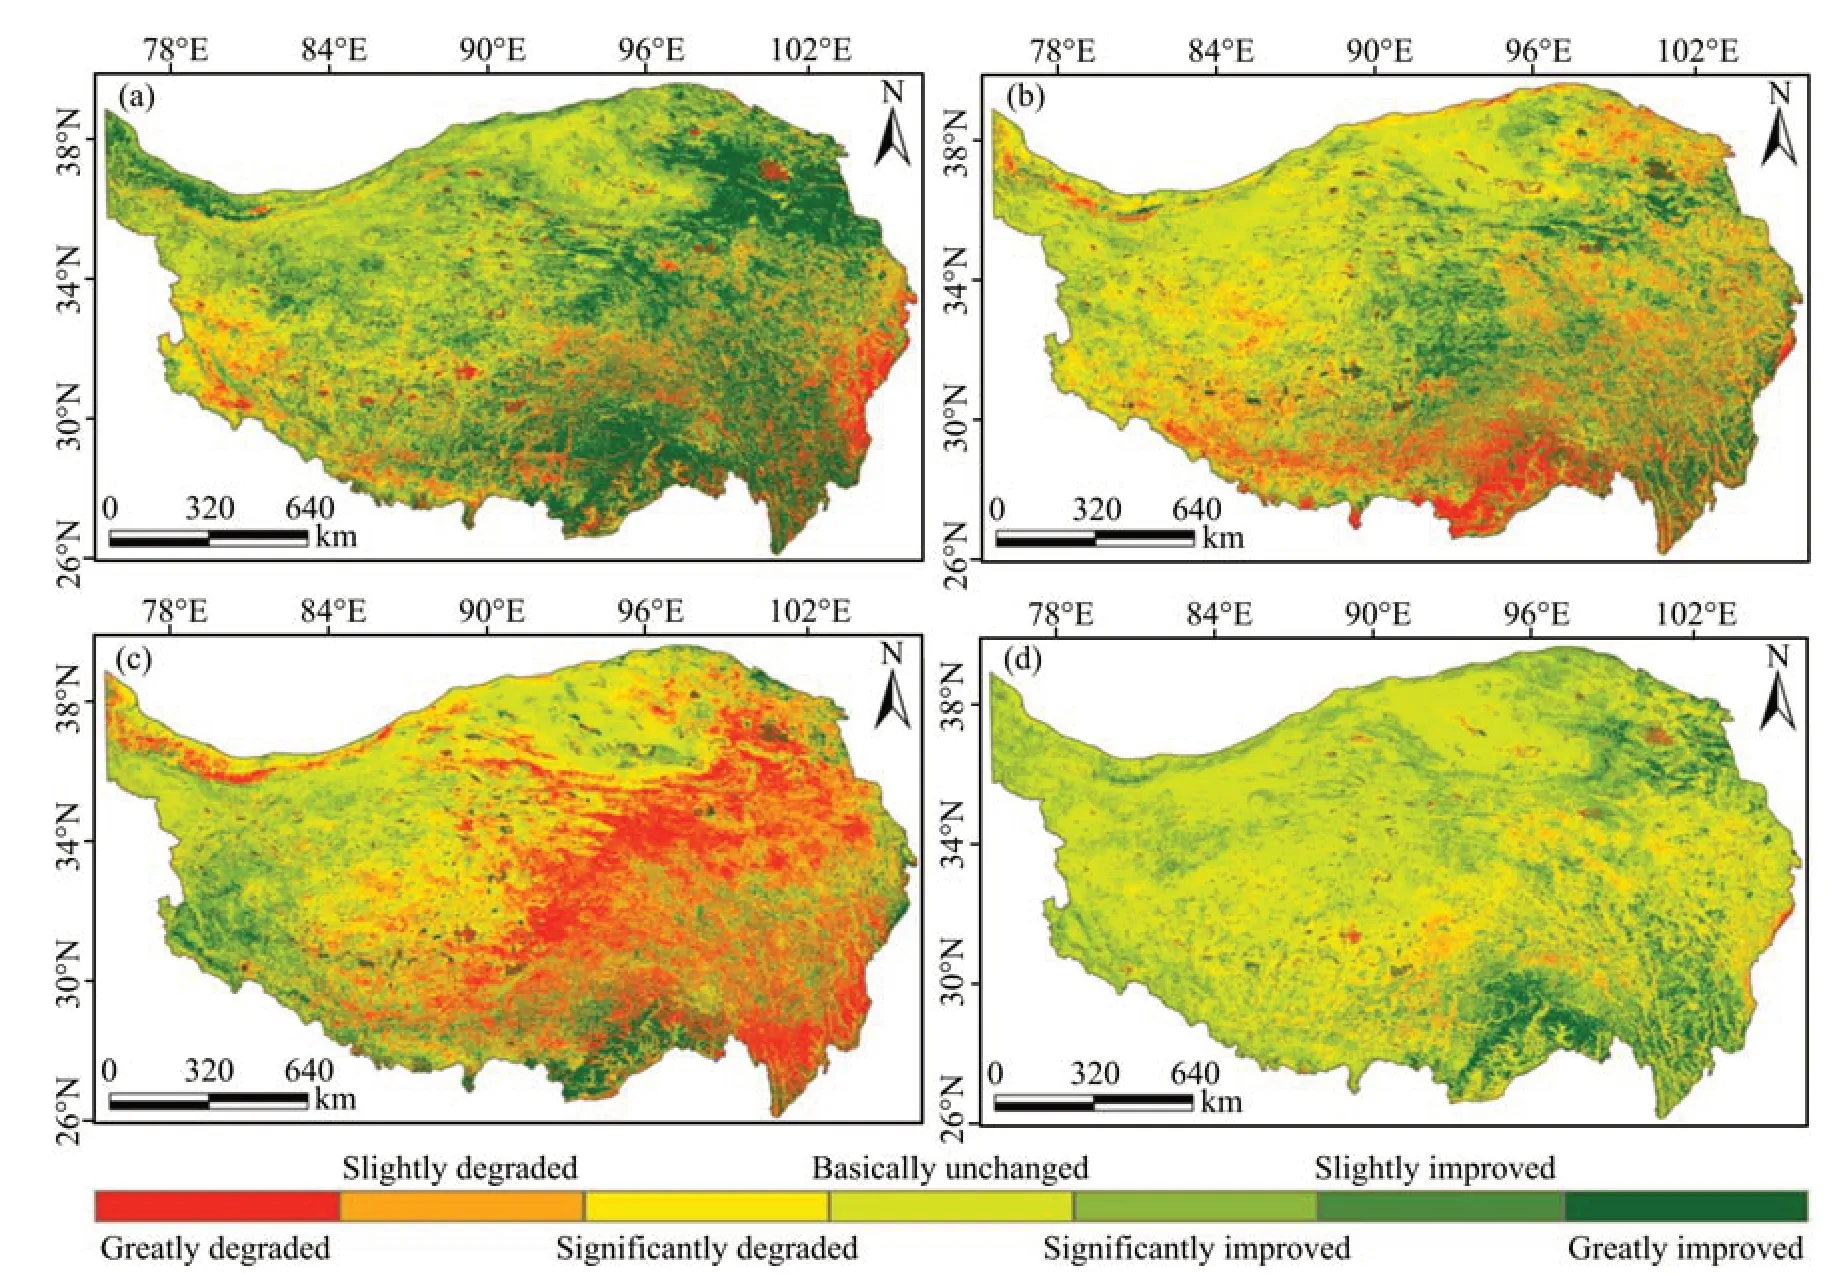
Figure 3 Spatial change trends of MODIS NDVI on the Qinghai-Tibet Plateau:(a)2000-2005,(b)2005-2010,(c)2010-2015,and(d)2000-2015
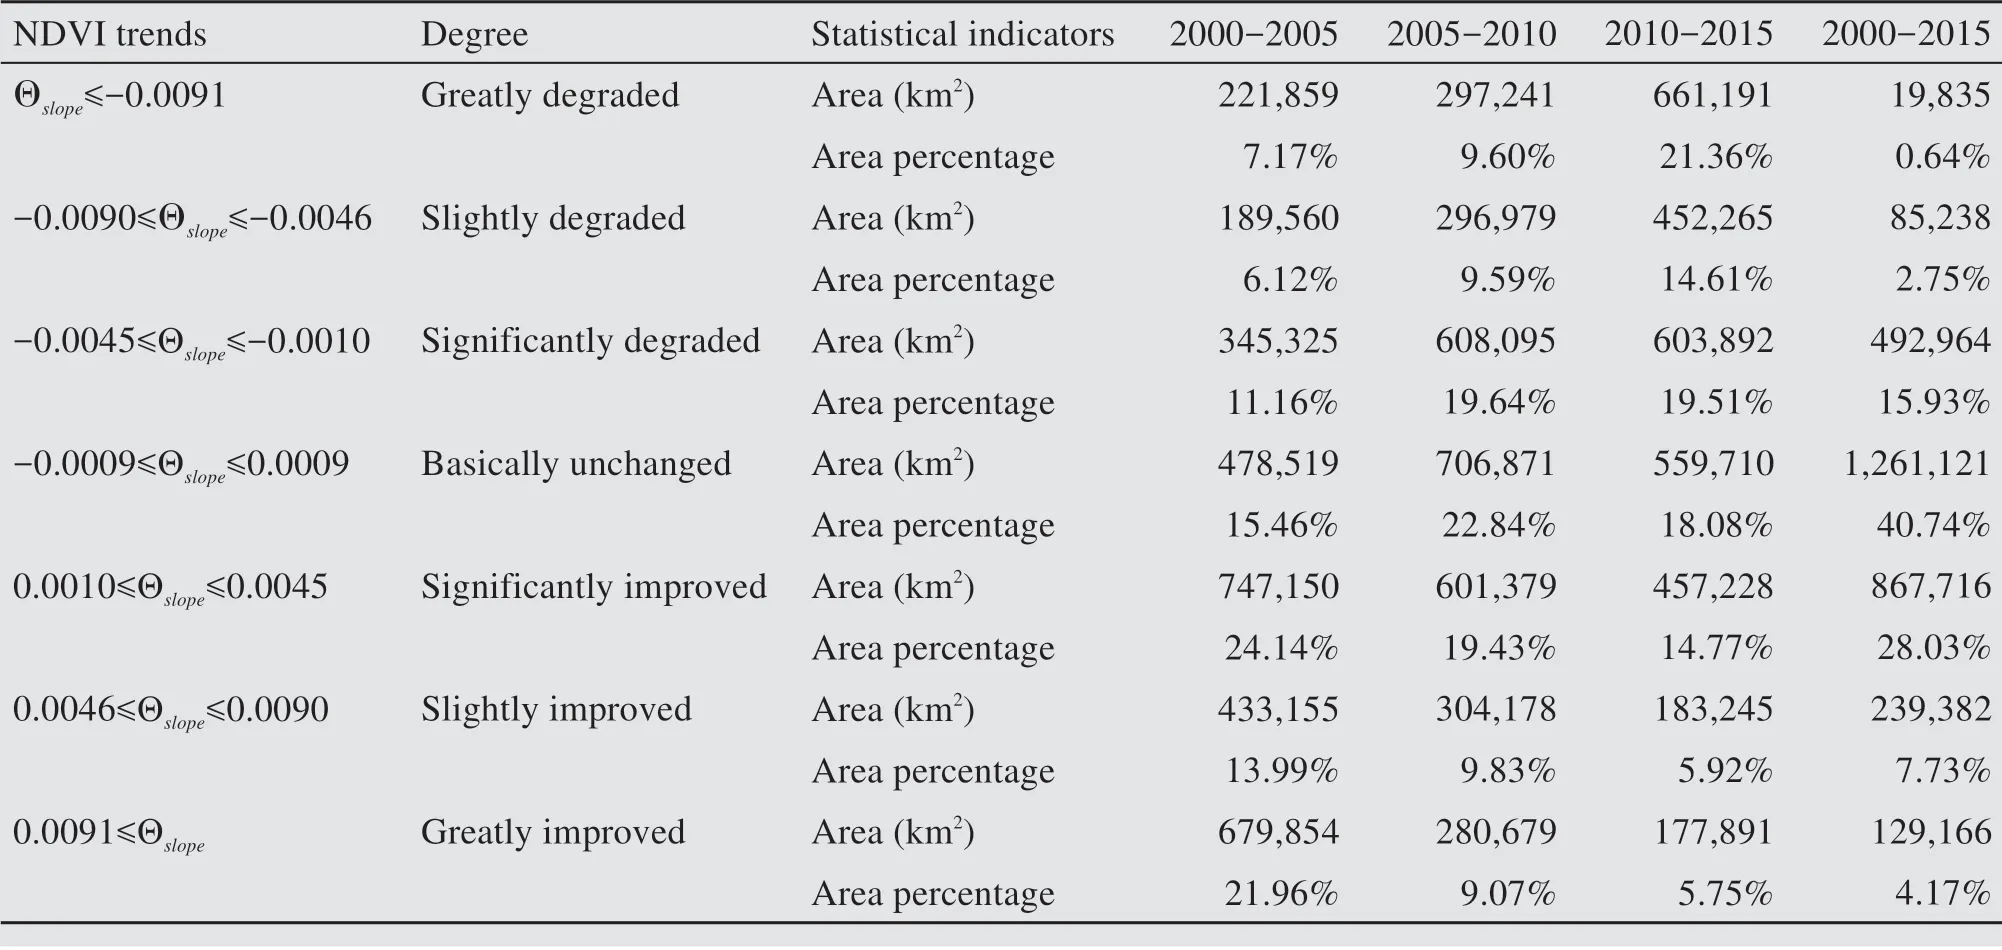
Table 1 Comparison of MODIS NDVI trend on the Qinghai-Tibet Plateau(2000-2005,2005-2010,2010-2015,2000-2015)
3.2 Analysis of vegetation change of different ecological types on the Qinghai-Tibet Plateau
The vegetation-distribution pattern was divided into forest, grassland, farmland, and sparse vegetation(Li et al., 2014). Grassland was the dominant type,with an area of 15×105km2, accounting for 57.5% of the total area of the Qinghai-Tibet Plateau (Figure 4).From 2000 to 2005, the vegetation types improved;and the improvement of grassland was the most obvious.The improved area accounted for 59.8%of the total grassland area. From 2005 to 2010, forest vegetation was degraded; and the degraded area accounted for 52.44% of the total forest area. Grassland vegetation was degraded, and the degraded area accounted for 41.8% of the total grassland area. Farmland and sparse vegetation remained stable. From 2010 to 2015, the grassland vegetation type was seriously degraded, and the degraded area accounted for 61.4% of the total area of grassland vegetation. In terms of severity, this change was followed by forest vegetation,with a degraded area accounting for 57% of the total area of forest vegetation.The degradation of farmland and sparse vegetation was minor.
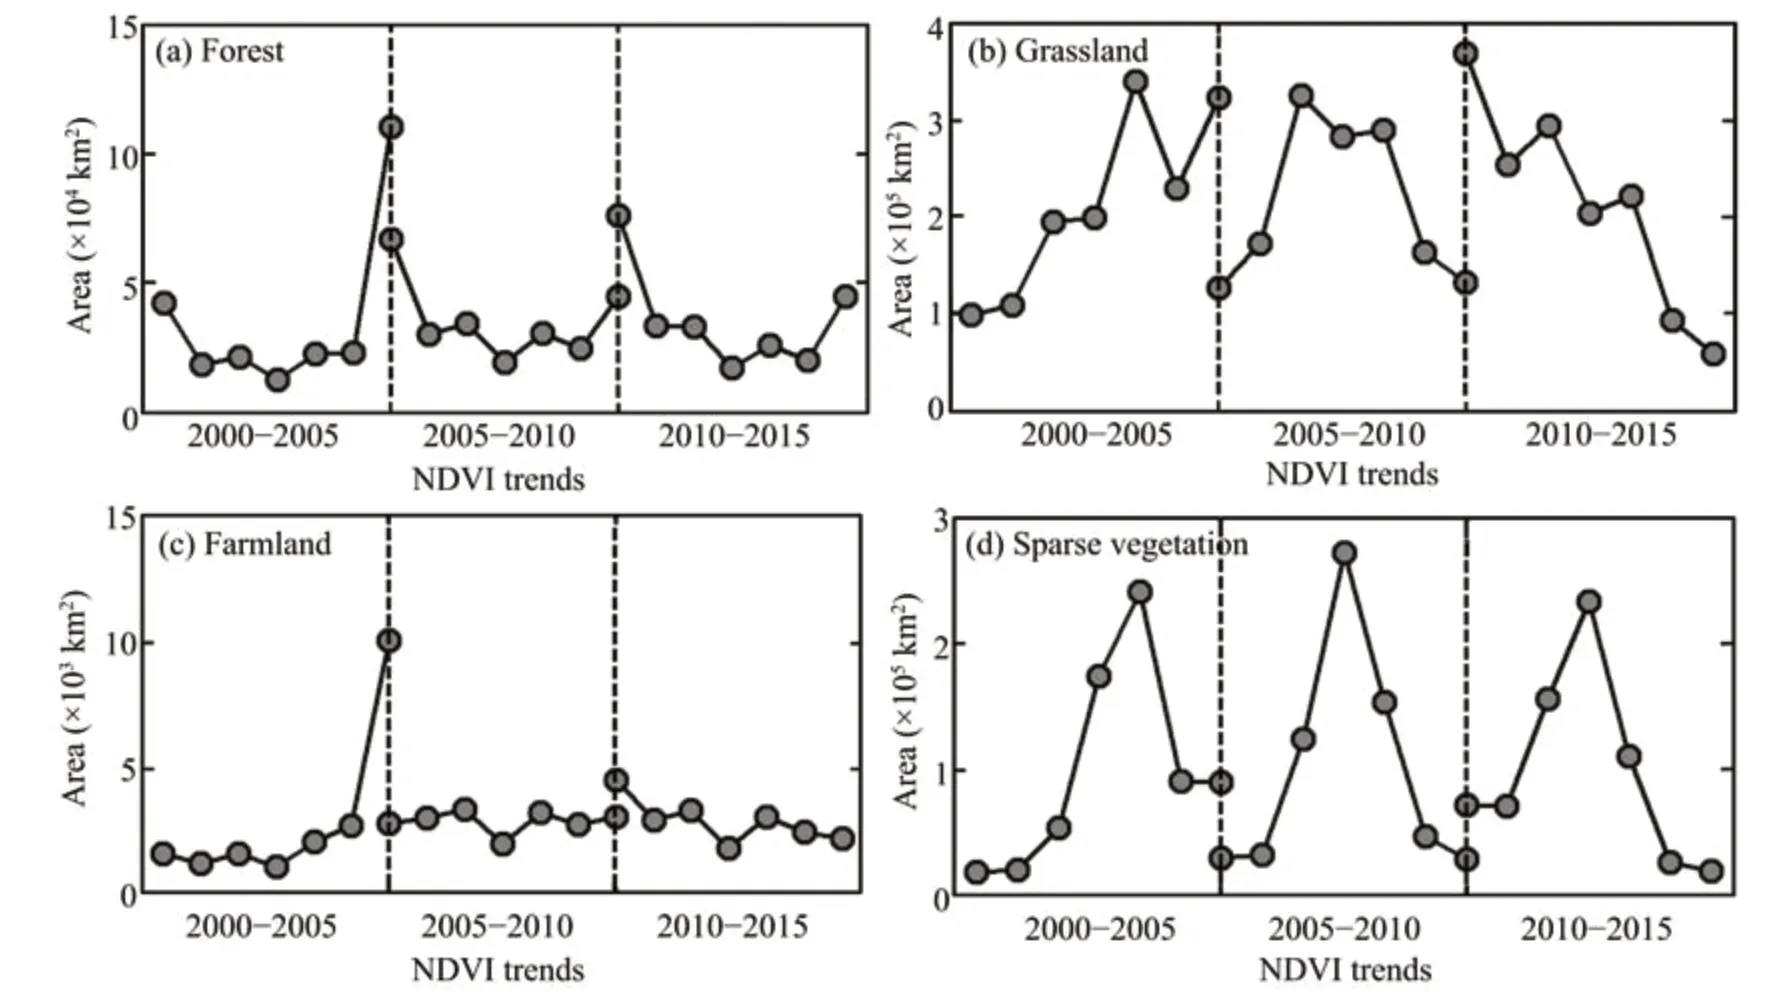
Figure 4 Change trend of NDVI in different vegetation types
3.3 Analysis of mountain types and vegetation changes on the Qinghai-Tibet Plateau
According to the method of mountain division,the Qinghai-Tibet Plateau was divided into 26 categories for analysis (Nan et al., 2016).According to Figure 5, the vegetation-degraded area was mainly concentrated in the high-altitude area of the plain/platform, hill, low-relief mountain, intermediate-relief mountain, high-relief mountain; and at the extremely high altitude of the low-relief mountain and intermediate-relief mountain. The area of vegetation degradation was the most severe in the region from 2000 to 2005. Virtually unchanged areas were mainly concentrated in the sub-high altitude of the plain/platform,high-altitude area of the plain/platform, hill, low-relief mountain, intermediate-relief mountain, high-relief mountain; and at the extremely high-altitude area of the low-relief mountain and intermediate-relief mountain. The terrain for improved and degraded areas was consistent. However, the area of vegetation improvement in this area was the largest from 2000 to 2005; the area of vegetation improvement was minor from 2010 to 2015.
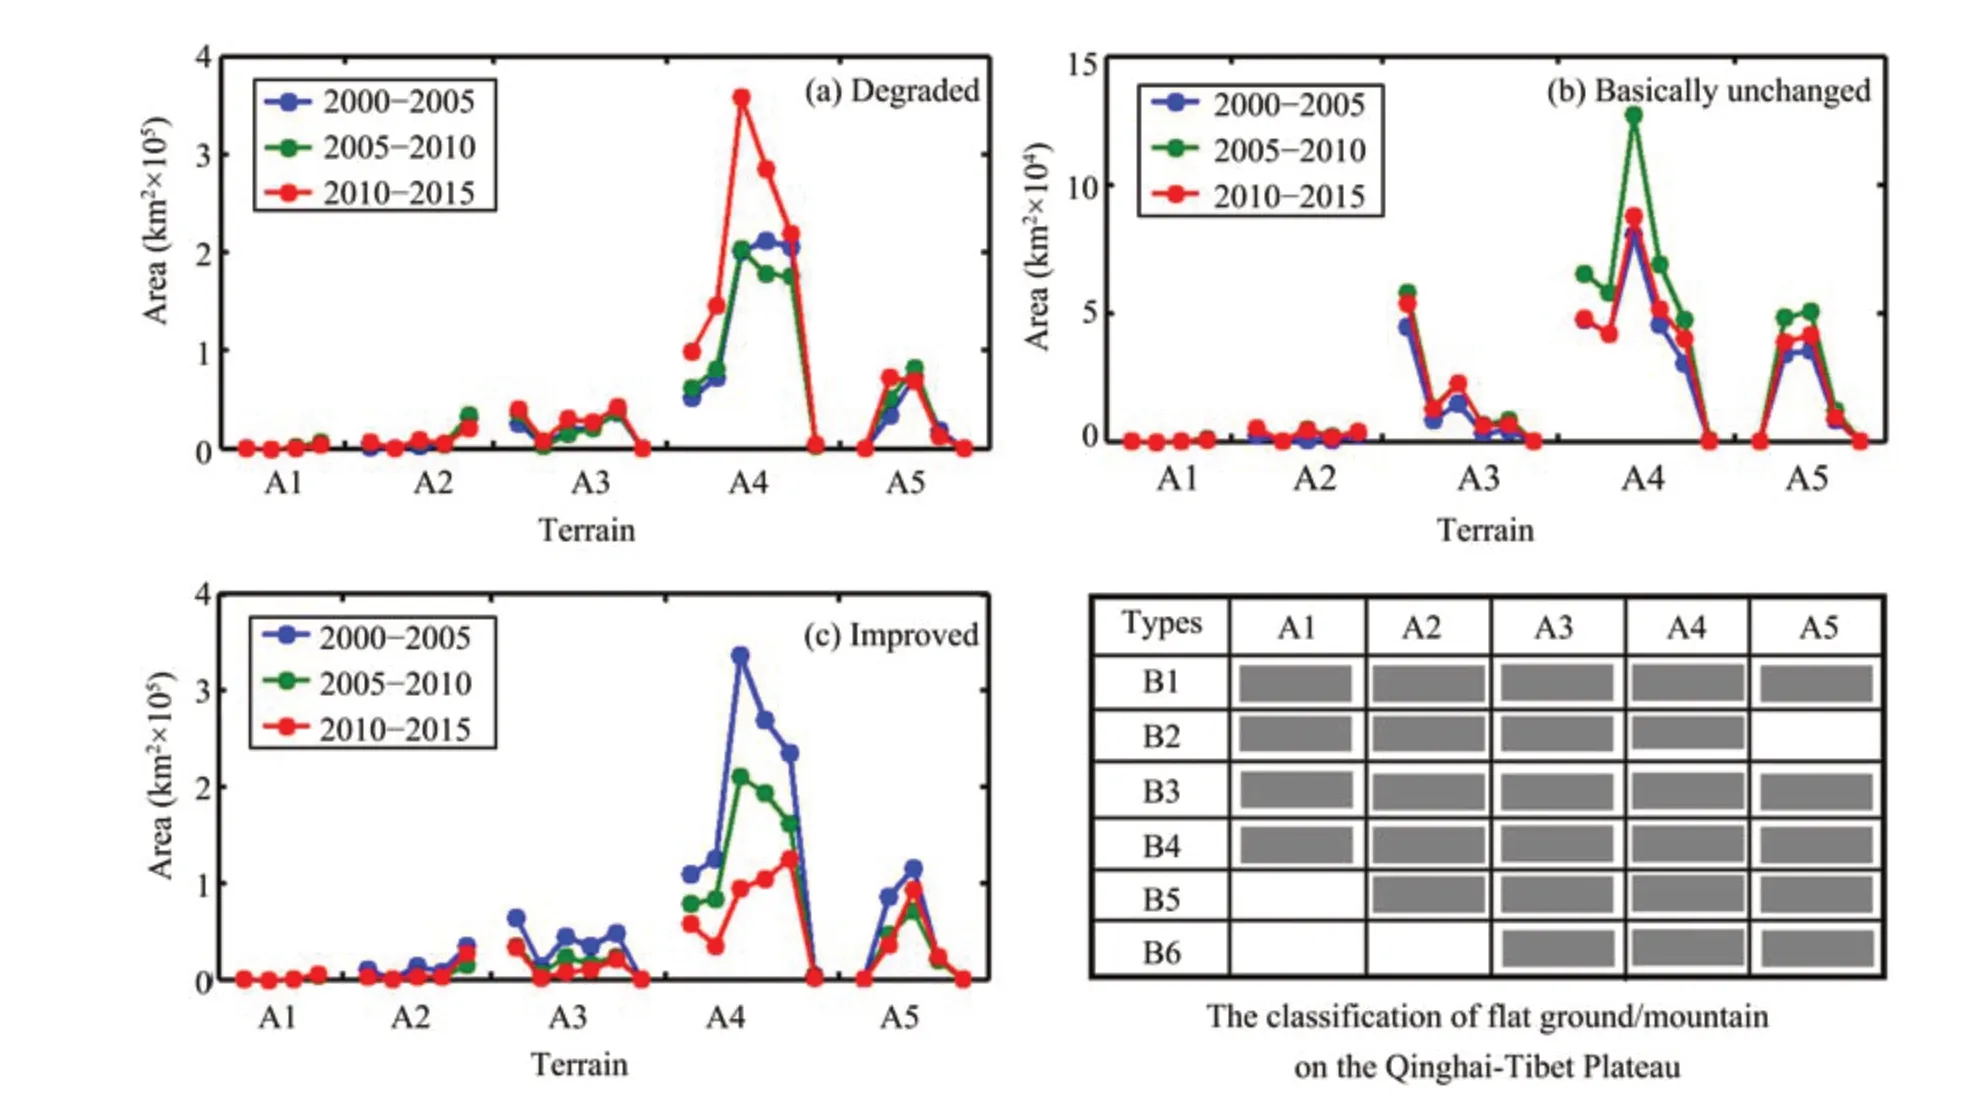
Figure 5 The change trend of NDVI in different types of mountainous areas(A1-A5 is low altitude,intermediate altitude,sub-high altitude,high altitude,and extremely high altitude;B1-B6 is plain/platform,hill,low-relief mountain,intermediate-relief mountain,high-relief mountain,and extremely high-relief mountain)
3.4 Response analysis of vegetation change to temperature and precipitation on the Qinghai-Tibet Plateau
We analyzed the relationships among monthly MODIS NDVI, average temperature and precipitation range from 2000 to 2015. The correlations among MODIS NDVI, temperature, and precipitation were 0.72 (P >0.01) (Figure 6) and 0.82 (P >0.01)(Figure 7), showing that temperature and precipitation have obvious impacts on vegetation growth.
From 2000 to 2015, on the Qinghai-Tibet Plateau, precipitation decreased at a rate of 0.3 mm/a;the temperature increased at a rate of 0.03 °C/a; and the overall trend of vegetation change improved.From 2000 to 2005, precipitation decreased at a rate of 1.04 mm/a; the temperature increased at a rate of 0.11 °C/a; and the overall trend of vegetation change improved. From 2005 to 2010, precipitation increased at a rate of 0.49 mm/a; the temperature increased at a rate of 0.07 °C/a; and the overall trend of vegetation remained virtually unchanged. From 2010 to 2015, precipitation decreased at a rate of 0.25 mm/a; the temperature decreased at a rate of 0.04 °C/a; and the overall trend of vegetation change worsened.In conclusion,through the analysis of vegetation change with precipitation and temperature, it was shown that precipitation and temperature have no significant effect on vegetation activity over a short period.
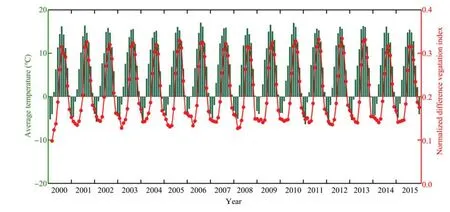
Figure 6 Time-series changes of NDVI and mean temperature on the Qinghai-Tibet Plateau
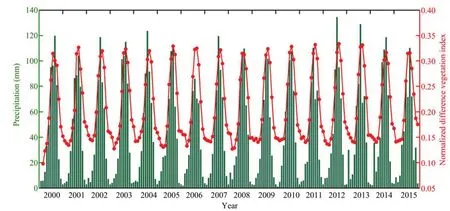
Figure 7 Time-series changes of NDVI and precipitation on the Qinghai-Tibet Plateau
3.5 Analysis of vegetation change and human activities on the Qinghai-Tibet Plateau
The capacity of grassland was analyzed by remote sensing and observation data during 2003-2004 and 2010 on the Qinghai-Tibet Plateau. The results showed that in the Qinghai Province and the Tibet Autonomous Region, the overload grazing is serious (Qian et al., 2007; Li et al., 2014). This paper is based on the long-term statistical data of the Qinghai Province and the Tibet Autonomous Region, analyzing the impact of human activities on vegetation changes. The analysis relied on statistics of population changes, the amount of livestock at the end of the year, the amount of sheep at the end of the year, and the total amount of cattle and sheep at the end of the year. By converting heavy livestock into sheep (heavy livestock conversion coefficient 5.0, sheep conversion coefficient 1.0) (Li et al., 2014), the analysis showed that the population of the Qinghai Province and the Tibet Autonomous Region had increased at a rate of 0.087 million people/a,and the sheep had increased at 1.002 million/a (Figure 8). Therefore, there was long-term overloading of the Qinghai-Tibet Plateau that was coupled with the rapid growth of population pressure on the environment, explaining the phenomenon of the mild improvement, mild degradation, and severe degradation of vegetation on the Qinghai-Tibet Plateau from 2000 to 2015.
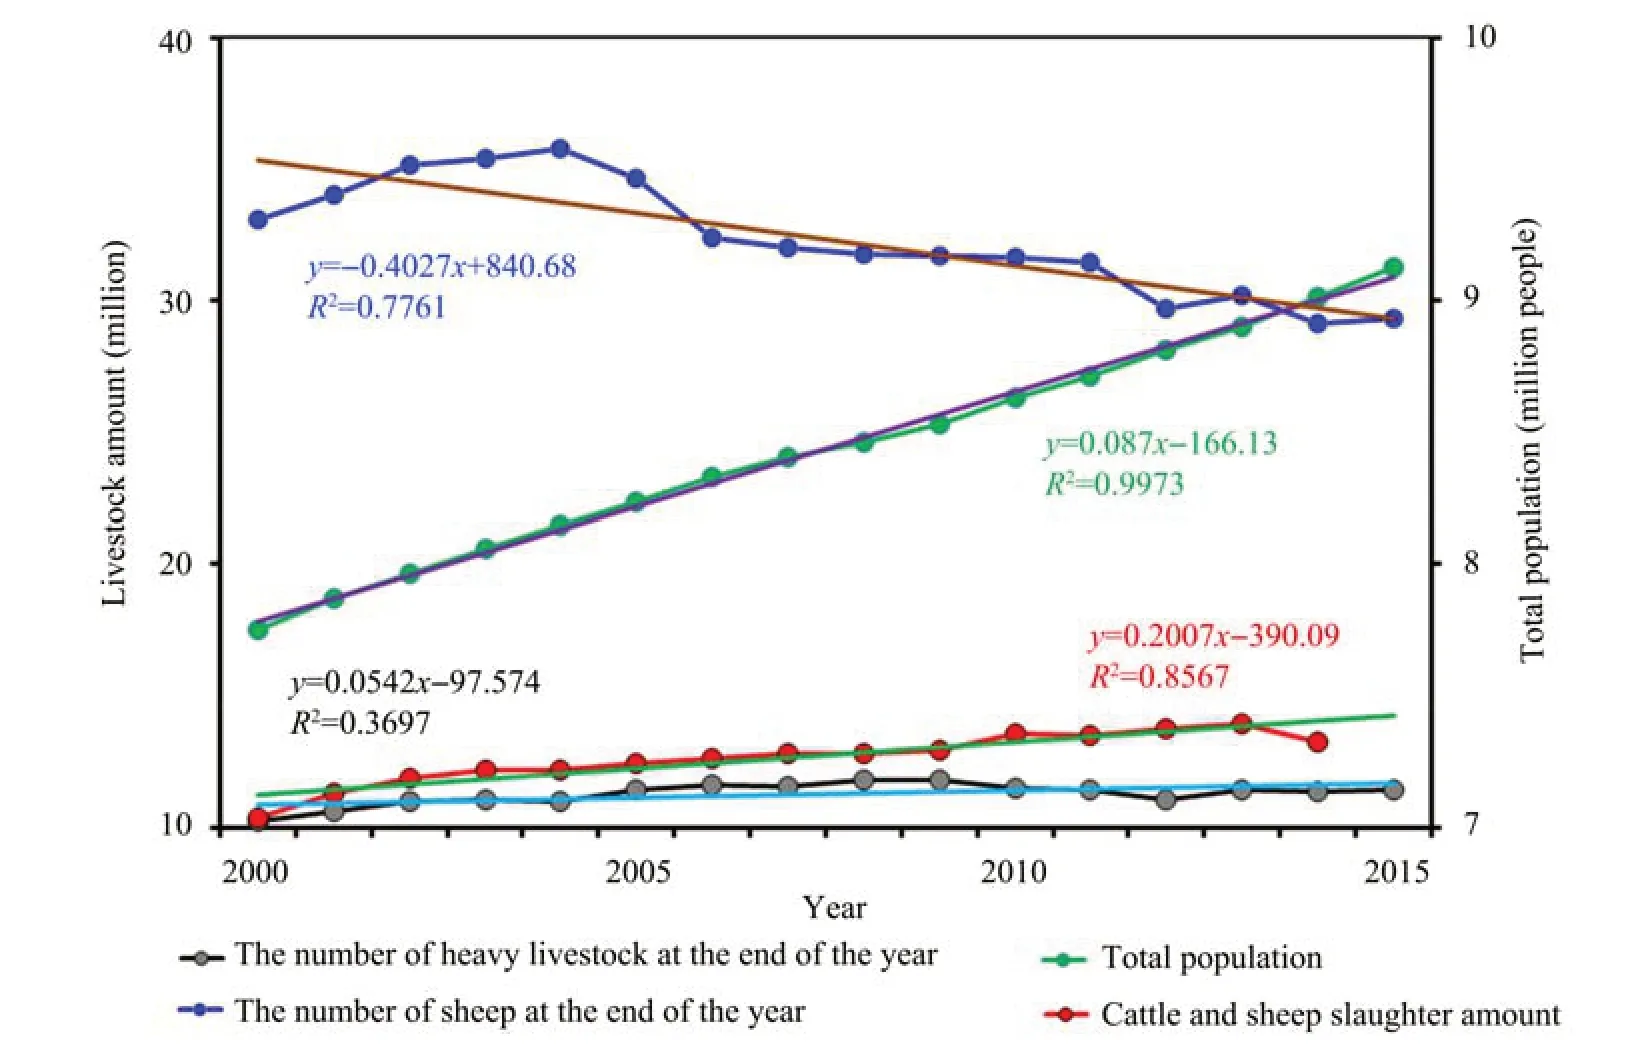
Figure 8 Time-series change of population and livestock in the Qinghai Province and the Tibet Autonomous Region
4 Conclusions
In this paper, the changes of vegetation activities are analyzed by MODIS NDVI remote-sensing data from 2000 to 2015 on the Qinghai-Tibet Plateau. The conclusions were drawn as follows:
(1) The vegetation showed different trends during different periods on the Qinghai-Tibetan Plateau. In general, the vegetation of the Qinghai-Tibet Plateau tended to improve from 2000 to 2015; and the improved area accounted for 39.93% of the area. In terms of stages,the vegetation types showed improvement from 2000 to 2005, especially the grassland.The vegetation types were stable from 2005 to 2010,and forests and grasslands were slightly degraded.Vegetation was generally degraded from 2010 to 2015, grassland and forests were seriously degraded,and the farmland and sparse vegetation were relatively weakly degraded.
(2) Through the analysis of mountain types and vegetation change trends, the vegetation degradation was shown to be concentrated in the high-altitude and extremely high-altitude areas on the Qinghai-Tibet Plateau. Vegetation remained virtually unchanged, as degradation was concentrated in the sub-high altitude,high altitude, and extremely high altitude. The terrain of the degraded area was consistent with the terrain of the vegetation-improved area,but the status of vegetation health in each area showed opposing trends.
(3) According to the relationship among vegetation NDVI and temperature and precipitation, temperature and precipitation showed an obvious response to vegetation growth. However, the change rate of precipitation and temperature was not related to vegetation degradation. Precipitation and temperature have no significant effect on vegetation degradation in the short period.
(4) From the perspective of vegetation degradation, population, and stocking capacity, the Qinghai-Tibet Plateau had long been overloaded, and coupled with the pressure on the environment caused by the dramatic population growth. Vegetation showed the phenomena of slight improvement, mild degradation,and severe degradation in different years on the Tibetan Plateau.
Acknowledgments:
This study was supported by the Strategic Priority Research Program of the Chinese Academy of Sciences,China (Grant No. XDA20100101), and the Foundation for Excellent Youth Scholars of Northwest Institute of Eco-environment and Resources,Chinese Academy of Sciences(Y651K91001).
 Sciences in Cold and Arid Regions2019年2期
- Sciences in Cold and Arid Regions的其它文章
- Effects of freeze-thaw cycle and dry-wet alternation on slope stability
- Shifts in community structure and function of ammoniaoxidizing archaea in biological soil crusts along a revegetation chronosequence in the Tengger Desert
- Holocene climatic change reconstructed from trace elements of an aeolian deposit in the southeastern Mu Us Desert,northern China
- The establishment and development of Haloxylon ammodendron promotes salt accumulation in surface soil of arid sandy land
- Editors-in-Chief Guodong Cheng and Ximing Cai
- Review on simulation of land-surface processes on the Tibetan Plateau