
Review on simulation of land-surface processes on the Tibetan Plateau
2019-05-09 07:33:30RuiChenMeiXueYangXueJiaWangGuoNingWan
Rui Chen ,MeiXue Yang ,XueJia Wang ,GuoNing Wan
1. State Key Laboratory of Cryospheric Science, Northwest Institute of Eco-Environment and Resources, Chinese Academy of Sciences,Lanzhou,Gansu 730000,China
2.University of Chinese Academy of Sciences,Beijing 100049,China
ABSTRACT The Tibetan Plateau(TP)has powerful dynamics and thermal effects,which makes the interaction between its land and atmosphere significantly affect climate and environment in the regional or global area. By retrospecting the latest research progress in the simulation of land-surface processes(LSPs)over the past 20 years,this study discusses both the simulation ability of land-surface models (LSMs) and the modification of parameterization schemes from two perspectives, the models' applicability and improved parameterization schemes. Our review suggests that different LSMs can well capture the spatiotemporal variations of the physical quantities of LSPs;but none of them can be fully applied to the plateau,meaning that all need to be revised according to the characteristics specific to the TP.Avoiding the unstable iterative computation and determining the freeze-thaw critical temperature according to the thermodynamic equilibrium equation,the unreasonable freeze-thaw parameterization scheme can be improved.Due to the complex underlying surface of the TP,no parameterization scheme of roughness length can well simulate the various characteristics of the turbulent flux over the TP at different temporal scales.The uniform soil thermodynamic and hydraulic parameterization scheme is unreasonable when it is applied to the plateau,as a result of the strong soil heterogeneity.There is little research on the snow-cover process so far,and the improved scheme has no advantage over the original one due to the lack of some related physical processes. The constant interaction among subprocesses of LSPs makes the improvement of a multiparameterization scheme yield better simulation results.According to the review of existing research,adding high-quality observation stations,developing a parameterization scheme suitable for the special LSPs of the TP,and adjusting the model structures can be helpful to the simulation of LSPs on the TP.
Keywords: Tibetan Plateau; land - atmosphere interaction; land-surface models; model applicability; parameterized modification
1 Introduction
The global land area accounts for about 30% in the earth's surface, but it is the most complicated and important component in the climate system.The exchange of momentum,energy,and matter with coupling characteristics occurs on wide spatiotemporal scales between land and atmosphere as a result of driving by atmospheric circulation and solar radiation (Sellers et al.,1997;Yang et al., 2007; Baker et al., 2017); and an accurate understanding of these processes allows more precise prediction and projection of global climate change (Koster et al., 2004; Chen et al., 2010; Gao et al., 2015; Ma and Zhou, 2017) because, first, the LSPs are one of the basic physical and biochemical processes that affect atmospheric circulation and climate change. The interactions between the land surface and other layers of the climate system at various spatiotemporal scales (as well as the exchanges and radiative transfer among momentum, energy, and material) may have great impact on the general circulation and climate conditions (Wood, 1991), which may even play a key role in a certain area or a certain period of time (Sun, 2005; Ma et al., 2013). Since the 1970s, researchers have validated the response of the climate system to land-surface features in terms of a series of numerical sensitivity tests, such as albedo(Charney, 1975; Charney et al., 1977), soil moisture(Shukla and Mintz, 1982; D'Odorico and Porporato,2004; Koster et al., 2004), surface roughness (Sud and Smith, 1985a, 1985b; Sud et al., 1988), land use and land cover (Xue and Shukla, 1993, 1996), canopy resistance (Dickinson et al., 1991), dynamic changes of soil conductivity (Peters-Lisard et al., 1998), and so on. Second, climate change can retroact these exchange processes, which will further affect the global terrestrial ecosystem and hydrological systems (Chase et al., 1996; Collatz et al., 2000; Zhou et al., 2001;Zhu et al.,2017).
As the land component of atmospheric general circulation models (AGCMs) and global climate models(GCMs), LSMs can not only quantitatively describe the energy at the land-atmosphere interface and the exchange processes of water vapor and momentum flux to provide the lower boundary conditions for the AGCMs and regional climate models (RCMs) (Van der Velde et al., 2009; Zheng et al., 2015a; Wang et al.,2016;Gao et al.,2017)but also are powerful tools for understanding land-atmosphere interaction and its variations (Dai et al., 2003; Wang et al., 2018). To predict and project global climate change reasonably and improve the simulation ability of AGCMs and GCMs, over the past few decades, LSMs have evolved from a bucket model, which was based on simple aerodynamic bulk-transfer formulae and uniform land-surface parameters, to a sophisticated model into which many physical and physiological processes in the atmosphere-snow-vegetation-soil-aquifer system have been incorporated (Sellers et al.,1997;Zheng et al.,2015c;Zhang et al.,2016).
With an average elevation more than 4,000 m a.s.l.and an area of approximately 2.5×10⁶km2, the TP(Figure 1) has the highest altitude and most complicated terrain on the globe and is endowed with titles of "The Third Pole" and "Roof of the World" (Qiu,2008; Immerzeel et al., 2010).Also, as an important source of water in Asia, the TP gives birth to several major Asian rivers (Yangtze, Yellow River, Mekong,Ganges, and so on), which makes it the "Asian Water Tower" (Xu et al., 2008a). Due to the powerful dynamic effects caused by the topography of the TP, together with the strong thermal effects caused by the direct heating of the central troposphere at the surface, the TP significantly affects the Asian monsoon,the Northern Hemisphere general circulation, and the climate and environment of East Asia and South Asia(Ye and Gao, 1979; Kang et al., 2010; Yao et al.,2012, 2015; Yang et al., 2014; Wu et al., 2015; Ma and Zhou, 2017). The unique geographical location and altitude endue special characteristics to LSPs of the TP, including (1) diurnal variation of the surfaceenergy budget due to strong solar radiation and low air density, (2) seasonal variations of the energy and water cycle in the central and eastern TP, (3) significant differences in land-atmosphere interaction between the dry western plateau and the wet eastern plateau (Yang et al., 2007, 2009; Li et al., 2015); and these exceptive LSPs are sensitive to global climate change (Yao et al., 2015). Therefore, the rational description and accurate simulation of the land-atmosphere interaction on the TP are of great significance to the enhancement of the climate model's ability to simulate the climate in East Asia and even that of the earth.
This paper discusses the simulation of LSPs on the TP over the past 20 years from the LSMs' adaptability tests and parameterization-scheme improvements,hoping to deepen the understanding of simulation ability of LSMs and provide the basis for further improving the parameterization scheme of LSMs.Section 2 is the simulation results in different TP areas. Section 3 summarizes the improvement of parameterization scheme owing to special LSPs on the TP, while the conclusions and discussion are listed in section 4.
2 Model applicability
The research on model applicability is mainly to compare the simulated with the observed to test the simulation ability of LSMs. Chinese and foreign scientists have carried out many large LSPs observational experiments on the TP since 1979 in order to obtain high-resolution, long time-series measured data and better comprehend land-atmosphere interaction in alpine regions(Table 1).The exchange processes of momentum, energy, and water are constantly occurring between land and atmosphere (Dickinson et al., 1991;Dickinson, 1995); and the forms of expression of these processes can be used as physical quantities to evaluate the results of the model simulation. Consequently, soil temperature (ST), soil moisture (SM), radiation, and energy flux are selected to illustrate the model's applicability to the TP.
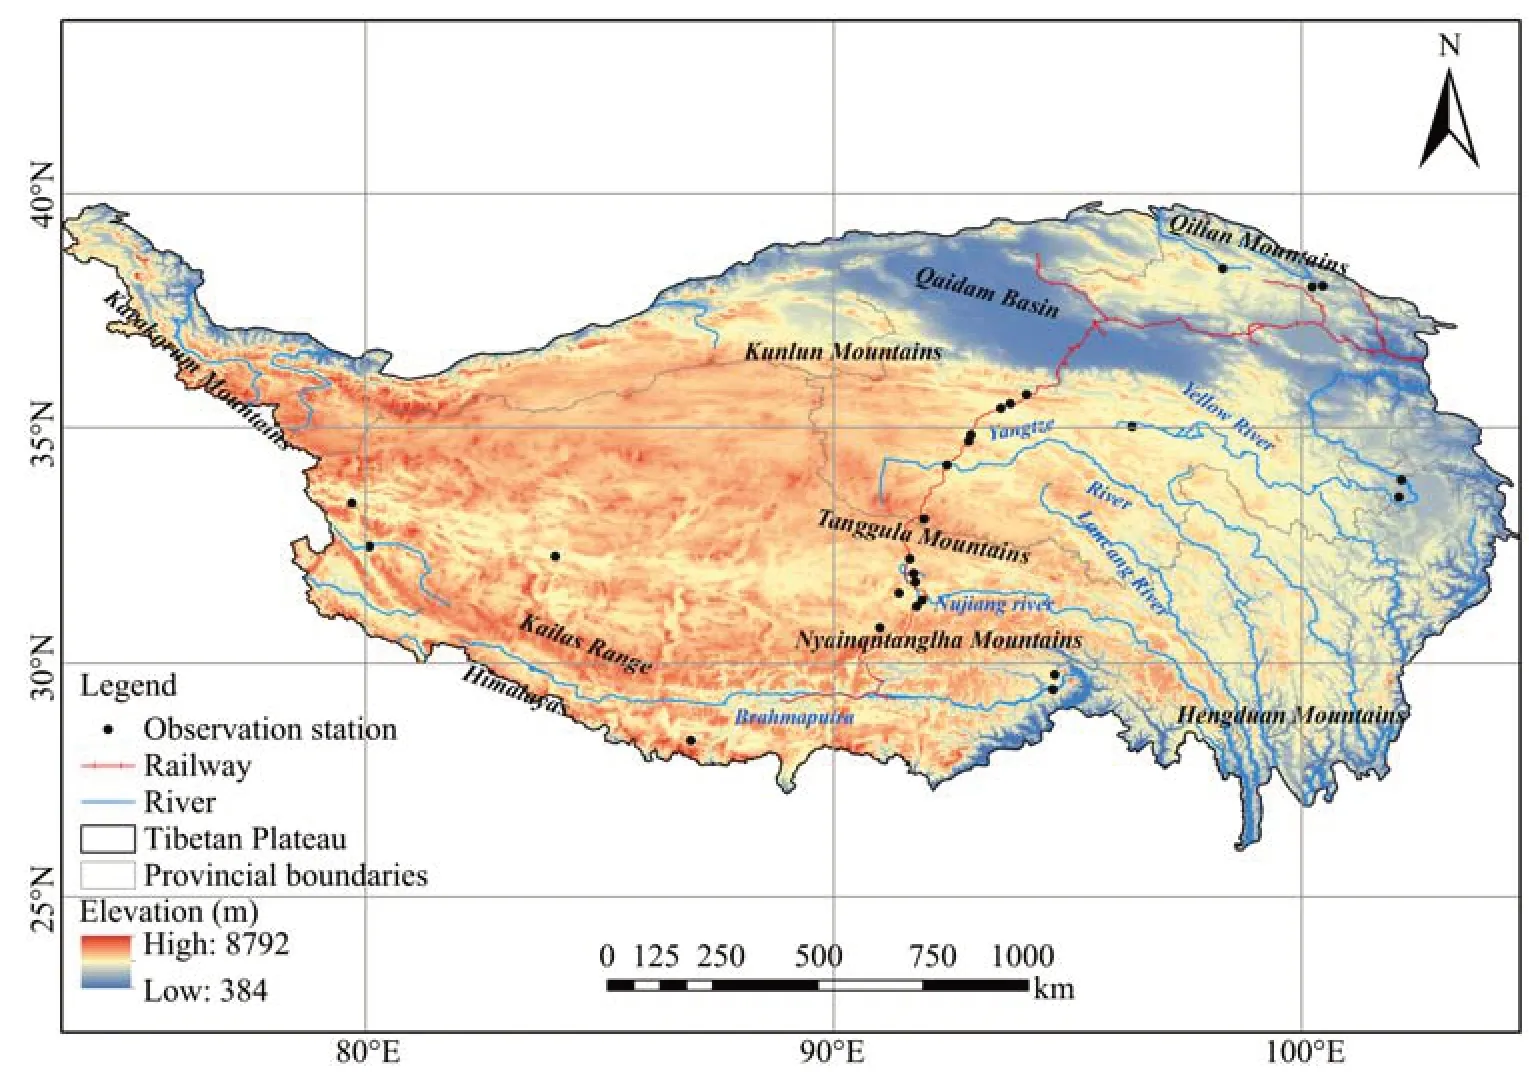
Figure 1 Location of study area
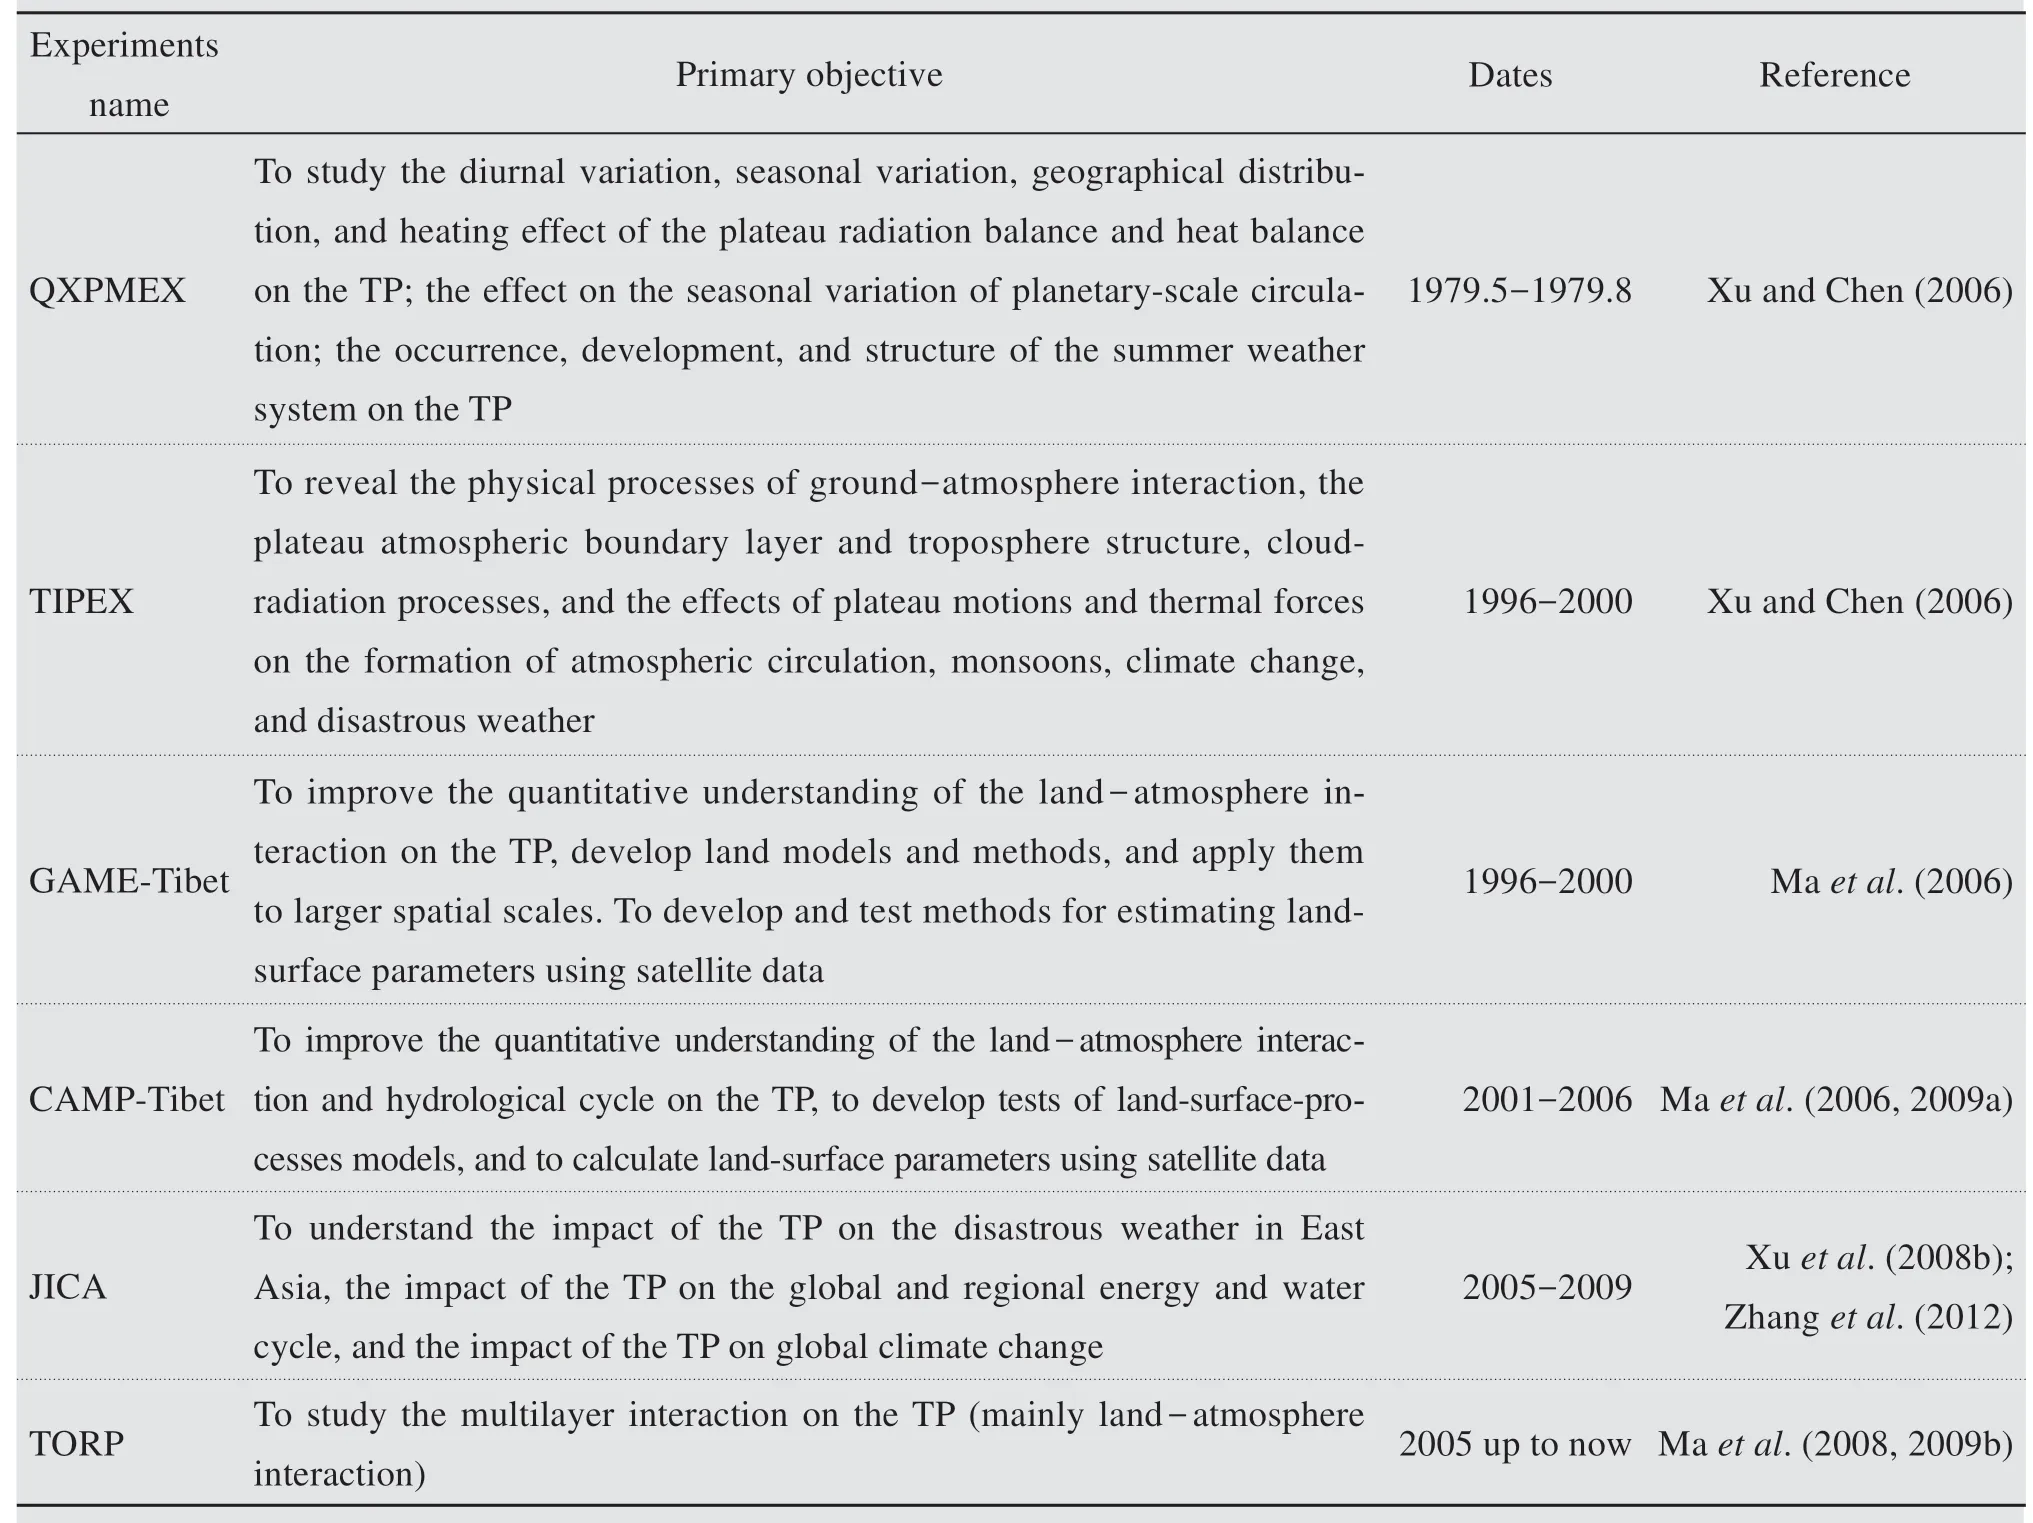
Table 1 Major land-surface-processes experiments of the TP
2.1 Soil temperature
Quantitative description of ground thermal processes, soil-heat conduction and its transport process,is the main task of the parameterization scheme in LSMs (Ye et al., 1991). The heat exchange of the near-surface layer mainly depends on net radiation,the turbulent diffusion coefficient, and soil thermodynamic properties. The most important index is soil thermodynamics properties, which determine the heat flux transferred from the surface to deep soil and the amount of heat stored in the soil. ST is a considerable factor to reflect the soil thermodynamics properties(Li et al., 2013). Different models have been able to capture the variation of ST at different spatiotemporal scales. However, because of the incomplete parameterization scheme, LSMs may under- and overestimate ST at different spatiotemporal scales. Soil-heat transfer is assumed to obey the following thermal diffusion equation:
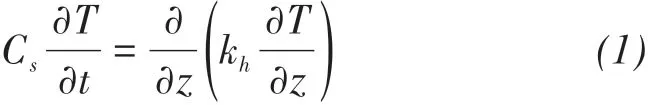
where Csis soil thermal heat capacity(J/(m3·K)),khis thermal conductivity (W/(m·K)), and z is the soil depth.
The simulation performance of the Noah model was verified by using the observed data from Maduo and Maqu (2009.11-2010.12) (Zheng et al., 2016a)and showed that the Noah model significantly underestimated the topsoil ST (5 cm, 25 cm). Three modified parameterization schemes— (1) turbulent heat fluxes and soil-heat transport, (2) soil-water flow, and(3) frozen-ground processes—were designed to explore why the Noah model could underestimate topsoil ST. Comparative simulation results showed that the Noah model overestimates latent heat flux (LE),resulting in a significant underestimation of ST. Different LSMs (CLM, CoupModel, CoLM) had a consistent conclusion in simulating the seasonal variations of ST in different regions on the TP; that is, the simulated ST in summer was better than that in winter, with the simulated ST in summer greater and that in winter the contrary.After analyzing the parameterization schemes of each model, it was found that the causes of this phenomenon were that the parameterized scheme with regard to the soil freeze-thaw process was imperfect and that the simulated soil thermal conductivity was too large. Excessive soil thermal conductivity enabled heat transfer to deeper soil layers, resulting in the aforementioned deviations. In addition, models simulated more soil-ice content during the freezing period, which resulted in further amplifying soil thermal conductivity (Luo et al.,2009a,2017;Chen et al.,2014;Liu et al.,2016).
On the diurnal scale, the simulation results of the CoLM model during the freezing period showed that the topsoil ST at night was underestimated, while the daytime ST was overestimated (Luo et al.,2009a).The simulation performance of diurnal variations of ST at BJ station (SiB2 model) also showed that daytime ST was warmer and nighttime colder (Gao et al., 2004).Zheng et al. (2017) utilized the Noah model to simulate ST during the freezing period, but the conclusion was contrary to that of CoLM. The original model overestimated sensible heat (H) and LE, and underestimated ST during the day.As the result,the variation of ST on the diurnal scale was mainly influenced by solar radiation; the reason why different models under- and overestimated ST on the diurnal scale lay in the error of simulation of radiation,energy,and soil-heat flux.
In addition to temporal scale simulation, many researchers also have simulated on the spatial scale. In short, the results of most LSMs showed that topsoil soil was better than deep soil (Guo and Yang, 2010;Xiao et al., 2013; Wang et al., 2015; Pan et al., 2017).From the perspective of model stratification(taking the CLM4.5 model as an example),the model stratifies the topsoil more finely because of its large variation in physical quantities (with seven layers of soil located in the soil layer within 1 m of the surface), which made simulation of the topsoil physical quantities more accurate than that of deeper layers and disclosed cumulative effects of the simulated error with the increase in soil depth.From the perspective of the properties of the underlying surface, different soil textures and groundwater table depths have significant influence on soil temperature (Chen et al., 2019). Generally speaking, the ST simulated by different models are as follows:on the seasonal scale,the simulated ST in summer is more accurate than that in winter.The ST is over-and underestimated due to the error in the simulated radiation,energy, and soil-heat flux on the diurnal scale. On the spatial scale,the simulation results of topsoil ST are better than that of deep soil.
2.2 Soil moisture
As an important physical quantity of land-surface processes and climate system, SM can control various surface fluxes;regulate surface runoff and water migration in the soil, and the impact of plant transpiration,carbon assimilation, and the soil freeze-thaw process by changing the albedo, soil hydraulic and thermodynamic properties, plant growth, and infiltration capacity of the soil, so as to influence the water circulation between the land and atmosphere, thereby influencing the atmospheric circulation and the climate change(Entin et al., 2000; Seneviratne et al., 2010; Yang et al.,2013;Bi et al., 2016).The soil-water flow is simulated through application of the diffusivity form of the Richards equation,which can be formulated as follows:
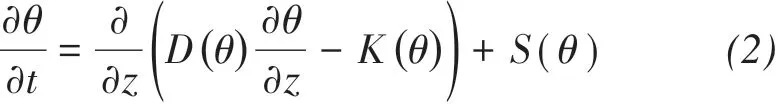
where θ is soil-moisture content (m3/m3), K is hydraulic conductivity (m/s), D is soil-water diffusivity(m2/s),S is representative for sinks and sources(i.e.,rainfall, dew, evaporation, and transpiration) (m3/(m3·s)),and t represents the time(s).
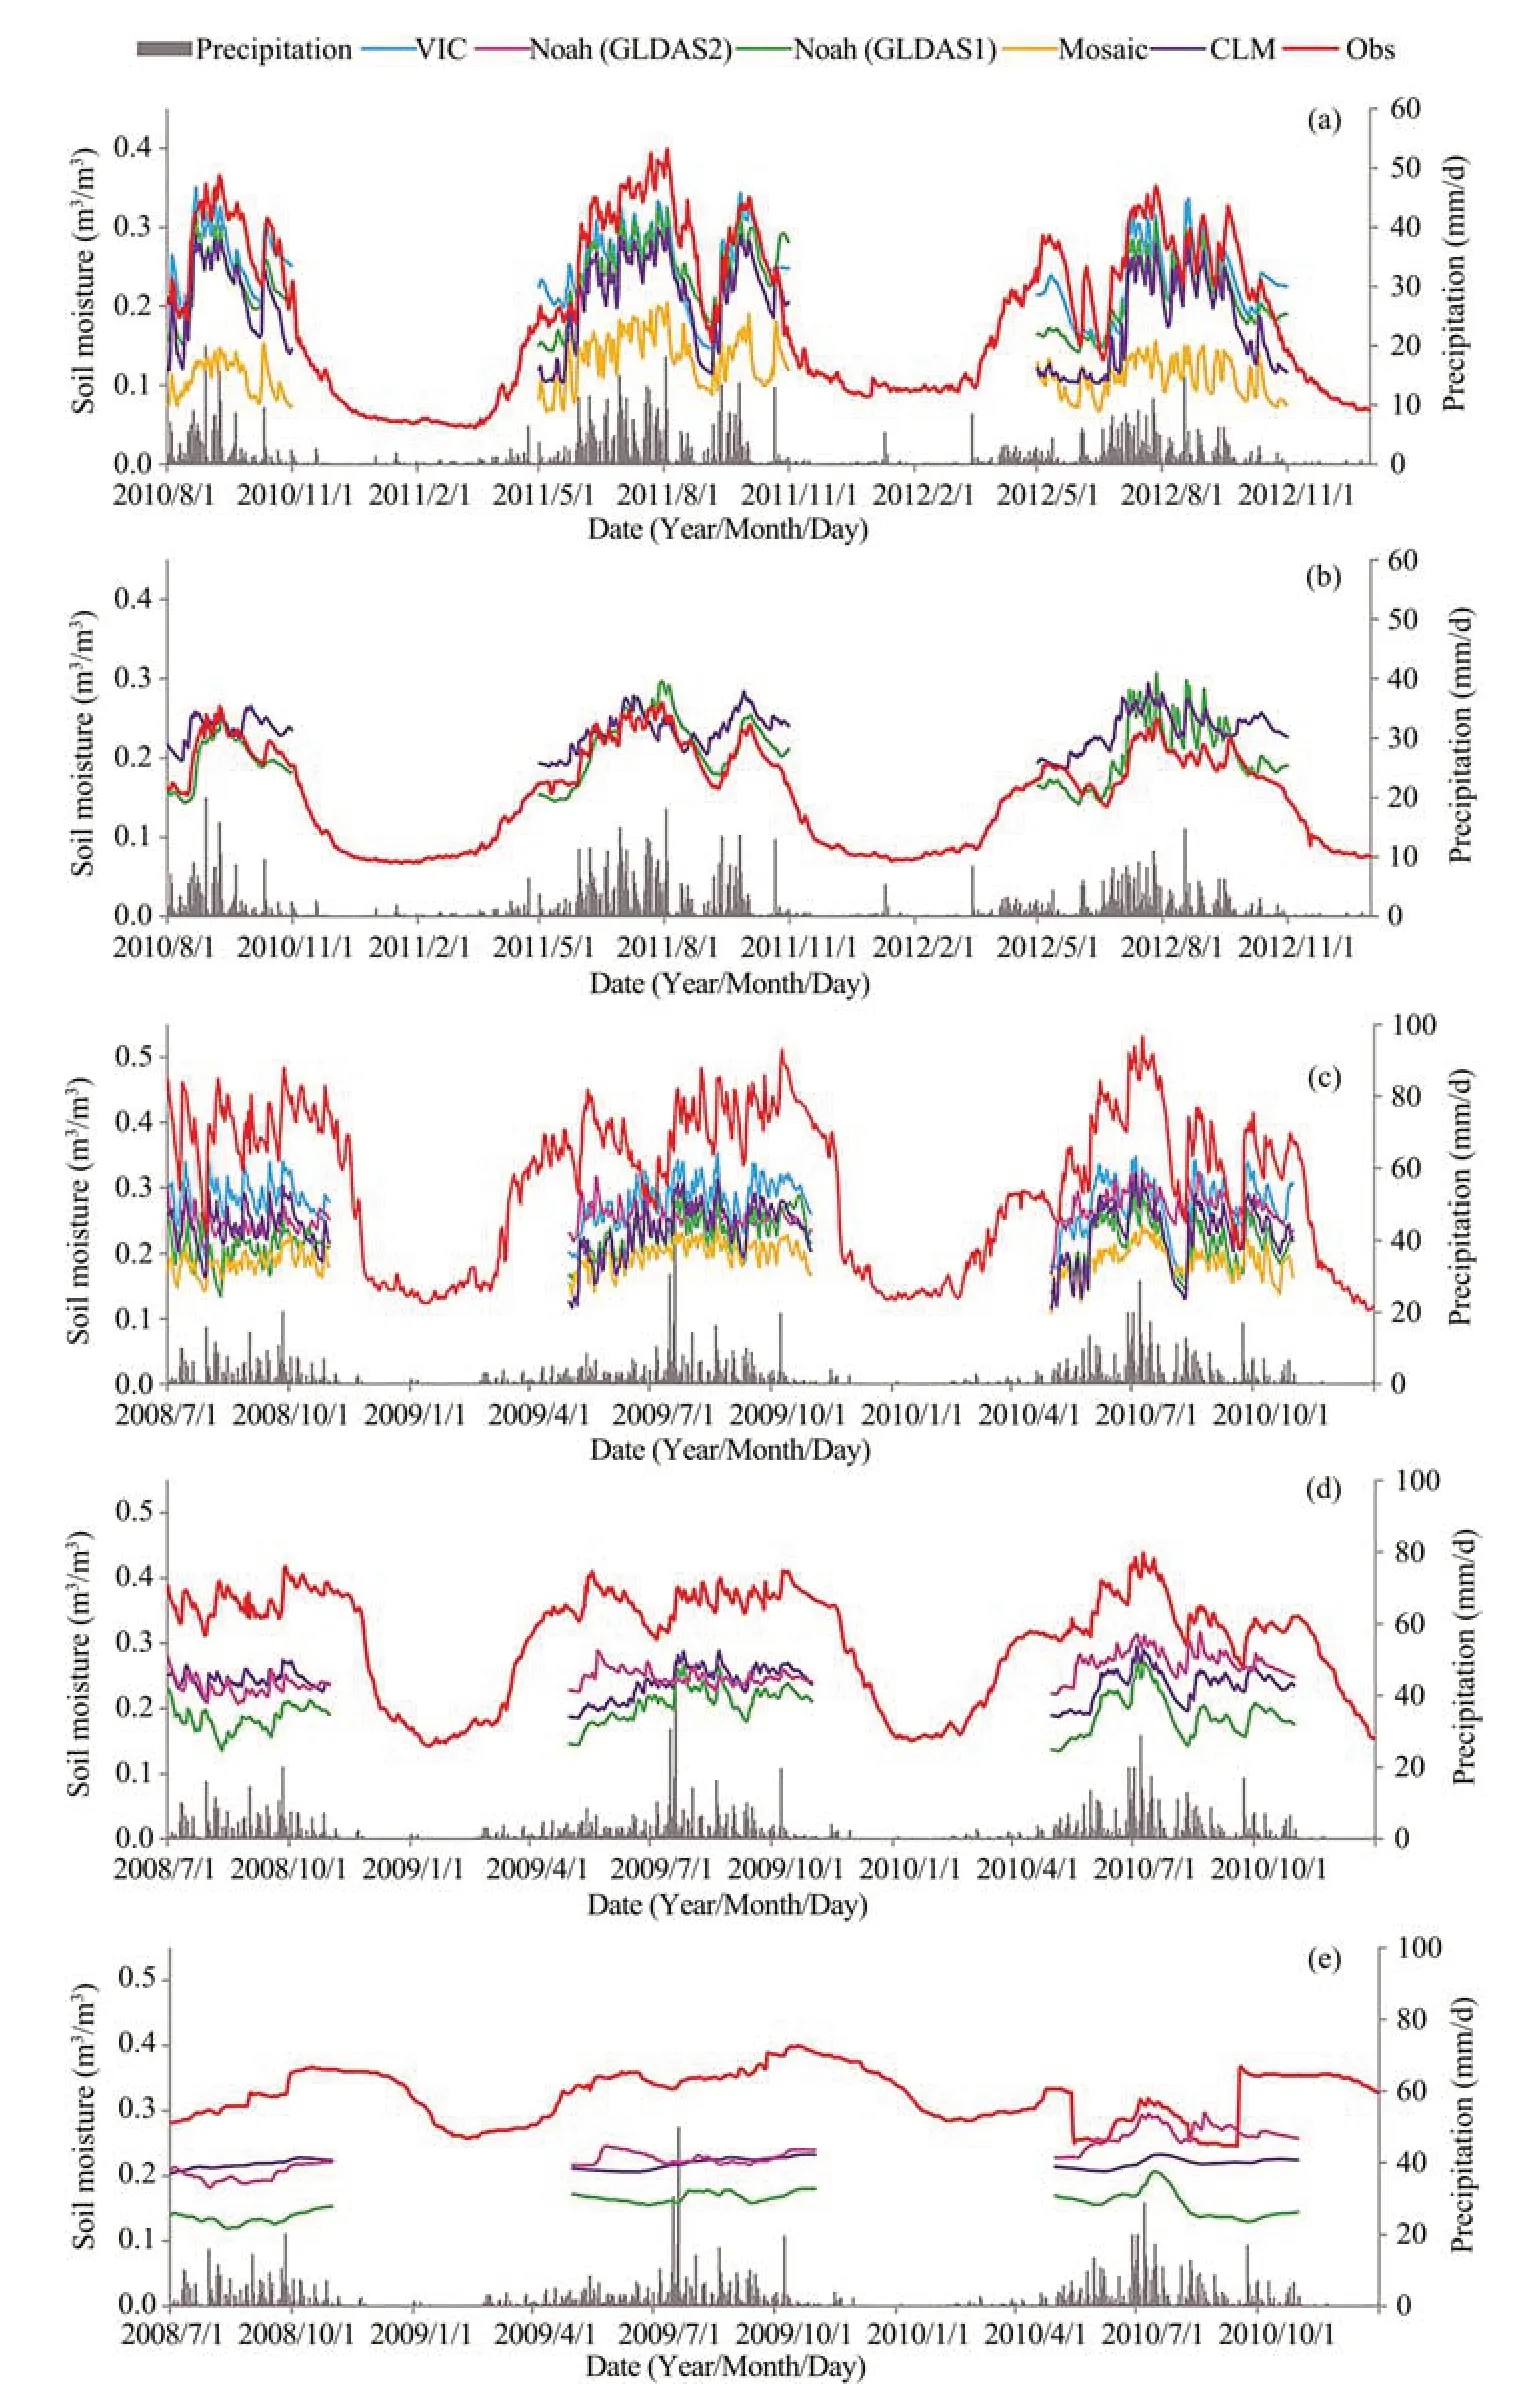
Figure 2 Comparison of simulated soil moisture of four LSMs in GLDAS with the in situ soil moisture from two observation networks at different soil layers:(a)first layer and(b)second layer in the Nagqu network region;(c)first layer,(b)second layer,and(c)third layer in the Maqu network region(Bi et al.,2016)
Because the soil-ice content cannot be observed,the measured SM is actually the soil-liquid-water content. Figure 2 shows simulation results of Nagqu and Maqu observational networks by the four models of GLDAS-1 and GLDAS-2 could represent the temporal variation of SM, but all models systematically underestimated the surface SM. The reason for this deviation depended on the soil's vertical heterogeneity (Chen et al., 2013b) and the mismatch spatially between simulated and observed (Bi et al.,2016). Compared with ST, the simulation results of different LSMs for SM were worse and more complicated on different spatiotemporal scales. Overall,most LSMs significantly underestimated or even failed to simulate SM during the freezing period(Xia et al., 2011; Xiao et al., 2013; Zheng et al.,2016a). This error was because most LSMs (e.g.,CoLM, CLM3, BASE) consider that when the ST is less than 0 °C, there is no liquid water in the soil,and all the liquid water is converted to ice.Nevertheless, liquid water still exists when the ST is below the freezing point, owing to the impact of salinity.Another part of LSMs assumes that a fixed temperature range below 0 °C is the soil freeze-thaw critical temperature,but there is no freeze-thaw critical temperature in the real freeze-thaw process which is a continuous slow-change procedure (Li et al., 2010).That is to say, the unreasonable freeze-thaw process,parameterization scheme brings about the simulated deviation in winter.With the endless refinement of the freeze-thaw process parameterization scheme (e.g.,CLM4.5 improved the simulated SM (Swenson et al., 2012a) by modifying the dry deviation of permafrost and improving the parameterization scheme of the hydraulic properties of permafrost), the simulation performance of LSMs for ST during the freezing period was significantly improved.The error of stateof-the-art LSMs for SM mainly comes from the rainy season on the plateau. Most rainfall events on the TP frequently occurred in summer (June to September) (You et al., 2015), with a strongly spatially heterogeneous distribution and precipitation frequency (Yang et al., 2007a); and surface evaporation is the main source of water vapor (Yang et al., 2007b).A large amount of gravel, soil organic matter and root system in the surface soil can change the soil hydraulic conductivity. The mechanism of runoff in most LSMs was imperfect, models cannot reflect soil-water lateral movement and interaction between river and groundwater. The simulated runoff is no longer involved in the subsequent vertical water-balance calculation (Gao et al., 2015; Zhan et al.,2018). Recent work has suggested that soil-water lateral movement might be critical for high-resolution simulations(e.g.,1 km or finer)(Ji et al.,2017;Yuan et al., 2018). Hence, the simulation results of LSMs cannot capture the change of soil surface-water content caused by frequent precipitation, evaporation,and runoff, and therefore underestimate the surface SM and overestimate the deep SM (Zheng et al.,2015b;Bi et al.,2016;Sun et al.,2016a).
2.3 Radiation flux
Net radiation (hereinafter referred to as Rn) was derived from the four components of the radiation budget: upward and downward components of shortand long-wave radiation (USR, ULR, DSR, DLR).The two downward components were given as forcing data(Gao et al.,2004).

The simulated Rnin summer was close to the observed.The influence of snowfall on USR was underestimated by the models, resulting in the overestimation of Rn(Luo et al., 2009a; Xiao et al., 2013). The simulation results of the radiation flux of the NMQ station in the Nagqu area for about one and a half years showed that the CLM3.5 model underestimated USR while overestimating ULR and Rn(Wang et al., 2015).For diurnal variations of radiation flux, the CoLM model underestimated ULR during the day and overestimated it at night (Luo et al., 2009a). The Noah-MP model overestimated Rnduring the summer day but underestimated it during the summer night (Gao et al., 2015).According to Formula (3), the simulated Rnwas affected by the ULR and USR, while the ULR and USR were restricted by soil-surface temperature and albedo.
2.4 Energy flux
LE and H can be produced when the temperature of the local surface and the atmospheric surface layer is unbalanced.LE and H represent the degree of water and heat exchange between the atmosphere and the land surface. In addition, the atmospheric surface layer heated by nonadiabatic heating plays a decisive role in the heat balance of the land-atmosphere system and has an important influence on the regional and even larger atmospheric circulation and climate change (Krakauer et al., 2013; Wu et al., 2016). The LE and H are simulated by LSMs, to a great extent,restrict the simulation results of AGCMs and RCMs.TP is the initiator and amplifier of global climate change(Pan and Li,1996),and the simulation of its H and LE is even more important. H calculated is defined as:

where ρ is the air density (kg/m3), cpis the specific heat capacity of moist air (1,005 kJ/(kg·K)), Chis the surface-exchange coefficient for heat, u is the wind speed (m/s), θairis the potential air temperature (K),and Tskinis surface temperature (K). The surface-exchange coefficient for heat is obtained through application of the Monin - Obukhov similarity theory,which is the ratio of the momentum roughness length and heat transfer roughness length. The calculation of actual LE should be the sum of three components: (1)soil evaporation,(2)evaporation of precipitation intercepted by the canopy, and (3) transpiration through the stomata of the vegetation.The detailed parameterization scheme of these three parts can be found in Van del Velde et al.(2009).
Using observed data from four stations on the TP(alpine meadow: Amdo and MS3478; alpine desert:Shiquanhe and Gerze) to validate the simulation capability (diurnal scale) of three popular LSMs (SiB2,CoLM,and Noah),the results in Figure 3 demonstrate that the three models could capture the variation characteristics of LE and H; but the error is large; and the simulated deviation of LE and H during the day is greater than at night (Yang et al., 2009). The simulation results of the Noah LSM, Noah-MP, and CLM models at Naqu, Maqu, and Gerze stations were consistent with the above (Van der Velde et al., 2009;Zeng et al., 2012; Zheng et al., 2014, 2015a, 2015c).The simulation of energy flux over a long temporal scale showed that the simulation of energy flux in different regions of the plateau by different models could be over- and underestimated (Van der Velde et al.,2009;Chen et al.,2013a;Li et al.,2015);the irrational parameterization scheme of stomatal resistance,physiological plant processes (optimum growth and inhibition temperatures, etc.), and drag coefficient were major causes for deviation. The simulation results of SiB2 and Noah LSM for the energy flux at the BJ station on the central TP showed that the two models overestimated H, and the simulated soil evaporation was quite different.After comparing the parameterization schemes of the two models, it was determined that the deviation between the simulated and observed values was mainly due to the differences in the parameterization schemes of soil evaporation,roughness length, and aerodynamics conductance between the two models (Hong and Kim, 2010). First and last, although different models could capture the diurnal and seasonal variations of energy flux, the simulation deviation was relatively large. By analyzing the parameterization scheme of LE and H, it was determined that the main factors affecting the simulation results of LE and H were the parameterization scheme of roughness length, evaporation, and physiological plant processes.
Different scholars compared the ability of different land-surface models to simulate land-surface processes on the TP(Peylin et al., 1997; Takayabu et al.,2001; Yang et al., 2007, 2009; Chen et al., 2013b; Bi et al., 2016). Liu et al. (2019) simulated snow depth,near-surface temperature, and snow-water equivalent by using the WRF model coupled with different landsurface models. The results indicated that none of them can be fully applied to the TP, and all models need to be improved according to the characteristics of LSPs on the TP. In addition to simulation errors created by parameterization schemes and model structures, errors could also come from atmospheric forcing data and observation(Gao et al.,2015,2017;Bi et al.,2016;Zhang et al.,2016).
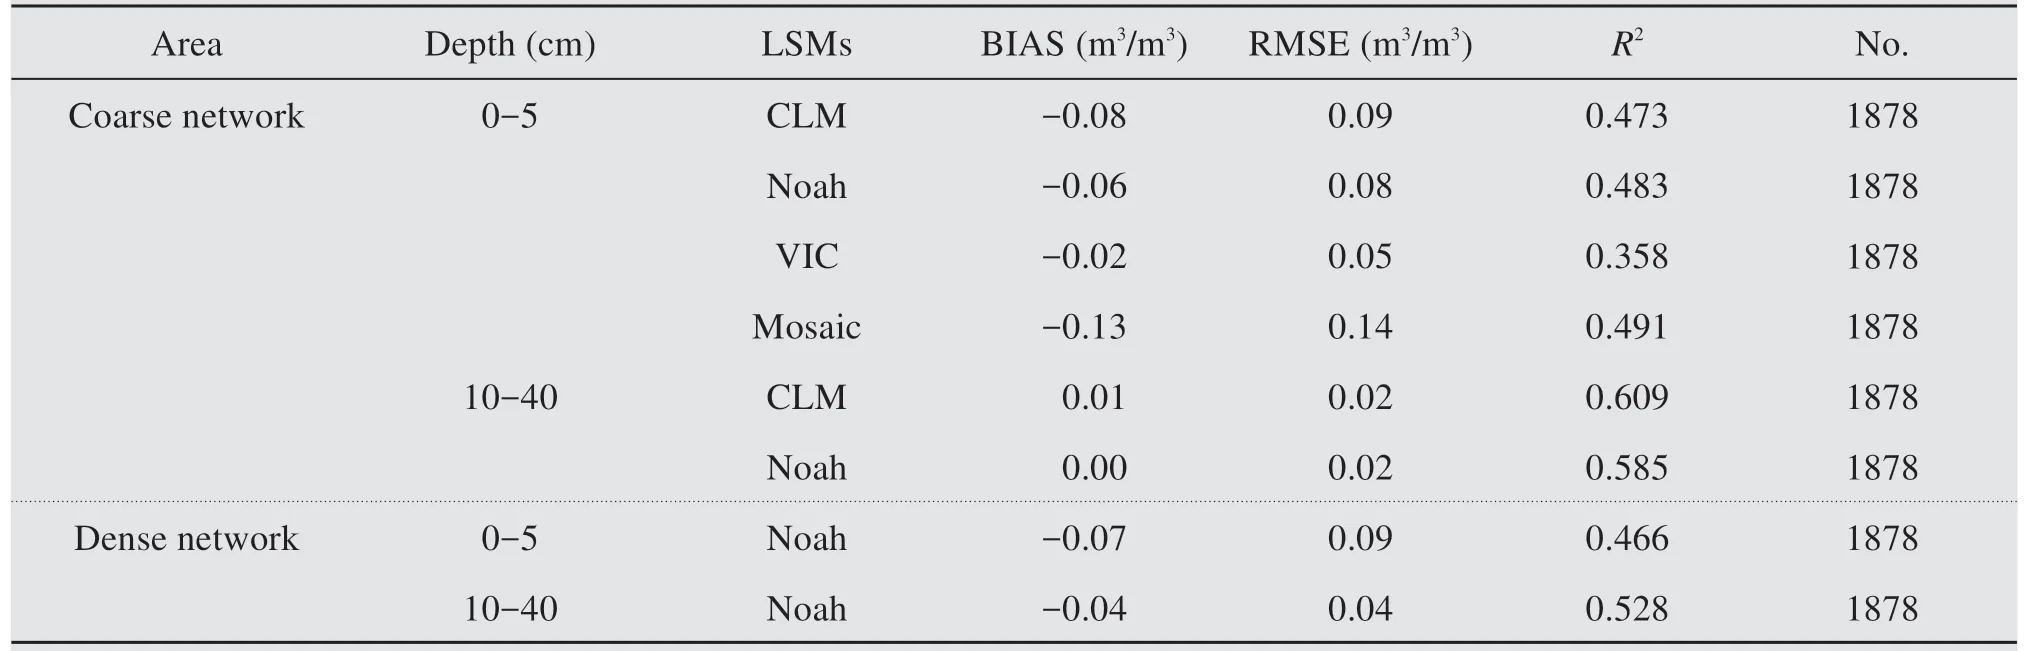
Table 2 Error statistic of GLDAS simulated soil moisture during the unfrozen season for the Nagqu network(Chen et al.,2013b)
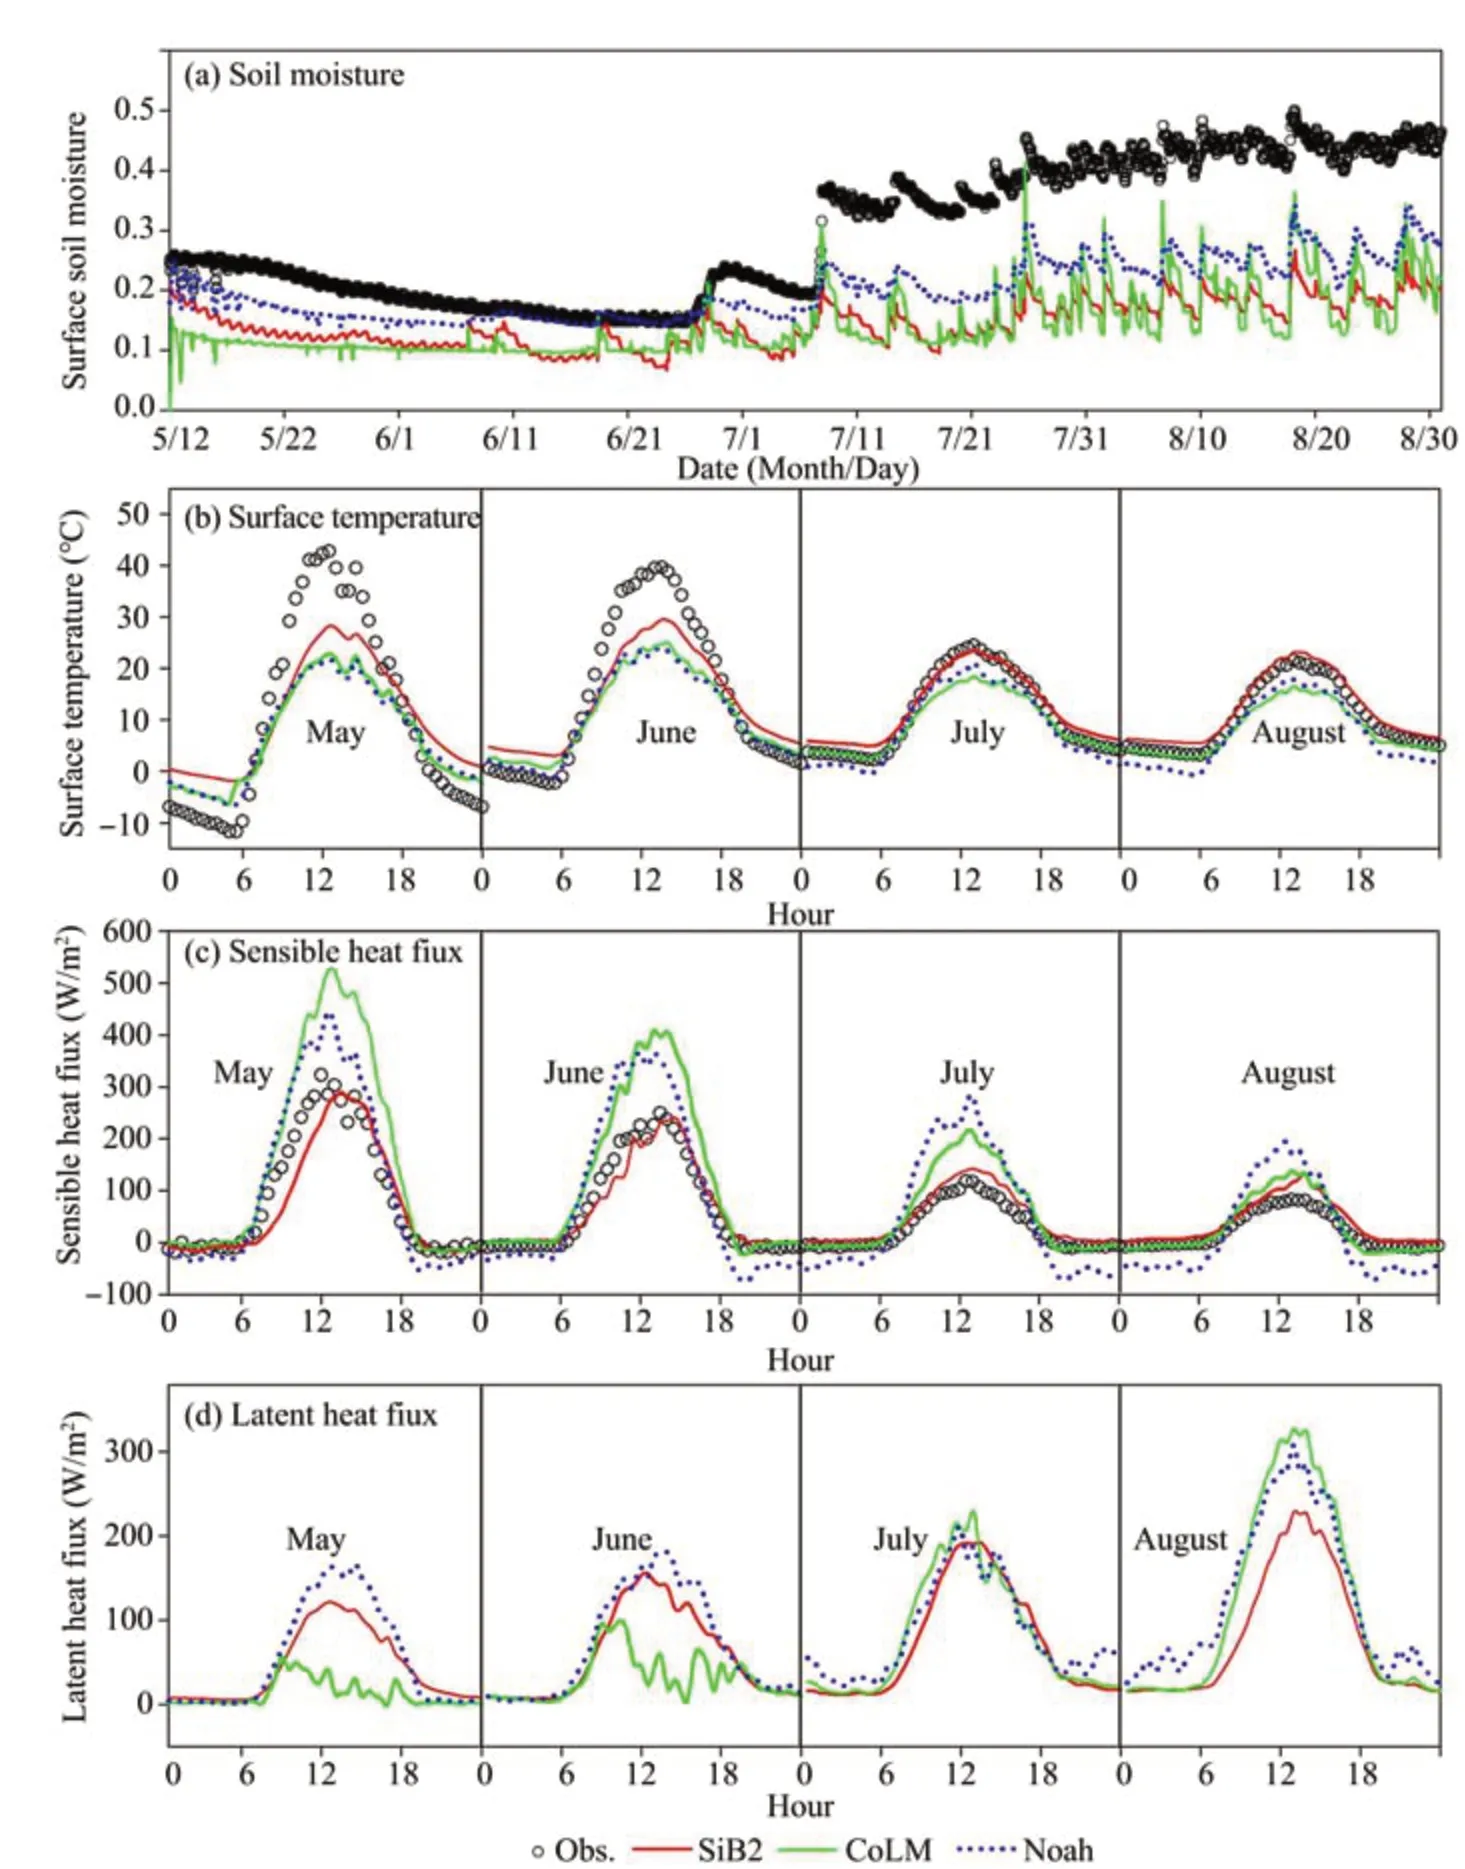
Figure 3 Simulated hourly near-surface soil moisture,monthly mean diurnal variations of surface-skin temperature,sensible-heat flux,and latent-heat flux at Amdo,1998(Yang et al.,2009)
3 Improvement of the parameterization scheme
Another major research purpose in the LSPs simulation of the TP is improvement of the parameterization scheme. In the LSMs, the LSPs parameters will have a crucial effect on the simulation results of the model.Using the same forcing data to drive the models with different parameterization schemes may produce different results. The rationality of the LSMs' parameterization scheme will directly affect the accuracy of the models'output. According to section 2, whatever the kind of LSM, more or fewer errors emerge. Therefore, to improve understanding of the parameterization schemes,this section reviews four aspects of improving them:the freeze-thaw process,roughness length,soil thermal and hydraulic conductivity,and snow cover.
3.1 Parameterization scheme of the freeze-thaw process
As a kind of special soil, frozen soil with special and complex physical processes can significantly affect the energy and water cycle in cold regions. Under the influence of different thermodynamic and dynamic properties of ice and water,the freezing/thawing cycles of the soil have effects on the distribution and migration of energy and moisture on the earth's surface and in the soil.Permafrost in China is mainly distributed on the TP, the western mountainous areas, and the northern part of northeast China,with an area of about 1.72×10⁶km2. The high-altitude permafrost of the TP is the main body of China's permafrost (1.06×10⁶km2) (Li et al.,2008;Zou et al.,2017);and due to the special geographical location of the TP, the permafrost developed is very different from that of the high latitudes and is more sensitive to climate change. Therefore, the improvement of the parametric scheme of the soil freezethaw process on the TP has always been the focus of LSMs research. The parameters of permafrost processes used in LSMs can be divided into four categories:(1)It is believed that the freeze-thaw of soil occurs only at 0 °C. (2) It is assumed that the freeze-thaw process occurs in a fixed temperature range below the freezing point. (3) The empirical relationship between soil-liquid-water content and temperature is used to determine the soil-liquid-water content. (4) Soil matric potential is utilized to calculate maximum liquid-water content when soil temperature is below the freezing point (Li and Koike, 2003; Li and Sun, 2006; Wang et al., 2015). The parameterization schemes of the first and second categories obviously are not in accordance with the actual situation. Field observation shows that,in unsaturated soil when the soil temperature is 0 °C,the soil does not contain ice.The process of ice formation in unsaturated soils is a continuous process; the soil's liquid-water exists even in low-temperature soils.It is impossible to achieve freeze-thaw with different soil textures and water contents in a common fixed temperature range during the soil freeze-thaw process.The third kind of scheme has strong experience and poor universality, so it is not suitable for parameterization of the land-surface model (Li and Sun, 2006).Most parameterization schemes for the freeze-thaw process on the TP mainly use the soil matric potential to calculate maximum liquid-water content when soil temperature is below the freezing point (Zhang et al.,2006;Luo et al.,2009a;Xiao et al.,2013;Zheng et al.,2017).The governing equation as follows:
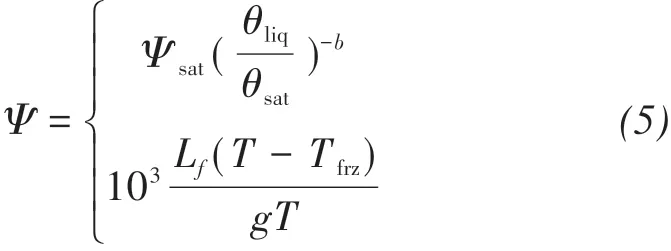
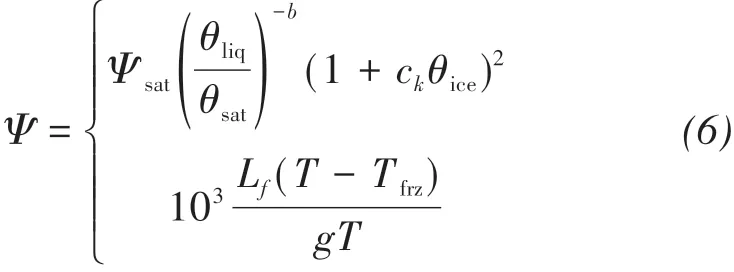
where Ψ is the soil matric potential (mm); Ψsatis the saturated soil matric potential(mm);θliqis the volumetric liquid-water content(m3/m3);θsatis the saturated volumetric water content (m3/m3); b is the Clapp-Hornberger constant; Lfis the latent heat of fusion(0.336×10⁶J/kg); g is the acceleration of gravity;Tfrzis the freezing point(273.16 K);ckis a parameter that accounts for the effect of the increase in the specific surface of soil minerals and ice-liquid water, with the average value is 8.0; and θiceis the volumetric ice content(m3/m3). Per simultaneous Equations (5) or (6), the maximum liquid-water content of the soil can be maintained when the temperature is below the freezing point. The improved parameterization scheme significantly improved the simulation results, especially SM and ST during the freezing period. The method mentioned above considers only that the soil freeze-thaw occurs at 0 °C; nevertheless, the real freeze-thaw process is a continuous and slow procedure, and there is no fixed freeze-thaw critical temperature.The relationship between SM and ST must be determined according to the relationship between soil-water potential and temperature, and the inherent constitutive relation of soil hydraulic properties.Hence,Li and Sun (2007)proposed using soil-water potential to define the freeze-thaw critical temperature;and the simulation results of modified CLM4.0 by this method were closer to the true freeze-thaw process (Xia et al., 2011).Although this method could better simulate the freezethaw process, the iterative method was generally used to solve the governing equations of the freeze-thaw process; and ST and SM were used as prognostic variables in the equation.Therefore, the ice content should be estimated at the beginning of each iteration; and the deviation of the estimation will directly affect the correct calculation of ST and then influence the ice-water phase-transition rate,thus impacting of the model accuracy and the calculation speed.In order to avoid the uncertainty of the phase-transition rate to touch off calculation instability, Li et al. (2010) used total water mass and enthalpy as a prognostic variable instead of substituting SM and ST. The simulation results of LSPs at the DY, D66, and Ngari stations demonstrated that the improved model was more effective than the scheme of adjusting the maximum liquid-water content and critical temperature (Li et al.,2010;Bao et al.,2016;Wang et al.,2017);but the simulated time by this scheme was shorter, and the simulated ST and SM still had a great deviation in the thaw (Figure 4). In addition to the above modifications to the parameterization scheme of the freeze-thaw process,Yang et al.(2018)used virtual soil temperature to define a new method for calculating the phase change of water and introduced a phasechange efficiency index into the calculation of ice content. The sensitivity-test results showed that the modified parameterization scheme greatly improves the simulation of soil moisture in freeze-thaw processes.
3.2 Parameterization of roughness length
Surface turbulent flux is the key element in the simulation of LSPs and remote sensing of water resources.Aerodynamics (Z0m) and thermal roughness lengths(Z0h) are the two momentous parameters for calculating turbulent flux (Yang et al., 2008); its size reflects the exchange of matter and energy between the near-surface turbulence and the underlying surface, the intensity of the transmission,and the magnitude of the interaction between them to some extent (Zhou et al., 2007).Z0mrefers to the height when the air flows through a physical interface;and the air velocity is zero,which is related to the morphological and spatial distribution of the roughness elements on the underlying surface(Yang et al.,2008).Strictly speaking,Z0his not a physical quantity with physical significance. It is calculated from kB-1= ln(Z0m/Z0h)and refers to the height when the temperature profile extending to the air temperature equals the surface temperature, as the atmospheric surface layer satisfying the Monin-Obukhiv similarity theory (Owen and Thomson, 1963). The following table shows the parameters of the roughness length.
Using the high-resolution turbulent flux data obtained from the Game-Tibet on the northern TP to analyze the changes of kB-1, it is found that kB-1had obvious diurnal variations(higher values during the day,lower values during the night), with kB-1even becoming a negative value at night. The scheme parameterized with friction velocity (u*) (S58, OT63, B82, Z95, Z98, K07)could not well produce the diurnal variations of kB-1whereas the friction temperature (T*) coupled into the parameterization formula of kB-1could simulate them well (Yang et al., 2008). Subsequently, many scholars used different models to compare the applicability of scheme parameterized with different roughness lengths in different regions over the TP (Figure 5) (Shiquanhe,Gerze, Tanggula, Qomolangma, and Nam CO); it is agreed that Y08 was most suitable for each simulated region (Chen et al., 2010; Chen et al., 2013a; Chen et al.,2015). Whereas, we note that the underlying surface of these areas is alpine meadow or alpine desert,and the effect of vegetation on turbulent flux is negligible. When simulating the southern TP valley and eastern TP with high grassland and shrub vegetation, the Y08 scheme,which does not take into account the canopy height,had a large deviation (Zheng et al., 2014; Ma and Zhou,2017). The simulated ST would be affected by the parameterization of Z0h; Zeng et al. (2012) studied Z0hparameterization schemes and found that the simulation values would be negative in the morning when using the Y08 parameterization scheme to simulate kB-1. Therefore, the coefficient of kB-1was proposed to be amended. The original model's coefficients a, b were adjusted to 0.32 and 0.50, and defined the friction velocity and the minimum soil thermal conductivity. The validation results using the observation data of the Gerze station indicated that the modified scheme has greatly improved the simulation results of the surface temperature. In short,the TP has complicated underlying surface and obvious spatial heterogeneity; the momentum and heat-exchange coefficients vary greatly over different regions and seasons(Ma and Zhou,2017).No scheme is parameterized that is suitable for simulating the LSMs of the whole TP. The Y08 scheme is well adapted for only western or central TP. The scheme parameterized with roughness length should contemplate the role of the canopy when simulating the southern TP valley.
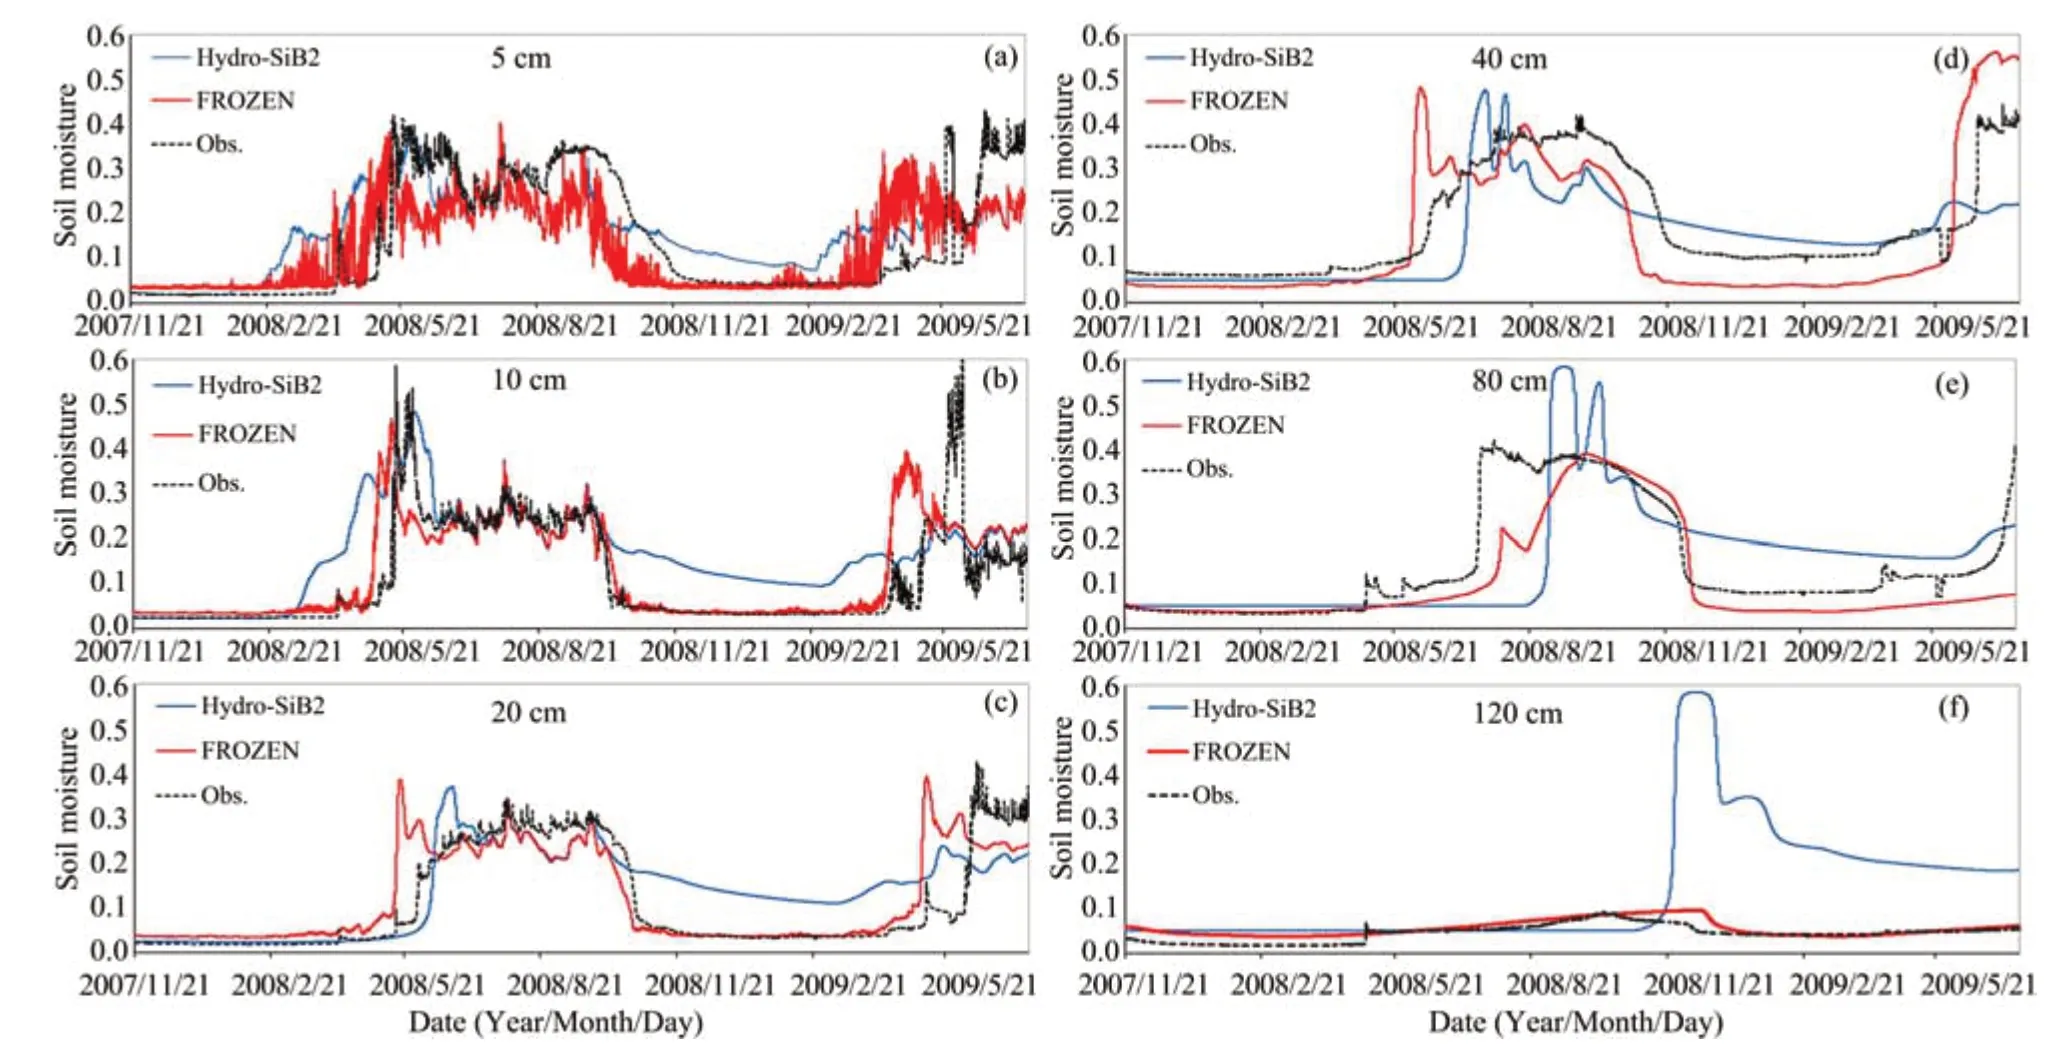
Figure 4 Comparison of observed and simulated soil liquid-water content at six soil depths at the DY station.The black dashed line denotes observation data,the blue line denotes results from the Hydro-SiB2 model,and the red line denotes results from the revised model(Bao et al.,2016)
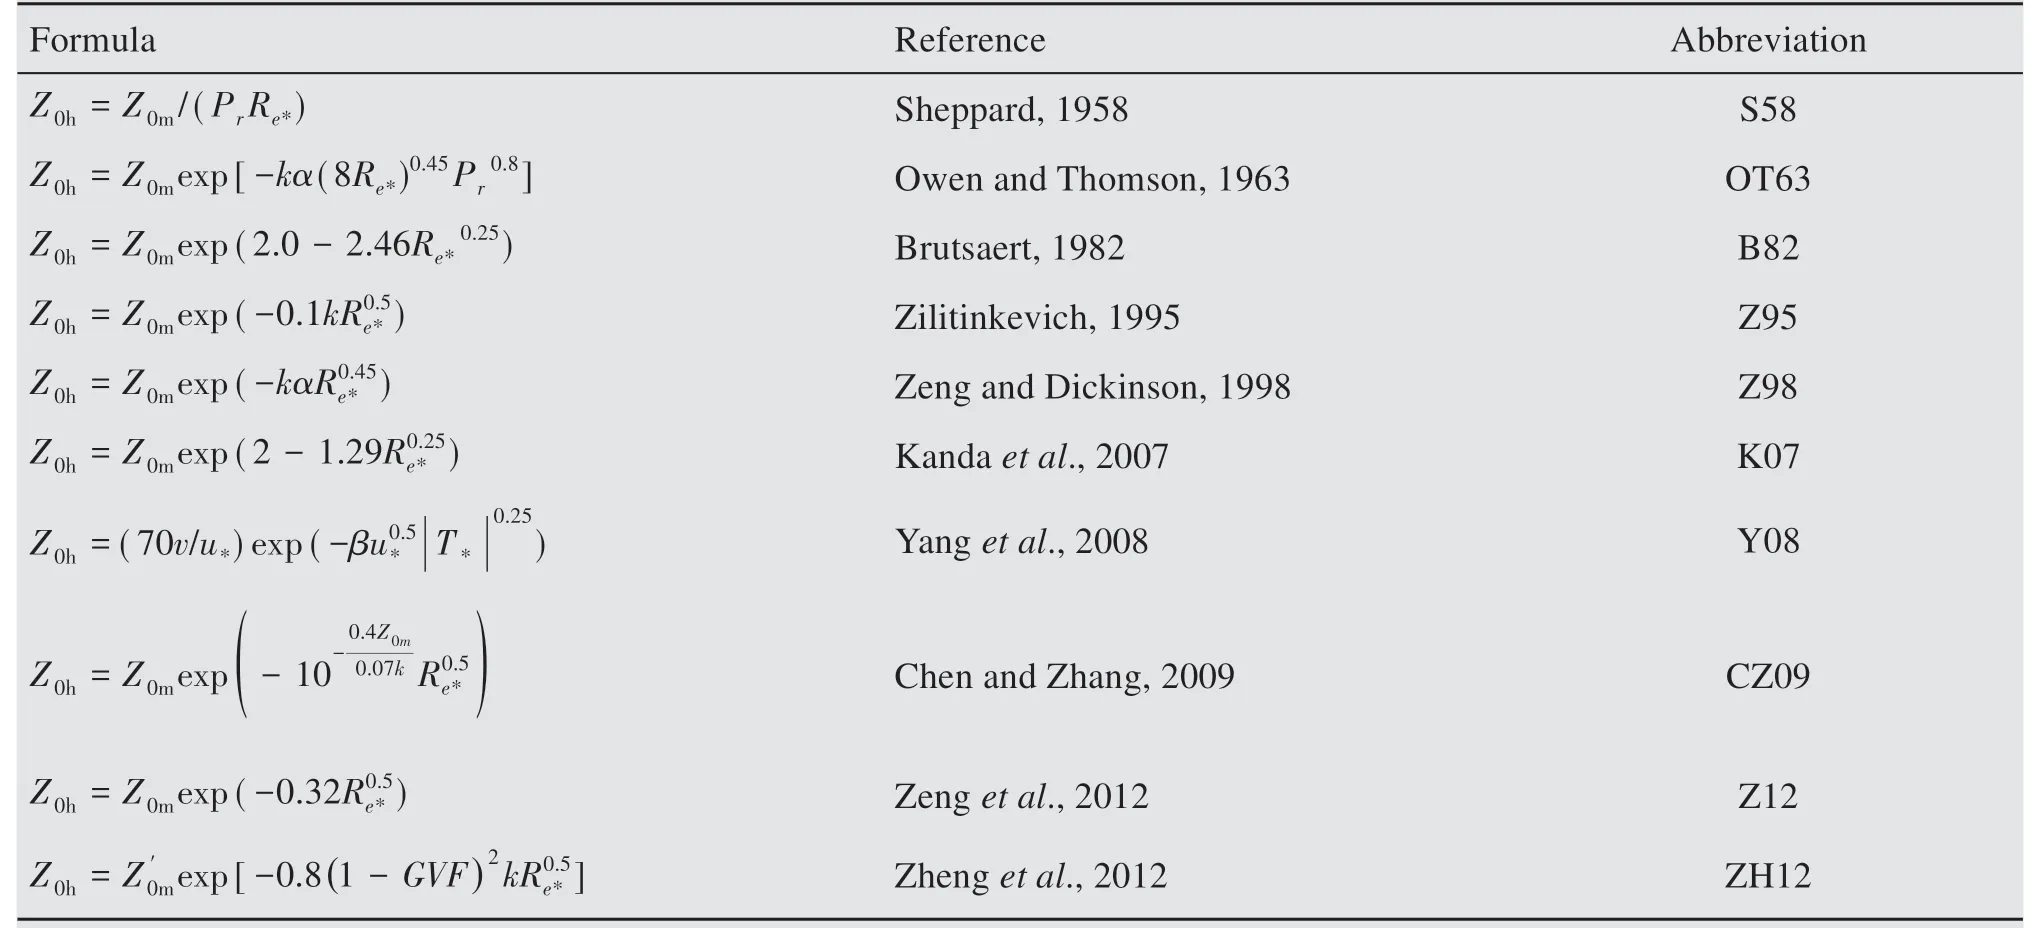
Table 3 Parameterization scheme of roughness
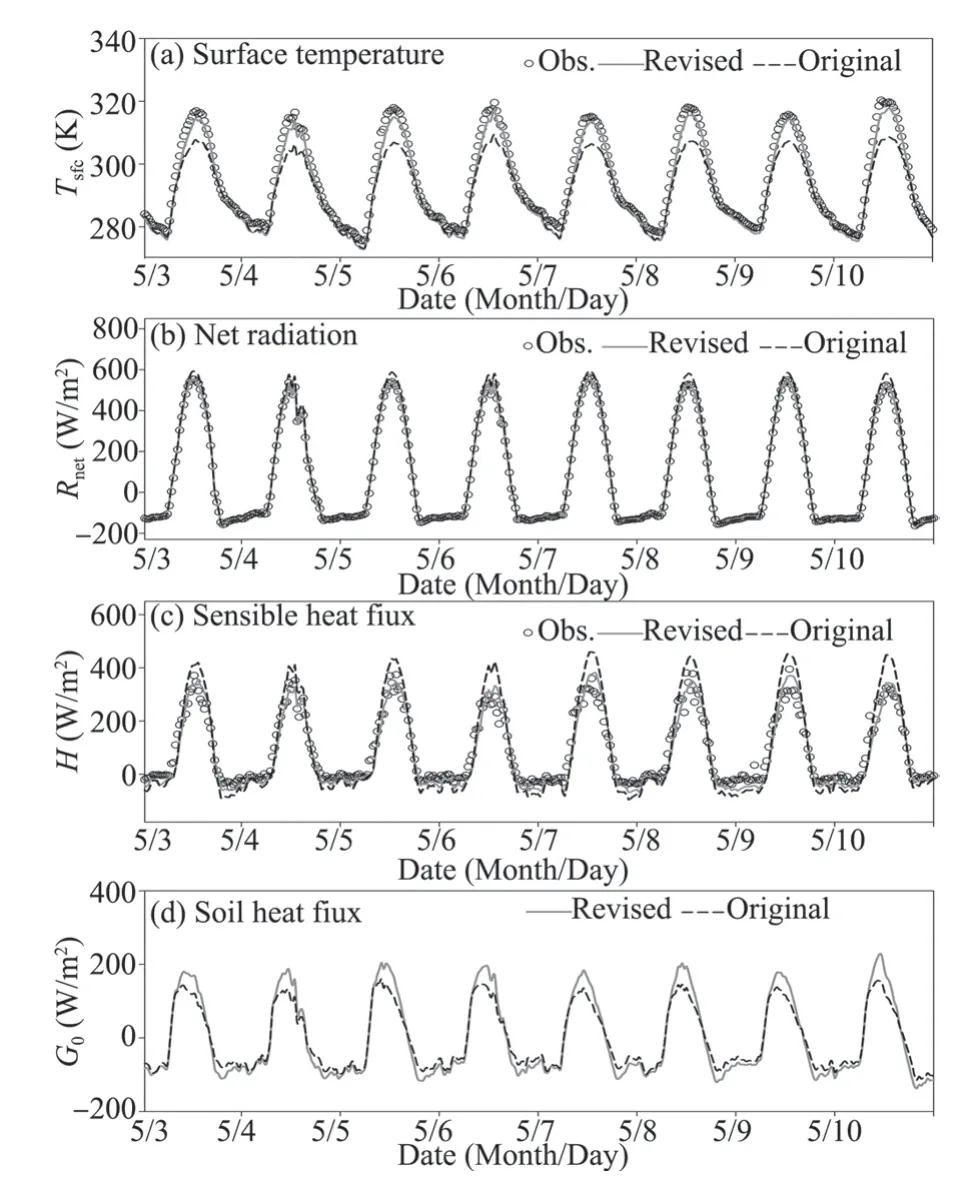
Figure 5 Comparison of the diurnal variation of the(a)surface temperature(°C),(b)net radiation(W/m2),(c)sensibleheat flux(W/m2),and(d)soil-heat flux(W/m2).Circles represent the observations,the dashed line represents simulations by the original models,and the solid line represents simulations by revised roughness parameterization(Chen et al.,2010)
3.3 Parameterization schemes of the soil thermal and hydraulic conductivity
The thermal conductivity and hydraulic conductivity of soil are important parameters to the simulation of LSPs,which have great influence on the simulation of ST and SM, as seen from the description in section 2.Soil hydrothermal properties are significantly different in different climate zones of the TP and are strongly dependent on the soil texture(Zhao et al., 2018). The unique geographical position and climatic conditions endow the surface soil of the TP with a developed root system and massive accumulated organic matter (Yang et al., 2005;Chen et al., 2012), as well as regional mass gravel(Pan et al., 2017), and large areas of permafrost and seasonal frozen soil. Therefore, the soil on the TP shows an obvious stratification, strong vertical heterogeneity, and great differences in the hydrothermal properties between the surface and the deeper layers (Yang et al., 2005; Gao et al., 2015), which will lead to large deviation from observed values when using existing LSMs to simulate the LSPs(supposing the soil is homogeneous). Hence, the soil thermal conductivity and water-conductivity schemes need to be revised according to the characteristics of the land surface of the TP (with revised schemes shown in Table 4).
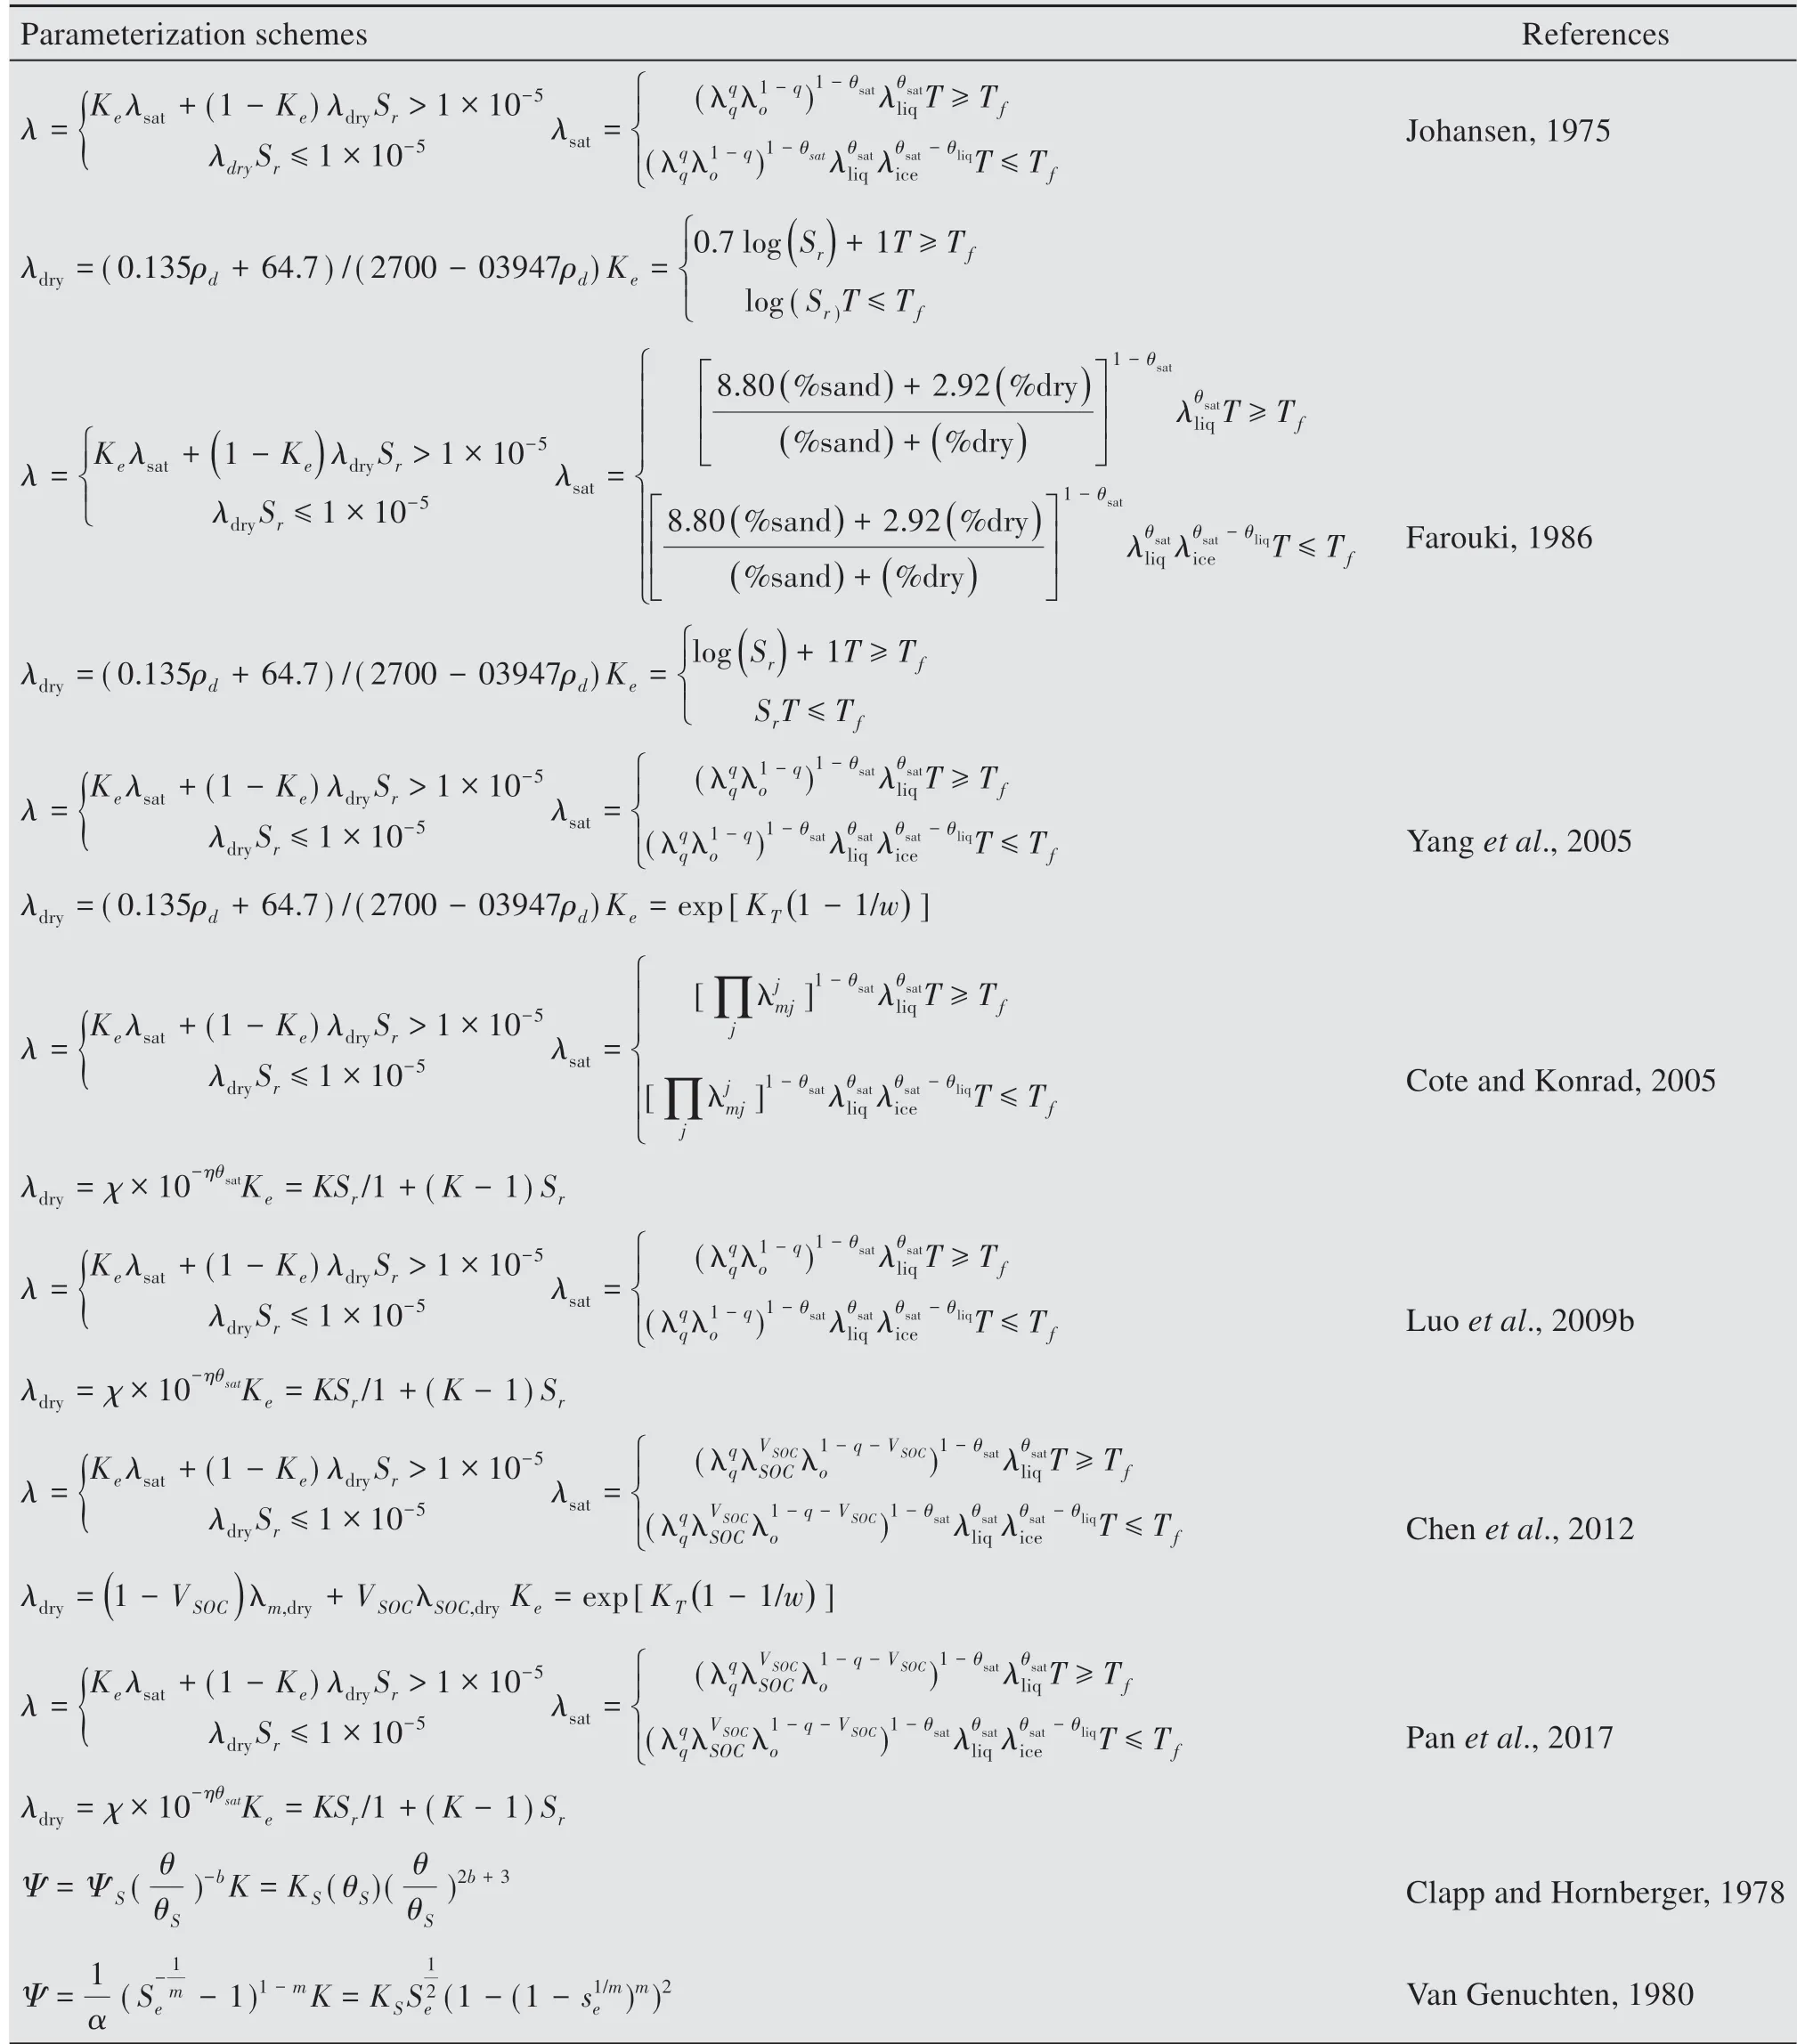
Table 4 Parameterization scheme of soil thermal conductivity and hydraulic conductivity
At present, the soil thermal and hydraulic conductivity parameterization schemes developed years ago are still adopted in the LSMs (such as Johansen(1975) (J75), Farouki (1981) (F81), and Clapp and Hornberger (1978) (CH78)), but their applicability to the plateau still needs to be verified by observational tests. Analysis of soil samples from 16 observation points on the central plateau showed that the scheme of F81 in CoLM significantly overestimated the thermal conductivity of the soil on the central plateau(Luo et al., 2009b), which exactly explains why the ST simulated by the LSMs is too high in summer and too low in winter. Without regard to the vertical heterogeneity of the plateau soil, the simplest revised scheme to conquer the overly high simulation of the soil thermal conductivity would be to (1) modify the parameters affecting thermal conductivity on the basis of the original scheme (such as thermal conductivity of saturated soil, thermal conductivity of dry soil, and the Kersten number) (Yang et al., 2005; Luo et al.,2009b); (2) use better thermal conductivity schemes to replace the original one (Wang et al., 2015; Luo et al., 2017). This simple adjustment indeed improves the simulation of soil temperature by the LSMs; but under the influence of the soil vertical heterogeneity,it does not conform to the practical situation of LSPs of the TP. To overcome the effect of the soil vertical heterogeneity of the TP on the model's simulation results, the effects of SOC, gravel, and the root system should be considered when calculating the thermal conductivity parameters based on soil texture and the hydraulic conductivity scheme based on the pedotransfer equation (Figure 6). The large accumulation of SOC in the shallow soil of the TP can reduce the thermal conductivity and increase the hydraulic conductivity and heat capacity. Thus, by assuming that the vertical heterogeneity of soil presents a sandwich structure, Chen et al. (2012) revised the J75 scheme by adding the effect of SOC on thermal conductivity to the thermal conductivity parameterization scheme to correct the thermal conductivity of saturated soil and dry soil, combined with consideration of the hydraulic conductivity scheme under the effect of SOC revised by Lawrence and Slater (2008). Then, data from 34 observation stations in northern China verified the good adaptability of this scheme whether in areas of high or low levels of SOC.Simulation results of different LSMs also showed that the scheme of Chen et al. (2012) produces better simulation results than the original one (Gao et al., 2015; Zheng et al.,2015b, 2015c; Luo et al., 2017); but its basic assumption that soil heterogeneity is a sandwich structure is unreasonable, as the real vertical heterogeneity of soil should be manifested as continuous change. Thus, to overcome the vertical heterogeneity of continuously changing soil, two methods are proposed: (1) to set a series of soil layers; and the thermodynamic and hydraulic properties of each soil layer are used as its soil-texture functions (Gao et al.,2015);and (2)to set functional equations of soil hydrothermal properties changing with soil depth (Zheng et al., 2015b; Wang et al., 2017). In general, whether using the revised scheme made by Chen et al.(2012) or the simulations based on it, their basic form of soil hydraulic conductivity scheme are the CH scheme. Moreover, recent studies have shown that the improved LSMs component (H-TESSEL) of the European Center for Medium-Range Weather Forecasting, that is, replacing the CH scheme with the Van Genuchten scheme (Van Genuchten,1980)(VG),is useful for SM simulation(Albergel et al., 2012). Based on this study, Sun et al.(2016b) changed the CLM4.0 and the CH scheme in the dynamic land-surface model (DLM) to the VG scheme, retained the effect of SOC on soil-water conductivity, and added the ice-impedance coefficient to replace the impermeable factor in the original model.The simulation results are greatly improved during the nonfreezing period by using the data of Arou station.
In addition to SOC,gravel and vegetation roots also affect soil thermal conductivity and water conductivity. Gravel reduces soil-water holding capacity and increases water and heat conductivity. As with the SOC, the influence of gravel was added to the soil thermal and hydraulic conductivity schemes (Ma et al.,2014;Pan et al.,2017);but this treatment takes into account only the less-weathered gravel, while the more-weathered gravel with its completely different porosity and hydrothermal properties is not considered(Pan et al.,2017).
Water absorption of vegetation roots is the main sink term of evapotranspiration and one of the driving factors of SM redistribution in the soil column(Zheng et al., 2015a); the soil-water holding capacity of its rhizosphere part is thousands of times more than the rest (Gao et al., 2015).Therefore, the influence of the vegetation root system should be introduced when considering soil-water conductivity. The Noah or Noah-MP model sets the vegetation root system to an unreasonable uniform distribution; hence, modifying the LSMs by the exponential equation or the asymptotic equation of root distribution can significantly improve the simulation capabilities of the Noah or the Noah-MP model (Zheng et al., 2015a, 2015b). Besides the three factors above that affect soil thermal conductivity and hydraulic conductivity, the presence of frozen ice also enhances soil thermal conductivity and impedes moisture migration in the soil; and the impermeable factor was mainly introduced to describe its effect on soil hydraulic characteristics (Bao et al.,2016;Sun et al.,2016b).
In conclusion, due to the strong vertical heterogeneity of the soil, the uniform soil thermodynamic and hydraulic parameterization scheme is not suitable for the TP. Although the soil hydrothermal property parameterization scheme that considers the unique landsurface condition of the plateau has made considerable progress, most of the studies are aimed at only the effect of SOC on the soil hydrothermal properties parameterization scheme;studies on the effect of gravel and vegetation root are insufficient, as their consideration of soil heterogeneity is in a relatively superficial phase. The existing studies focus on only the physical process elements without giving detailed consideration to vegetation's physiological processes and biological functions.All of the above issues should be further revised in future research.
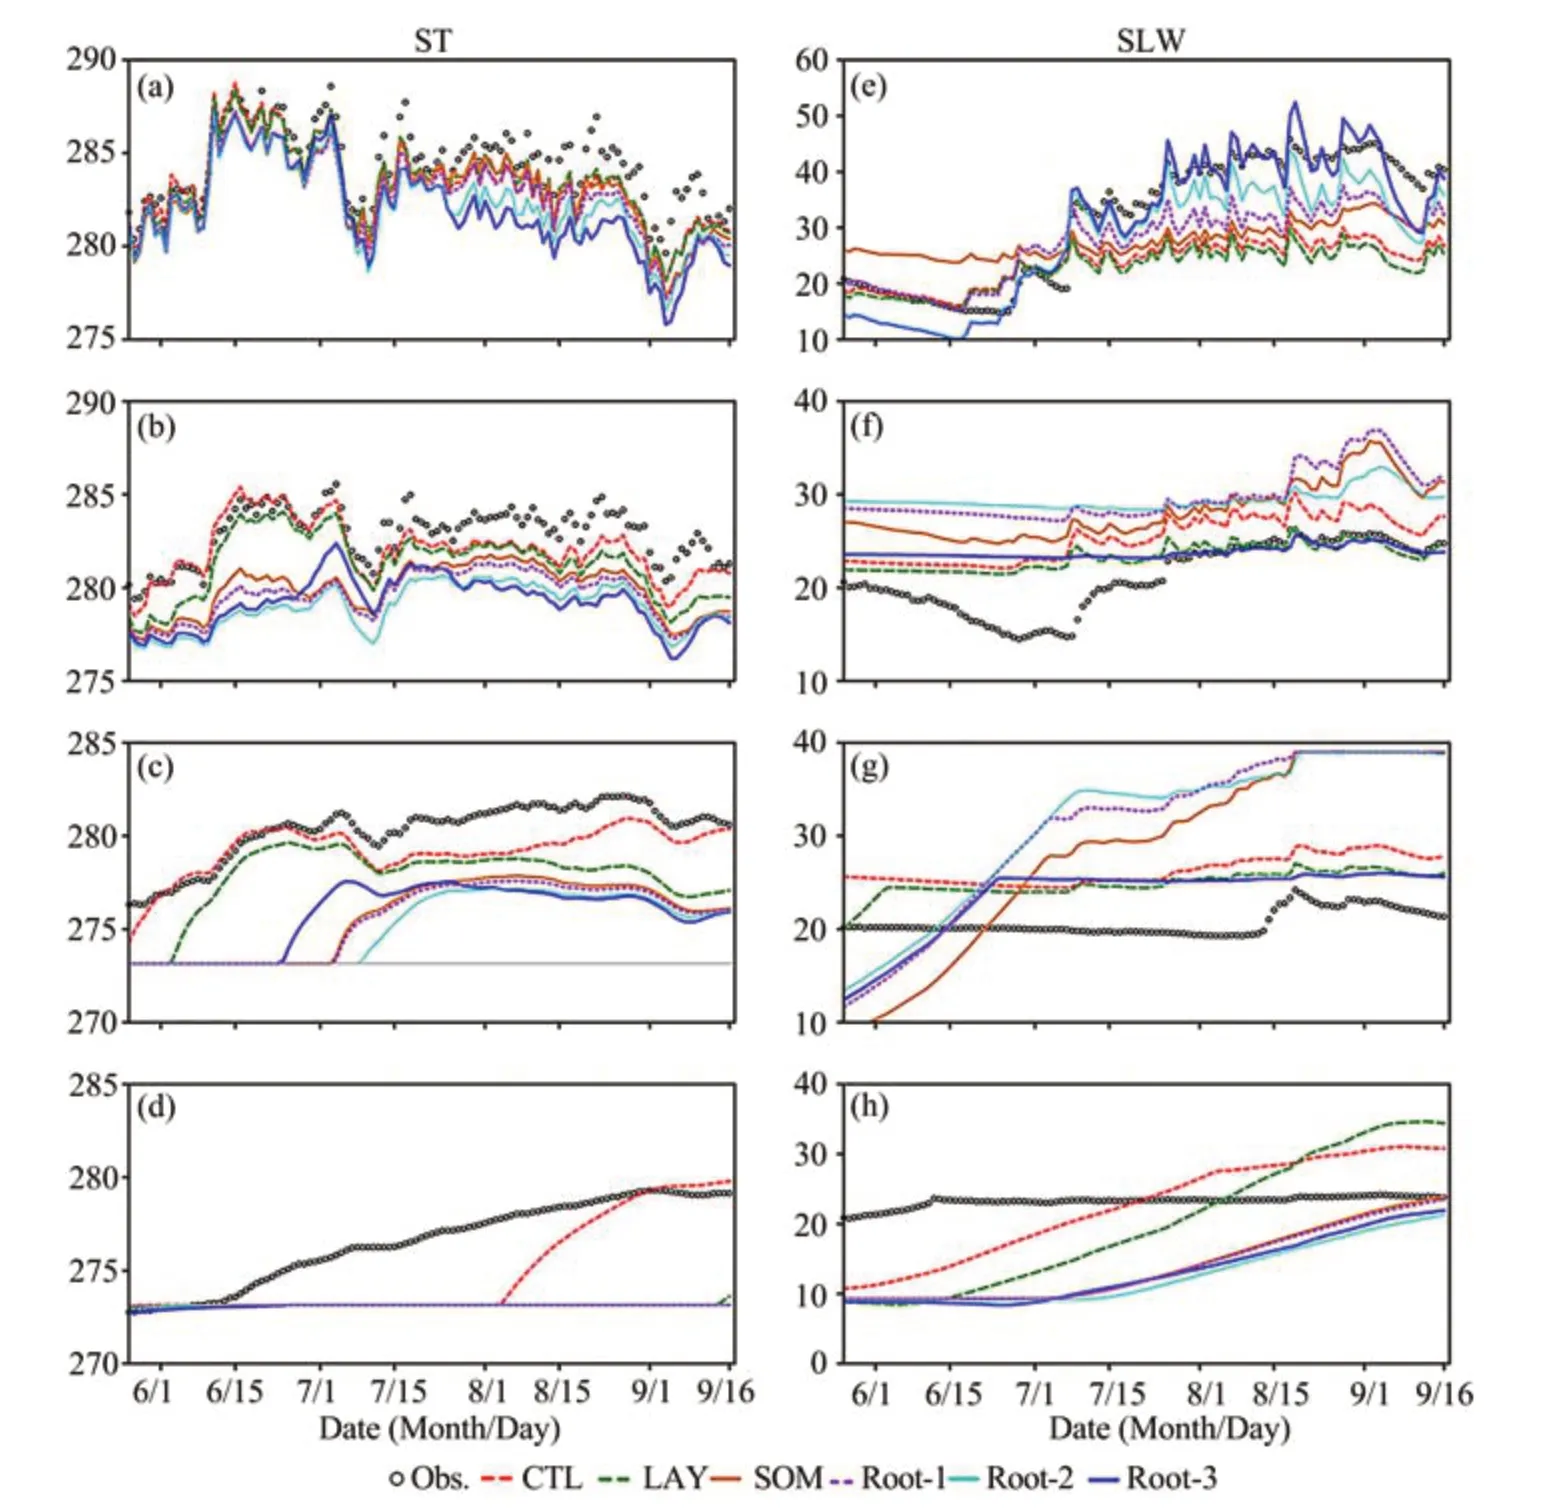
Figure 6 Variations of daily mean soil temperature and moisture at 5 cm(a,e),25 cm(b,f),75 cm(c,g),and 150 cm(d,h).CTL denotes the original model,LAY denotes the revised model of soil vertically heterogeneous,SOM denotes the revised model of soilorganic matter,and root 1-3 denotes the different saturated conductivities at the rhizosphere,respectively(Gao et al.,2015)
3.4 Snow-cover parameterization scheme
Due to the characteristics of high albedo, high thermal conductivity,and low heat capacity,the snow cover can strongly affect the surface-energy budget and the earth-radiation balance;therefore,the error of the LSMs for the radiation-flux simulation in winter is mainly caused by the snow-cover parameterization scheme,which is the reason why the reasonable description of the snow-cover parameterization scheme should be considered in the LSMs.Currently,there are mainly two aspects to improving the snow-cover parameterization scheme: (1) to improve the actual scheme (Xiao et al.,2013;Xie et al.,2018)and (2)to add snow-layer structure into the original model and adopt different snow layers for different snow depths(Wang et al.,2017).
Without changing the influencing factors of snow cover, Xiao et al. (2013) used an only empirical formula to adjust the parameterization scheme (fsno=minwhere fsnois the fraction of the ground covered with snow,and zsnois the depth of snow (m)).Xie et al. (2018) used two schemes of snow-cover parameterization (NY07 and SW12) (Niu and Yang,2007; Swenson and Lawrence, 2012b) to revise CLM4.5.Among these, the NY07 scheme takes snow cover as a function of snow depth and density, while the SL12 scheme takes snow cover as a function of the snow/water equivalent. Besides, for the adjustment of the snow-layer structure, Wang et al. (2017)believed the snow-accumulation process should consider two cases: in the one when the snow depth of canopy or ground is less than 5 cm, the original single-layer snow-cover scheme should be adopted; and in the other, when the snow depth of canopy or ground is greater than 5 cm,the new three-layer snowcover parameterization scheme should be adopted. In the three-layer snow cover scheme (Wang et al.,2017), the material budget calculation of each layer should consider precipitation, evaporation/sublimation, compaction, liquid-water retention, snowmelt runoff, and infiltration to the underlying soil. The meltwater of each layer increases as snow cover accumulates and runs off when it exceeds its liquid-water holding capacity. The energy balance can be calculated at only the first layer, and the heat budget at the second and third layers is controlled by heat conduction and emitted shortwave radiation. According to the simulation results of the revised model on the mountain pass (DY), the revised model significantly improved the simulation of ST and SM(Figure 7).
At present, the main improvements of the snowcover parameterization scheme are only the above two aspects. But in accordance with simulation practice, the revised scheme did not significantly improve the simulation results, due to the lack of wind-blown snow schemes.Therefore,the study of snow-cover parameterization should be emphasized in future research (such as the wind-blown snow scheme, snowcover scheme, the energy content of the snowpack,and physical process of the material budget).
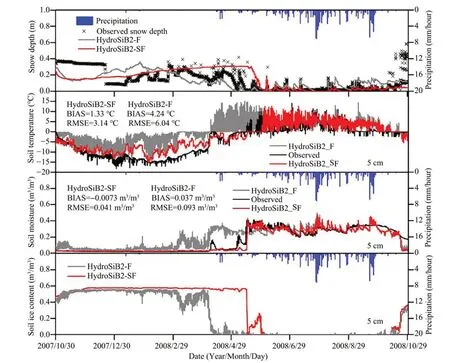
Figure 7 Observed and simulated snow depth(m),soil temperature(°C),soil moisture(m3/m3),and soil-ice content at 5 cm at the DY site(Wang et al.,2017)
3.5 The improvement of multiparameterization schemes
Not only is the land surface coupled with the atmosphere, but also the various subprocesses of the LSMs are interacting continuously (Wang et al.,2018); therefore, the simulation of a certain physical quantity of LSPs can be affected by several parameterization schemes. For example, the simulated SM will be affected by several parameterization schemes, such as freeze-thaw process, hydrothermal transfer process, ice-impendence effect, atmospheric precipitation, energy flux, etc.. In order to further improve the simulation capability of the model, it is far from enough just to modify a parameterized process. The Noah model overestimated the turbulent heat flux,underestimated the surface and soil temperatures,and did not well produce the SM profile;and the surface runoff increased due to the strong impedance of the simulated permafrost to water infiltration (Van der Velde et al., 2009; Chen et al., 2011, 2013b; Niu et al., 2011; Zheng et al., 2014, 2016a). Because of the complex interaction between the subprocesses within the LSPs,the improvement of multiparameterized schemes should be taken into account in the enhancement of the model. To revise the simulation error of turbulent heat flux and soil-heat transfer in the Noah model, improvements have been made as follows: (1) removing the influence of vegetation on thermal conductivity when the heat is transferred from the first layer of soil to the second layer; (2) using the leaf-area index and vegetation-cover fraction to define the exponential decay factor of soil-heat transfer from the surface to the first layer;(3)modifying the roughness-length parameterization scheme,and (4) considering the effect of SOC on soil thermal conductivity (Zheng et al.,2015c,2016a).To improve the simulation results of the model on SM, the multiparameterization scheme was also revised: (1) considering the effect of SOC on soil hydraulic properties;(2)considering that the soil hydraulic conductivity decreases exponentially with the increase of soil depth,and modifying the uniform vegetation root distribution in the model(Zheng et al.,2015a,2015b,2016a);(3)for reducing the resistance of frozen soil,using the soil-hydraulics parameterization scheme of Niu and Yang (2006) to improve the simulation results. Overall, whether at the point scale or the watershed scale,the Noah model coupled with all the improved parameterization schemes has the best simulation results(Zheng et al., 2016a, 2016b; Figure 8). Scholars have made different improvements of multiparameter schemes, which also indicate the same conclusion(Gao et al., 2015; Bao et al., 2016;Wang et al., 2017;Wang and Yang,2018).
4 Discussion and conclusions
4.1 Discussion
Over the past 20 years, researchers have done a lot of research on the simulation of LSPs on the TP and realized a series of remarkable achievements; but the research needs to be further enhanced by the observations, model applicability, and modified parameterization schemes.
First,due to the complex underlying surface and the abominable natural environment of the TP, observation stations are very scarce, with a relatively short resolution of observed data. The observation stations used to study the model applicability and improvement of the parameterization scheme are mainly located along the Qinghai-Xizang Highway (Figure 1) and mostly in the flat valley known from the distribution characteristics of the meteorological stations on the TP (Wang et al.,2018). The uncertainty of atmospheric forcing data and the error of validation data are the important reasons for the error of the LSMs(Gao et al.,2015;Bi et al.,2016;Zhang et al., 2016).Therefore, in order to better understand the land-atmosphere interaction over the TP and evaluate model applicability on an extensive spatiotemporal scale, there is a need to establish more observation stations in data-poor regions for the long term,particularly on the western TP and high-altitude areas, as well as to conduct larger land-surface observational experiments (Yang et al., 2019). The ultimate goal of the applicability analysis and the scheme improvement is to better understand the land-atmosphere interaction and to simulate more accurately the LSPs in the GCMs and AGCMs.But the current model-applicability analysis is mainly focused on the short space-time scale. Therefore,the coupling of the LSMs with the RCMs and GCMs should be strengthened to simulate the LSPs over the plateau on a larger scale.Also,for driving the LSMs to simulate on an extensive spatiotemporal scale, remote-sensing data and reanalysis data will be required as atmospheric forcing data, which makes it necessary to validate the accuracy of these data.
Second, the main reason why the LSMs show deviation when simulating the LSPs on the TP is that the models assume that the parameters in the soil column are uniformly distributed (e.g., vegetation roots, soil hydraulic conductivity, and thermal conductivity).The analysis of the soil hydrothermal properties of the TP shows that the soil has strong vertical heterogeneity, which leads to the unreasonable parameterization scheme of the model. Some progress has been made in improving the parameterization scheme for vertical heterogeneity (Yang et al., 2005; Chen et al., 2012;Gao et al., 2015; Zheng et al., 2015b, 2015c); but the assumption based on soil vertical heterogeneity is not very reasonable, and vertical heterogeneity will have an impact on all soil and vegetation root hydrothermal parameters, whereas the current improvements are for only a smaller number of parameters.Therefore, more effort should be made to research the impact of soil vertical heterogeneity to simulation results. The plateau, as an "Asian water tower", widely distributed many rivers and lakes on its surface; but for most LSMs,it is quite simple to deal with the runoff,resulting in the deviation of simulated runoff and further influencing the simulated SM (Zhan et al., 2018). Besides, the LSMs are not good at simulating an ice lake or deep lake (Ren et al., 2013). Thus, future study can focus on improving the parameterization scheme based on the characteristics of the underlying surface of the TP and the defects of the model. From the analysis in section 3, we can see that the improvement of the parameterized schemes has made good progress. However,most of them focus on only a parameterized scheme(e.g.,freeze-thaw process,snow-cover process,roughness length, soil thermal and hydraulic conductivity).Various subprocesses within the LSMs interact continuously,and multiple parameterization schemes affect the physical quantities of the same land-surface process.The results show that the improved multiparameterization scheme has a better simulation effect than the single (Gao et al., 2015; Bao et al., 2016; Zheng et al.,2016a, 2016b;Wang et al., 2017). Hence, the direction of future efforts should avoid being limited to improvements in a parameterized scheme and to consider revising the multi-parameterized scheme.
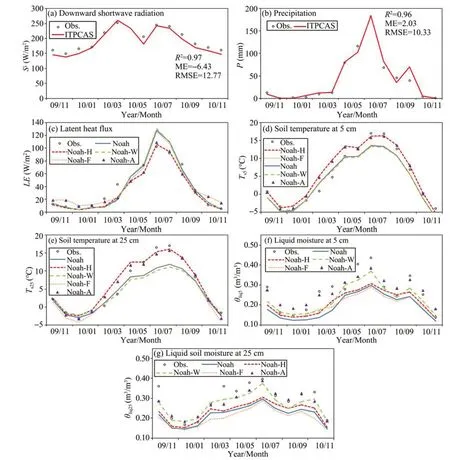
Figure 8 Comparisons of monthly(a)averaged downward shortwave radiation;(b)accumulated precipitation;(c)LE,soil temperature,and moisture from depths of(d,f)5 cm and(e,g)25 cm;and simulated results from five Noah experiments for the period of November 2009 to November 2010(Zheng et al.,2016a)
Third, waterbodies (thermokarst lakes and ponds)account for up 28% of the land surface in the permafrost landscape, especially in lowland tundra landscapes such as the Lena River Delta; more than 30%of the total inland water surface can be attributed to waterbodies (Langer et al., 2015). The Northern Hemisphere is experiencing significant warming, this warming trend will lead not only to the decomposition of the soil organic carbon pool but also to the formation of small and shallow thermokarst lakes and ponds in ice-rich permafrost regions. Some research has suggested that the presence of waterbodies can strongly influence the exchange of energy, momentum, and matter between land and atmosphere in permafrost regions (Boike et al., 2015; Langer et al.,2016; Franz et al., 2018). However, most state-of-theart LSMs do not represent the waterbodies and their dynamic change, considering the water/land-surface model are solved only for vertical thaw,and the mechanisms of heat transfer within waterbodies are either highly simplified or completely neglected; in particular, for the simulation of LSPs on the TP, the role of waterbodies is completely ignored.
Last, the model structure will also bring error to the simulation (Bi et al., 2016); the existing LSMs have a simpler consideration of some model structures (e.g.,snow cover,soil layer);and the adjustment of the model structure will significantly improve the model simulation result (Xiao et al., 2013; Wang et al., 2017). The state-of-art LSMs consider the physical process in detail but neglect some vegetation physiological and biological processes (e.g., plant mucus,microbes). Hence, a more reasonable definition of model structure and coupling into more vegetation physiological processes and biological processes will greatly improve the model simulation results. Also,the issue of resolution,which include the resolution of the model results and the atmospheric forcing data is worth considering.This is because the higher the resolution of the atmospheric forcing data and model output, the more accurate the simulation results.As a result, GCMs and RCMs that are coupled with LSMs can better simulate and predict further climate change.
4.2 Conclusions
In view of the particularity and importance of the LSPs on the TP,this paper summarized the latest progress of land-surface process simulation over the past 20 years,from the point of view of model adaptability and parameterization-scheme improvement. Studies on the applicability of different LSMs to the TP show(1) simulation deviation of ST possesses spatiotemporal differences, with the simulated ST in summer more accurate than that in winter,and in topsoil better than in deep soil. Different models may over- and underestimate ST on a diurnal scale. The main reason for the deviation of simulated ST lies in the imperfection of the parameterized scheme of soil thermal conductivity and thermal capacity.(2)Some LSMs significantly underestimate or even fail to simulate SM during the freezing period. With model development, the simulated SM during the freezing period is improved significantly, due to the LSMs' inability to capture the change of soil-surface-water content caused by frequent precipitation, evaporation, and runoff, therefore leading to the error of simulation mainly coming from the rainy season. (3) In winter, the Rnis overestimated due to the effect of snow on the USR.Different models underestimate daytime Rnand overestimate night Rn.Radiation flux is mainly affected by albedo and surface temperature. (4) Different models can capture the diurnal and seasonal variations of energy flux, but the simulation deviation is large. By analyzing the parameterized schemes of H and LE, the main impacting factors are the soil-surface heat-exchange coefficient, soil evaporation, canopy precipitation evaporation, vegetation stomatal evaporation, and the parameterized scheme of vegetation physiological processes. (5) No one LSM can be fully applied to simulating the LSPs of the TP;all of them need parameterized improvement according to the characteristics of the TP;and the atmospheric forcing data and observational errors can also bring deviation to the simulation results.
Most parameterization-scheme freeze-thaw processes that aim at LSPs of the TP mainly used soil matrix potential to define the soil maximum liquid-water content when the ST is below the freezing point.However, the method mentioned above regarding the soil freeze-thaw takes place at 0 °C; the real freeze-thaw processes are successively slow processes, and there is no fixed freeze-thaw critical temperature.The relationship between the soil-water content and temperature must be determined by the connection between soil-water potential and temperature under thermodynamic equilibrium conditions and the inherent constitutive relation of soil hydraulic properties. Using total water content and enthalpy to substitute for SM and ST as prognostic of governing equations for the sake of avoiding the uncertainty of the phase-change rate gives rise to the instability of model operation. The complicity underlying surface and strong spatial heterogeneity render none of a roughness-length parameterization scheme that can be utilized in the LSMs well. The Y08 scheme is suitable for only the western and central TP, where the underlying surface is alpine meadow and desert. The effect of canopy needs to be considered in the roughness-length parameterization scheme when simulating the southern TP valley. The soil vertical heterogeneity makes uniform soil thermodynamics and hydraulic parameterization schemes unsuitable for the plateau. In spite these challenges, remarkable progress has been made in the parameterization of soil hydrothermal properties, taking into account the unique surface conditions of the TP;but most of the studies have focused on the effects of SOC and paid less attention to gravel and vegetation roots; the deliberation of soil vertical heterogeneity is relatively simple. There are few types of research on the snowcover parameterization scheme, and the improved scheme has no advantage over the original due to lacking some physical processes of snow cover. The improved land-surface model with multiparameterization scheme has a better simulation effect.The mostly existing improvements are based on the physical process elements and do not consider vegetation physiological processes and biological effects in detail. Therefore, in the future, a more accurate simulation of LSPs on the TP is needed to address unreasonable parameterization schemes and the faultiness of LSMs.
Acknowledgments:
The work was jointly funded by the National Natural Science Foundation of China (41571066, 41601077,and 41771068), the Strategic Priority Research Program of the Chinese Academy of Sciences (CAS)(XDA20100102, XDA19070204), the CAS "Light of West China" Program, the Youth Innovation Promotion Association CAS (2018460), and the Program of China Scholarship Council(201804910129).
 Sciences in Cold and Arid Regions2019年2期
- Sciences in Cold and Arid Regions的其它文章
- Effects of freeze-thaw cycle and dry-wet alternation on slope stability
- Analysis of vegetation changes and dominant factors on the Qinghai-Tibet Plateau,China
- Shifts in community structure and function of ammoniaoxidizing archaea in biological soil crusts along a revegetation chronosequence in the Tengger Desert
- Holocene climatic change reconstructed from trace elements of an aeolian deposit in the southeastern Mu Us Desert,northern China
- The establishment and development of Haloxylon ammodendron promotes salt accumulation in surface soil of arid sandy land
- Editors-in-Chief Guodong Cheng and Ximing Cai