
Shifts in community structure and function of ammoniaoxidizing archaea in biological soil crusts along a revegetation chronosequence in the Tengger Desert
2019-05-09 07:33:50LiNaZhaoXinRongLiShiWeiYuanYuBingLiu
LiNa Zhao ,XinRong Li,ShiWei Yuan ,YuBing Liu *
1. Shapotou Desert Research and Experiment Station, Northwest Institute of Eco-Environment and Resources, Chinese Academy of Sciences,Lanzhou,Gansu 730000,China
2. Key Laboratory of Stress Physiology and Ecology in Cold and Arid Regions of Gansu Province, Northwest Institute of Eco-Environment and Resources,Chinese Academy of Sciences,Lanzhou,Gansu 730000,China
3.Key Laboratory of Remote Sensing of Gansu Province,Northwest Institute of Eco-Environment and Resources,Chinese Academy of Sciences,Lanzhou,Gansu 730000,China
4.University of Chinese Academy of Sciences,Beijing 100049,China
ABSTRACT Metagenomic studies have demonstrated the existence of ammonia-oxidizing archaea(AOA)and revealed they are responsible for ammoxidation in some extreme environments.However,the changes in compositional structure and ammonia-oxidation capacity of AOA communities in biological soil crusts (BSCs) of desert ecosystems remain poorly understood.Here, we utilized Illumina MiSeq sequencing and microbial functional gene array (GeoChip 5.0) to assess the above changes along a 51-year revegetation chronosequence in the Tengger Desert, China. The results showed a significant difference in AOA-community richness between 5-year-old BSCs and older ones. The most dominant phylum during BSC development was Crenarchaeota,and the corresponding species were ammonia-oxidizing_Crenarchaeote and environmental_samples_Crenarchaeota. Network analysis revealed that the positive correlations among dominant taxa increased, and their cooperation was reinforced in AOA communities during BSC succession.Redundancy analysis showed that the dominant factor influencing the change in AOA-community structure was soil texture. GeoChip 5.0 indicated that the amoA gene abundances of AOA and ammonia-oxidizing bacteria (AOB) were basically the same, demonstrating that AOA and AOB played an equally important role during BSCs development. Our study of the long-term succession of BSC demonstrated a persistent response of AOA communities to revegetation development in desert ecosystems.
Keywords:ammonia-oxidizing archaea;biological soil crusts;GeoChip 5.0;network analysis
1 Introduction
Biological soil crusts (BSCs) are assemblages of macroscopic and microscopic organisms, including mosses, lichens, algae, archaea, bacteria, fungi, and other organisms that bind together with surface soil particles, forming a cohesive horizontal layer of a few centimeters deep (Belnap et al., 2016). BSCs are widespread in semiarid and arid areas, making up as much as 70% of the living cover of some unique soil habitats (Belnap et al., 2016) and performing a variety of ecological functions,such as fixing dune surfaces (Li et al., 2012), influencing soil moisture (Belnap,2003), and creating optimal living conditions for other organisms (Neher et al., 2009). More importantly,BSCs also enhance soil fertility by regulating carbon(C)and nitrogen(N)input(Belnap,2003).
In semiarid and arid lands,N is regarded as the second most limiting factor in soil productivity besides water, and N fixation by cryptogamic species and microorganisms in BSCs has been considered as an important N source (Mayland and Mcintosh, 1966; West,1991; Abed et al., 2010). Nitrification, the biological oxidation of ammonia (NH3) to nitrite () and further oxidation to nitrate (), is a common N-transformation process in BSCs and influences the fate and source of N in the temperate desert ecosystem(Ouyang et al., 2016). As a crucial step in the nitrification process, ammonia oxidation is generally considered to be mediated by ammonia-oxidizing bacteria (AOB) and ammonia-oxidizing archaea (AOA) (Martens-Habbena et al., 2009).These two ammonia oxidizers play an integral role in creating unfavorable environmental conditions that influence greenhouse-gas nitrous oxide(N2O) emissions, the leaching ofinto groundwater, and N availability for other organisms (Raun and Johnson, 1999; Kowalchuk and Stephen, 2001; Zhalnina et al., 2012). In addition, both AOB and AOA carry the ammonia monooxygenase (amoA) gene, which is often regarded as a molecular marker for investigating the biodiversity, abundance, and function of ammonia oxidizers(Hayden et al.,2010).
The discovery of AOA has changed our understanding of the biodiversity of nitrifying microorganisms and triggered a key microbial ecological problem in that AOA or AOB play a dominant role in ammonia oxidation. Studies have been conducted on the composition of the AOA community and found that AOA mainly consist of group I.1a (also called Nitrosopumilus or marine group I), group I.1b (also called Nitrososphaera), and hot-springs clusters (Hallam et al., 2006; Schleper and Nicol, 2010). However, the species of the AOA community that are involved in ammoxidation during BSC succession remain unclear.Moreover,there is still debate regarding the main contributor to ammonia oxidation in different habitats,with some reports considering AOB as the major contributor (e.g., Di et al., 2009) and others suggesting that the abundance of amoA genes is greater in AOA than that in AOB in marine and other ecosystems (up to 3,000 times higher in some soil ecosystems)(Leininger et al.,2006).Furthermore,AOA has been proven to be the main ammonia oxidizer in desert-like ecosystems with neutral to slightly alkaline and low ammonium () conditions (Erguder et al., 2009; Martens-Habbena et al., 2009; Hayden et al., 2010; Zhang et al., 2012). These inconsistent conclusions and knowledge gaps make it necessary to study the composition and ammonia-oxidation capacity of the AOA community in desert ecosystems.
In the present study, the composition and ammonia-oxidizing potential contribution of AOA communities in BSCs were studied along a 51-year chronosequence of revegetation using Illumina MiSeq sequencing and microbial functional gene array (GeoChip 5.0). Our objectives were to investigate the shifts that occurred in the compositional structure and ammoniaoxidation capacity of the AOA community during BSC succession in a desert area, as well as the main soil environmental factors driving these changes in the AOA community.
2 Materials and methods
2.1 Site description
The study site is located in the Shapotou revegetated region(37°32′N,105°02′E)on the southeast fringe of the Tengger Desert,north-central China.The natural landscape of this area is made up of large and dense reticulate dune chains. The mean annual temperature is 9.6 °C; the mean annual rainfall is approximately 180 mm, with most of the precipitation occurring between July and September; and the mean annual pan evaporation is approximately 2,900 mm (Liu et al.,2006). The soil in the area is saline, sandy, and alkaline, with a pH range of 7.5-11.2 (He et al., 2016).The dominant plants are xerophytic shrubs such as Artemisia ordosica Krasch and Caragana korshinskii Kom. To protect the Lanzhou-Baotou Railway line from sand burial, a 16-km-long non-irrigation vegetation protection system was established in 1956 and has been expanded several times in the following decades.The formation of BSCs following the stabilization of sand dunes is considered a critical indicator of desertification recovery. Thus, areas revegetated in different years have created ideal experimental sites to study the succession of BSCs using the"space-for-time"method.
2.2 Sample collection and preparation
BSCs and their underlying soil (0-5 cm) were collected separately in early November 2015 from the revegetated areas established in 2010 (5-year revegetation, 5YR), 2000 (15-year revegetation, 15YR), 1987(28-year revegetation, 28YR), 1981 (34-year revegetation, 34YR), and 1964 (51-year revegetation, 51YR).Within each revegetated area, five sample cores (3.5-cm diameter)from a diagonal intersection and four vertices of each plot (20m×20m) were sampled. To decrease spatial heterogeneity, each sample was collected from six plots (at least 20 m apart). Thus, 30 samples(5 cores × 6 plots) were obtained and immediately mixed together, homogenized, and passed through a 1-mm sieve to form one composite sample without impurities. Triplicate composite samples for each revegetation area were collected using the same method. Composited BSC samples were immediately placed in an icebox and transported to the laboratory to be stored at-80 °C until DNA extraction. Each composited soil sample was and air-dried to a constant weight for soilproperties analysis.
2.3 Soil properties analysis
Soil pH was determined in a 1:5 mixture of soil:water. Sand, silt, and clay contents were ascertained using a sieving method (Moritsuka et al., 2015).Total C (TC)and total N (TN)were measured using an Elementar Vario EL analyzer (Elementar Analysensysteme,Hanau,Germany).Chemical analysis of organic C (OC) was performed using the dichromate-oxidation method (Nelson and Sommers, 1996). The C:N ratio was calculated using OC and TN (Aitkenhead and Mcdowell, 2000). Total phosphorus (TP), organic matter (OM), and available N (AN) were determined using the Sommers-Nelson method (Sommers and Nelson, 1972), the Walkley-Black method (Walkly,1934), and the alkali-diffusion method (Nanjing Institute of Soil Research, 1980), respectively. Available phosphorus (AP) was extracted with 0.5-mol/L sodium bicarbonate at pH 8.5. The activities of urease(UE), dehydrogenase (DHA), and invertase (IT) were assayed using the spectrophotometric methods described by Yang et al. (2007), Casida et al. (1964),and Jin et al.(2009),respectively.One unit of enzyme activity of UE, DHA, and IT was defined as the amount of enzyme that decomposed 1 μg of1 μg of triphenyl formazan, and 1 μg of glucose per gram of dry soil sample per hour, respectively.All soil physicochemical characteristics and enzyme activities are shown in Table S-1.
2.4 Illumina MiSeq sequencing and data processing
Total DNA was extracted from 1 g BSC using an E.Z.N.A Soil DNA Kit (Omega, Bio-tek, Norcross, GA,USA) according to the manufacturer's instructions.The purity and concentration of the obtained DNA was assessed using a NanoDrop 2000c(Thermo Fisher Scientific,Waltham, MA, USA), and samples were stored at-20 °C until use. The AOA amoA gene was amplified by polymerase chain reaction (PCR) using the primers Arch-amoAF (5'- STAATGGTCTGGCTTAGACG-3')and Arch-amoAR(5'-GCGGCCA TCCATCTGTATGT-3') (Mao et al., 2011). The 20-μL PCR mixture contained 5 μL of 2×Taq PCR Master Mix (Sangon Biotech Shanghai Co., Ltd., Shanghai, China), 1 μL of each primer (10 μmol/L), 1 μL of template DNA (10 ng),and 12 μL of sterilized ultrapure water.The following conditions were used to amplify AOA amoA:an initial denaturation step at 94 °C for 4 min; followed by 35 cycles consisting of 94 °C for 1 min, 53 °C for 1 min, and 72 °C for 1 min; and a final extension at 72 °C for 10 min.Amplicons were extracted from 1% agarose gels,purified using the SanPrep Column DNA Gel Extraction Kit (Sangon Biotech Shanghai Co., Ltd.),and quantified using a QuantiFluor™-ST(Promega Corporation, Madison,WI, USA). Purified amplicons were sequenced using the Illumina MiSeq platform at Majorbio Bio-Pharm Technology Co. Ltd., Shanghai, China(http://www.majorbio.com/). Sequence data have been archived in the NCBI Sequence Read Archive database(Accession number:SRP118744).
After sequencing,the original data were multiplexed and filtered using QIIME(version 1.17)with the criteria described by Liu et al.(2017).The sequences were then grouped into Operational Taxonomic Units(OTUs)with a 97% sequence-identity cutoff using UPARSE (version 7.1,http://drive5.com/uparse/).The rarefaction curve and community richness (Sobs index=observed richness=number of OTUs) were obtained by using the MOTHUR program (Schloss et al., 2009). The overall differences in AOA community composition among BSC samples were evaluated by principal co-ordinate analysis (PCoA) and permutational multivariate analysis of variance (PERMANOVA) performed with R (http://www.r-project.org/) based on the Bray-Curtis distance.A complex network at the OTU level (including the 30 most abundant OTUs) was constructed using Networkx 1.11 (Hagberg et al., 2008). Redundancy analysis(RDA) was employed to evaluate the relationship between AOA community structures and soil properties by using CANOCO 4.5.1(Ter Braak,1986).
2.5 GeoChip 5.0 analysis and data processing
To analyze the expression of amoA in ammoniaoxidizing microorganisms, GeoChip 5.0 (Agilent Technologies Inc., Santa Clara, CA, USA) was used in the 8 × 60 K format (Tu et al., 2014). The purified DNA (500 ng) was labeled with the fluorescent dye Cy-3 (GE Healthcare, CA, USA), resuspended into 27.5 μL of DNase/RNase-free distilled water, and then completely mixed with 42 μL of hybridization solution.Subsequently, the solution was denatured at 95 °C for 3 min,incubated at 37°C for 30 min,and then hybridized with GeoChip 5.0 array(60 K)at 67°C in an Agilent hybridization oven for 24 h.After hybridization,the slides were washed at room temperature, using Agilent Wash Buffers to remove unbound DNA. The GeoChip microarray was scanned at 633 nm using a laser power of 100% and photomultiplier tube gain of 75% with a NimbleGen MS200 Microarray Scanner(Roche NimbleGen, Inc., Madison, WI, USA). The image data were extracted by the Agilent Feature Extraction program, and the raw data were processed as previously described (Wang et al., 2014). The sum of the normalized signal intensity of amoA was used to represent the total abundance of amoA, and the abundance of amoA was calculated as the average of the total abundance of all replicates.The amoA genes in archaea and bacteria represent the abundance of AOA and AOB, respectively. The ratio of AOA to AOB amoA gene abundance (AOA:AOB) was calculated by dividing the abundance of AOA by that of AOB.
2.6 Statistical analysis
One-way analysis of variance and Tukey's honestly significant difference analysis were performed using the SPSS package 16.0 (SPSS Inc., Chicago, IL, USA)to determine the differences in the richness index of AOA communities, abundance of AOA and AOB, and AOA:AOB in BSCs at different ages. The values with P <0.05 were considered statistically significant. The Pearson correlation coefficient between soil biochemical characteristics was also calculated by SPSS.
3 Results
3.1 AOA diversity in BSCs at different ages
From 15 BSC samples, 226,997 trimmed AOA sequences with an average length of 272 bp were retrieved and clustered into 23-45 OTUs,using a threshold of 97% identity (Table S-2).The rarefaction curves showed that the sequencing depth was sufficient to reflect the total diversity in the samples (Figure 1). The PCoA and PERMANOVA tests showed that the five different ages of BSCs were divided into three groups:group 1 included 5YR, group 2 included 15YR, and group 3 included 28YR-51YR(R2=0.6128,F=20.57,P <0.01; Figure 2). Sobs index of the AOA communities showed that the richness rapidly increased between 5YR and 15YR but remained stable from 28YR to 51YR(Figure 3).
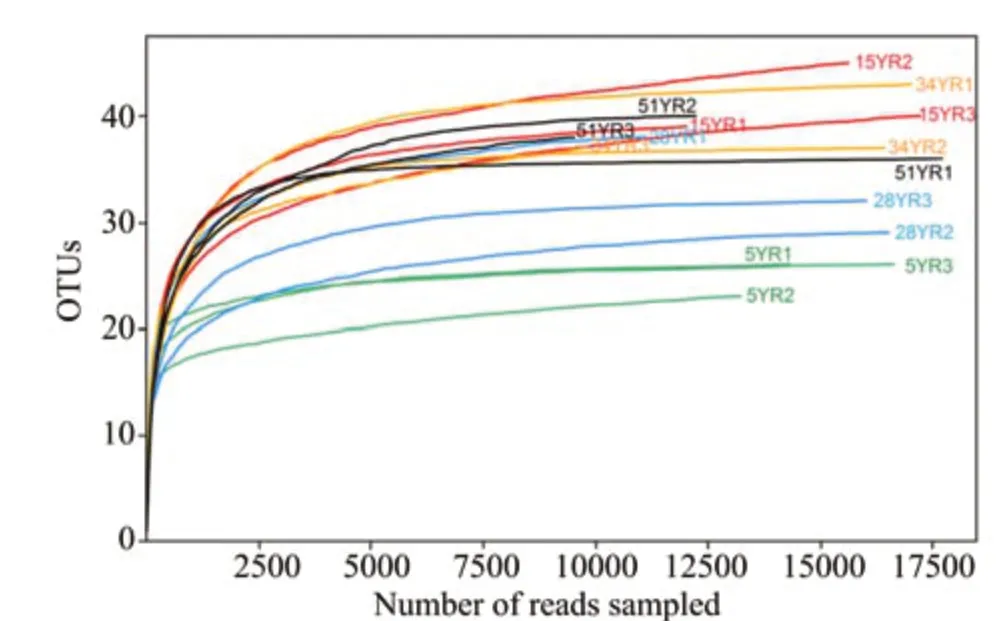
Figure 1 Rarefaction curves of the amoA clone libraries based on 97%identity in different ages of BSCs.5YR,15YR,28YR,34YR,and 51YR represents 5-,15-,28-,34-,and 51-year-old BSCs,respectively
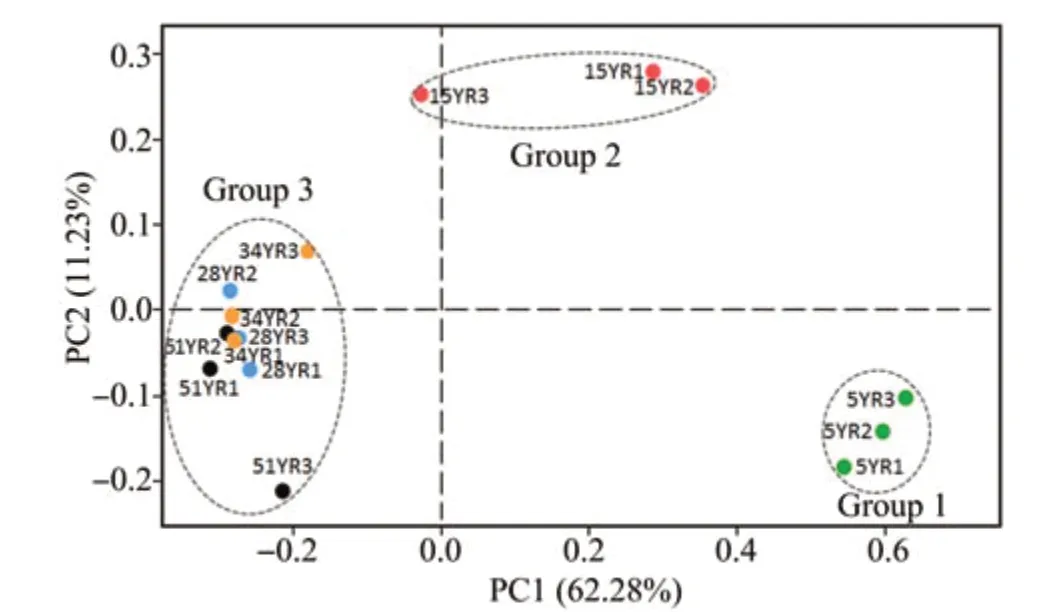
Figure 2 PCoA of AOA communities in BSCs at five different ages at the OTU level defined,based on 97%identity.5YR,15YR,28YR,34YR,and 51YR represents 5-,15-,28-,34-,and 51-year-old BSCs,respectively
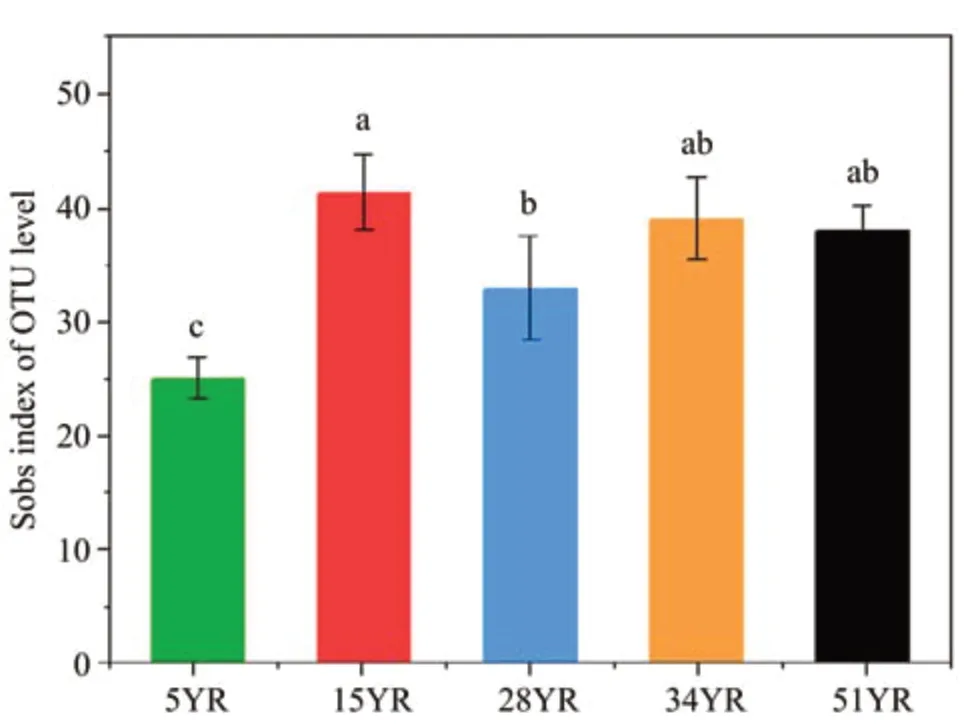
Figure 3 Sobs index of AOA communities in BSCs at five different ages at the OTU level defined,based on 97%identity.All bars represent mean±standard deviation(n=3);different lowercase letters represents a significant difference between samples(P<0.05).5YR,15YR,28YR,34YR,and 51YR represent 5-,15-,28-,34-,and 51-year-old BSCs,respectively
3.2 AOA community composition in BSCs at different ages
In the AOA communities, Crenarchaeota was the dominant phylum across all ages of BSCs,with a relative abundance accounting for 85.89% in 5YR and >99% from 15YR to 51YR (Figure 4a). The relative abundance of unclassified_norank_Archaea was as high as 11.71% in 5YR but was very low or undetectable at other BSC ages(Figure 4a).The dominant species was ammonia-oxidizing_Crenarchaeote, whose relative abundance increased from 79.44% in 5YR to 93.71% in 15YR, then remained stable at 70.85% in 28YR and 82.61% in 51YR (Figure 4b). The abundance of the species, environmental_samples_Crenarchaeota, remained stable at 6.45% in 5YR and 5.39%in 15YR, quickly increased to 28.68% in 28YR, then decreased slowly from 23.06% in 34YR to 16.79% in 51YR(Figure 4b).
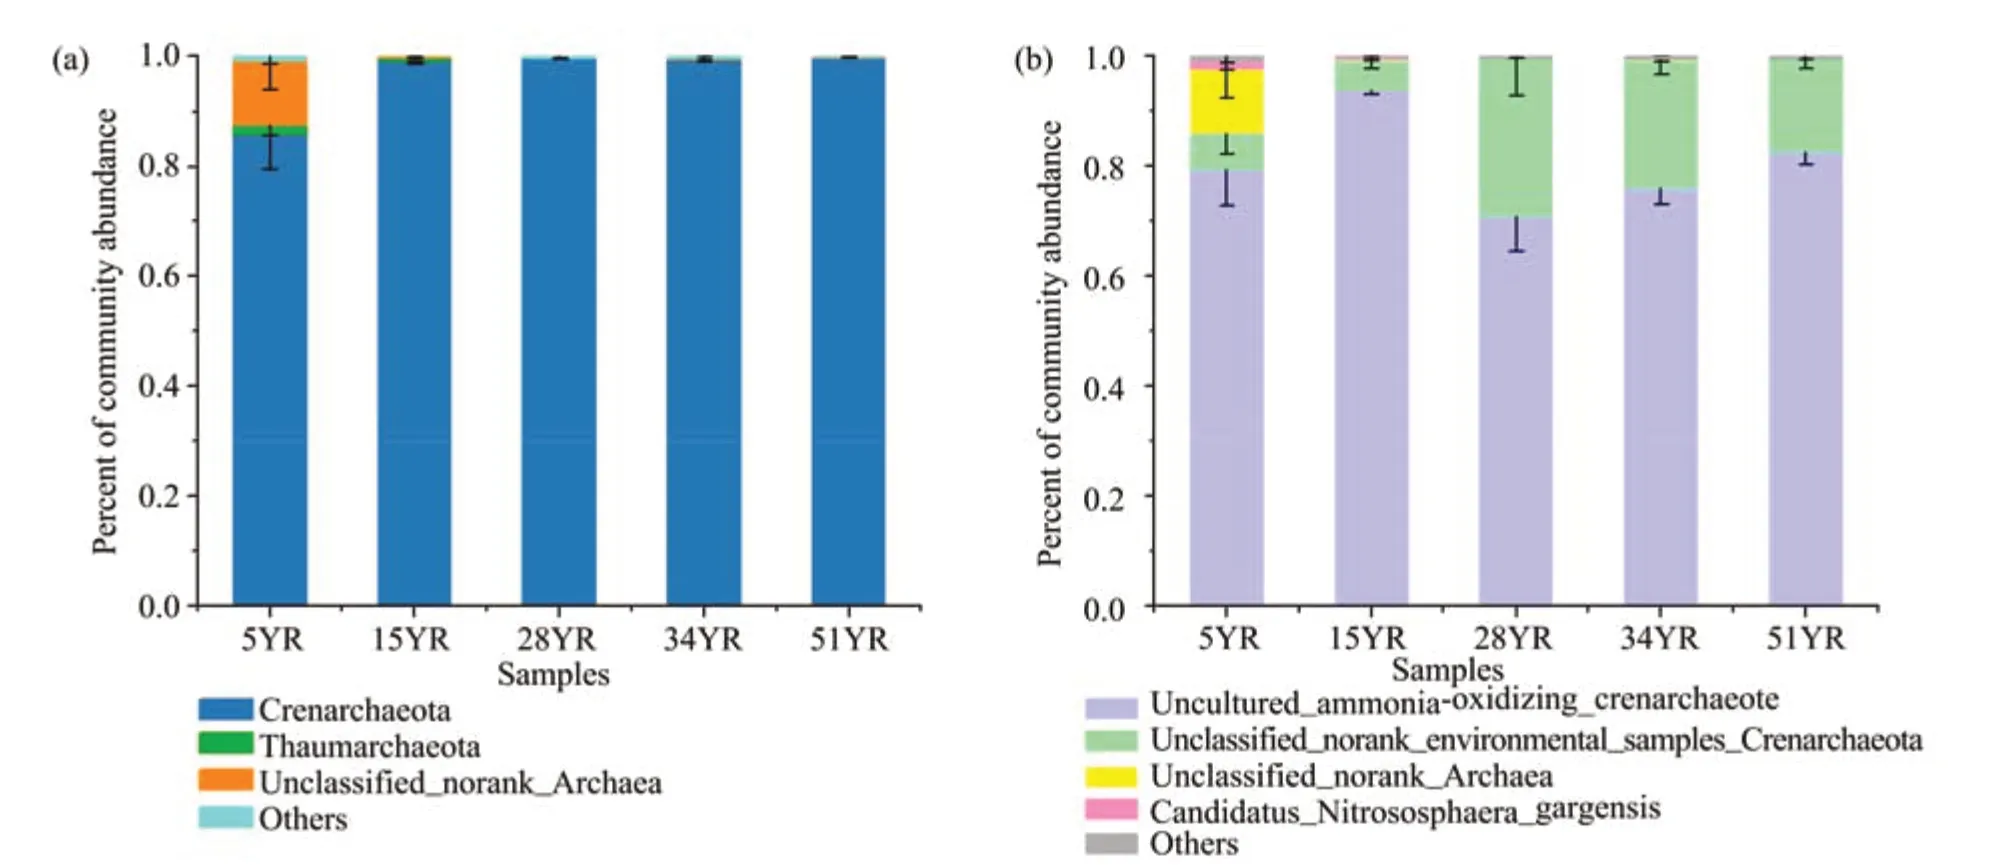
Figure 4 Composition of AOA communities in BSCs at five different ages at the(a)phylum and(b)species level.5YR,15YR,28YR,34YR,and 51YR represents 5-,15-,28-,34-,and 51-year-old BSCs,respectively
3.3 Network analysis of correlations between AOA-community classifications
To better understand the correlations between OTUs of AOA communities in five ages of BSCs,five networks were constructed and visualized,showing different network structures (Figure 5). The network of 5YR was composed of five subnetworks and showed fewer correlations between nodes, indicating loose relationships among the major classifications of the AOA community. However, the network of 51YR was composed of only three subnetworks, showing more correlations between nodes;and the positive correlations increased rapidly, illustrating close relationships and considerable positive correlations among the members of the AOA community. In addition, the networks of 15YR, 28YR,and 34YR were the transitional state from the network of 5YR to that of 51YR (Figure 5). It was clear that OTUs of Crenarchaeota were the essential nodes in these networks, and cooperative relationships between their members were reinforced during BSC succession.
3.4 Archaea and bacterial amoA genes abundance in BSCs at different ages
The succession effect on AOA's potential contribution to nitrification was studied by monitoring the abundance of AOA and AOB amoA genes using Geo-Chip 5.0. Both AOA and AOB amoA genes were detected at all ages of BSC development. The abundance of AOA significantly decreased between 5YR and 15YR, and then remained stable between 28YR and 51YR, while that of AOB significantly decreased between 5YR and 34YR. The AOA:AOB ratios were <1 in 5YR and 15YR (0.96 and 0.98, respectively) but increased significantly in 28YR,34YR, and 51YR (1.05, 1.12, and 1.02, respectively)(Figure 6).
3.5 Relationship between AOA-community structure and soil physicochemical properties
A total of 83.9% of the cumulative variation in AOA-community composition could be explained by the first four axes (as constrained by the measured soil environmental variables) of RDA(Figure 7).Axis 1 and axis 2 explained 50.0% and 18.0% of the cumulative variation, respectively. AOA compositional structures along the soil texture (the contents of sand,silt, and clay), nutrient contents (OM, TC, TN, TP,AN,AP, and C:N), and enzyme activities (UE, DHA,and IT) gradient were reflected on axis 1, where the highest correlated variables were clay (-0.8532),sand(0.8048), and silt (-0.7988) (Figure 7). Moreover,soil-nutrient contents and enzyme activities were also important environmental attributes controlling the AOA-community structure of older BSCs because they were significantly correlated with axis 1 (Figure 7). These results indicated a close positive correlation between AOA compositional structure and soil factors,except for pH and sand content.
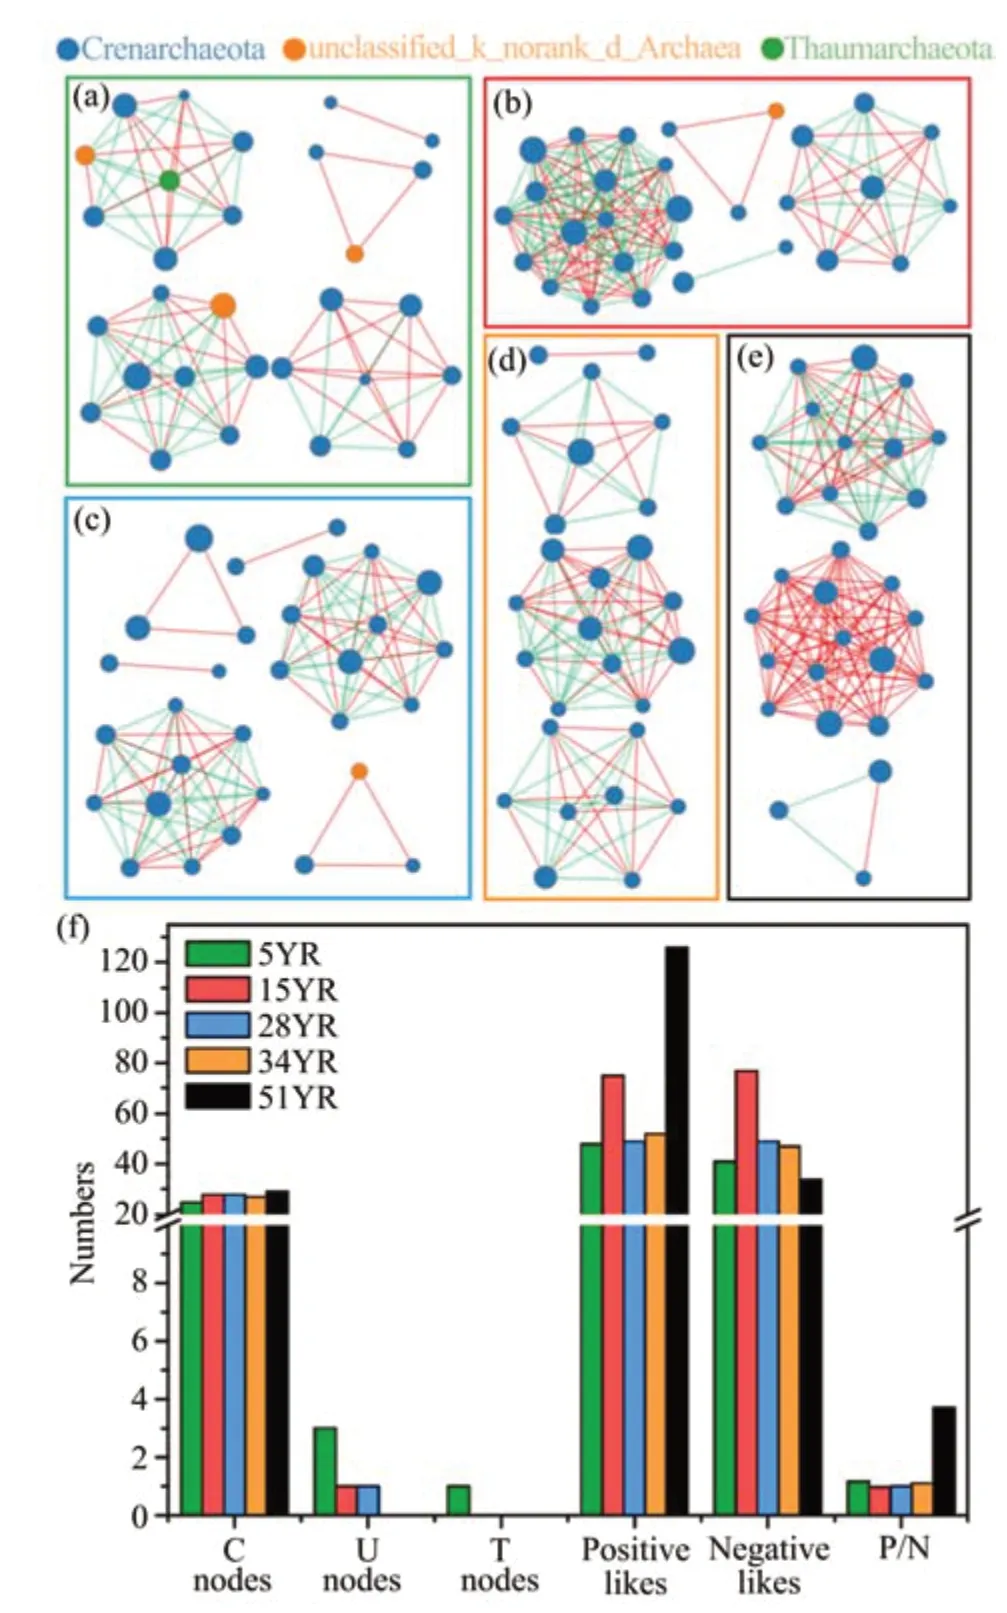
Figure 5 Network visualizations showing interactions between major categories of AOA communities in BSCs at five different ages.(a),(b),(c),(d),and(e)correspond to interactions within 5YR,15YR,28YR,34YR,and 51YR,respectively;and(f)is a brief summary of node and link numbers,and ratios of positive and negative links for five groups of subnetworks.Node sizes indicate OTU abundance.Line thicknesses represent the correlation coefficient.Red links indicate positive correlations between nodes.Green links indicate negative correlations between nodes.C nodes,U nodes,T nodes,and P/N correspond to Crenarchaeota nodes,Unclassified_norank_Archaea nodes,Thaumarchaeota nodes,and the ratios of positive and negative links respectively.5YR,15YR,28YR,34YR,and 51YR represents 5-,15-,28-,34-,and 51-year-old BSCs,respectively
4 Discussion and conclusions
Through the study of the AOA community along a revegetation chronosequence in the Tengger Desert, it was found that BSC succession had remarkable effects on the AOA community. The richness(Figure 3),relative percentage of Crenarchaeota(Figure 4a), and amoA gene abundance (Figure 6)showed significant differences between 5YR and other ages of BSCs. Combined with previous studies,these findings were mainly due to the changes in soil environmental conditions,which were the most influential external variables affecting the composition and ammonia-oxidation capacity of the AOA community (Lozupone and Knight, 2005; Jesus et al.,2009) and increased with BSC development (Figure 7), especially during the early successional stages of BSCs (the first 15 years) (Li et al., 2007). Like the variation trend of AOA richness, the relative percentage of Crenarchaeota in 5YR was significantly lower than that in the others. This finding might probably because Crenarchaeota was the dominant phylum in the AOA community with limited internal resources,which made the smaller taxonomic unit (unclassified_norank_Archaea, and Thaumarchaeota) vulnerable to being replaced by Crenarchaeota (Feng et al.,2017). However, the changes of amoA gene abundance of the AOA community were different from those of their richness between 5YR and 15YR. This finding may be mainly because the increased AOA richness improved the stability of their structure(Van der Heijden et al., 1998), which in turn ensures the function of the AOA community. In addition, we found that BSC succession improved the cooperative relationships between the dominant classifications of the AOA community (Figure 5), enabling them to avoid competition for limited resources and space,and to adjust rapidly when the ammonia-oxidation function was affected (Tilman and Downing, 1994;Feng et al.,2017).
Previous study revealed that only when the ratio of the AOA:AOB biomass or cell abundance exceeds 10 can we derive that archaea outcompete bacteria in oxidizing ammonia (Prosser and Nicol, 2012). Thus,in our study, we concluded that AOA and AOB were equally important for ammoxidation in a 51-year BSC succession. Furthermore, another interesting finding was that AOA amoA gene abundance was affected by environmental changes between 5YR and 15YR,while that of AOB were negatively affected by BSC succession between 5YR and 34YR, indicating that the ammonia-oxidation function of the AOB community was more sensitive to environmental changes than that of the AOA community in the desert ecosystem (Chen et al., 2015; Jiang et al., 2017) (Figure 6).In addition to regulation of the AOA community's richness and compositional relationship, the ammonia transporters of AOA were markedly different from those of AOB and were highly variable,leading to the adaptation of AOA to different microhabitats (Offre et al.,2014).
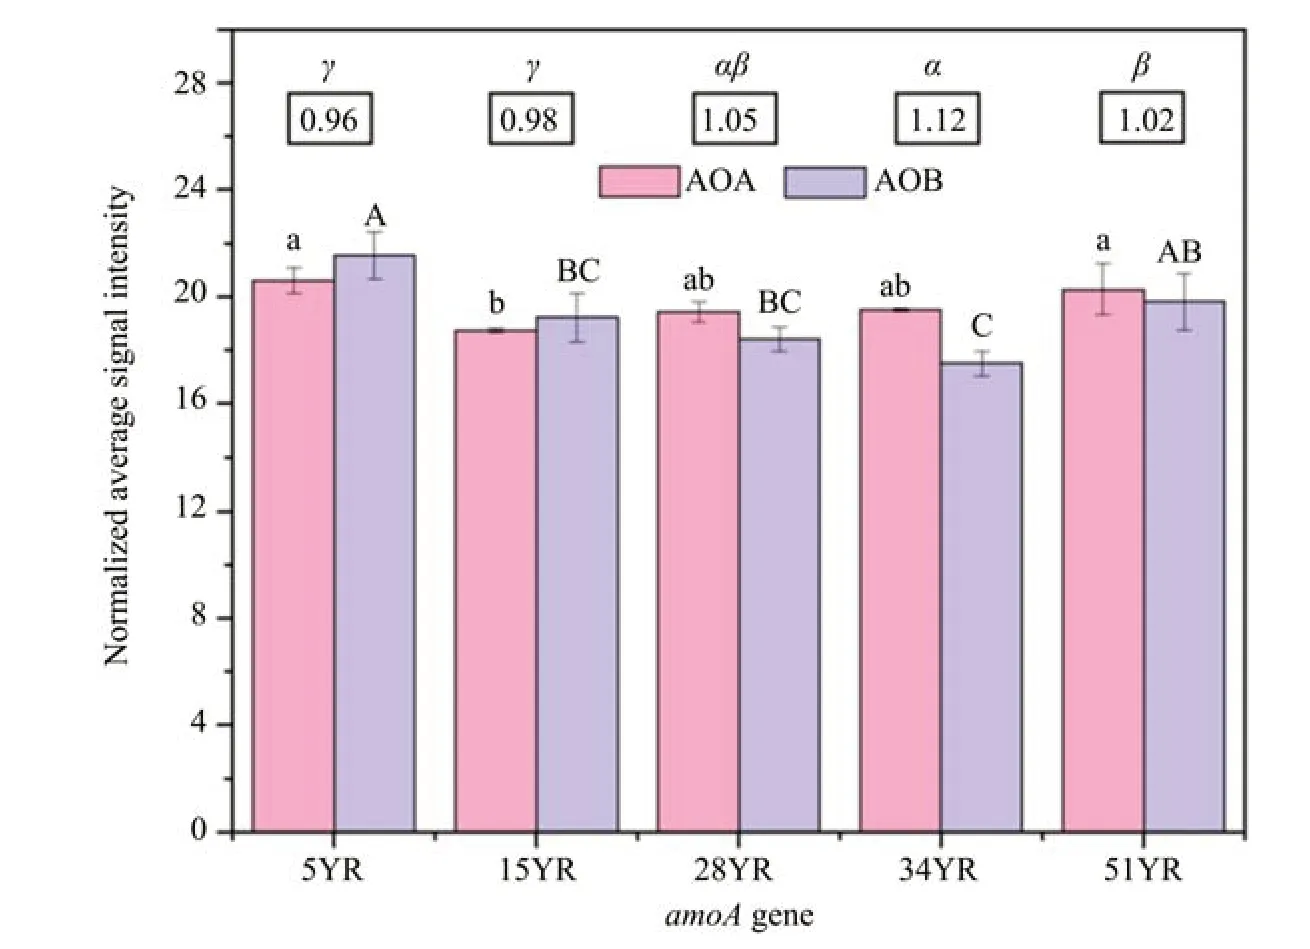
Figure 6 Archaea and bacterial amoA genes abundance among BSCs at different ages.The ratios of AOA to AOB amoA genes abundance(AOA:AOB)are shown in the boxes above the chart.All bars represent mean±standard deviation(n=3);different lowercase letters,uppercase letters,and Greek letters represent significant differences between AOA abundance,AOB abundance,and the ratio of AOA:AOB(P<0.05),respectively.5YR,15YR,28YR,34YR,and 51YR represents 5-,15-,28-,34-,and 51-year-old BSCs,respectively
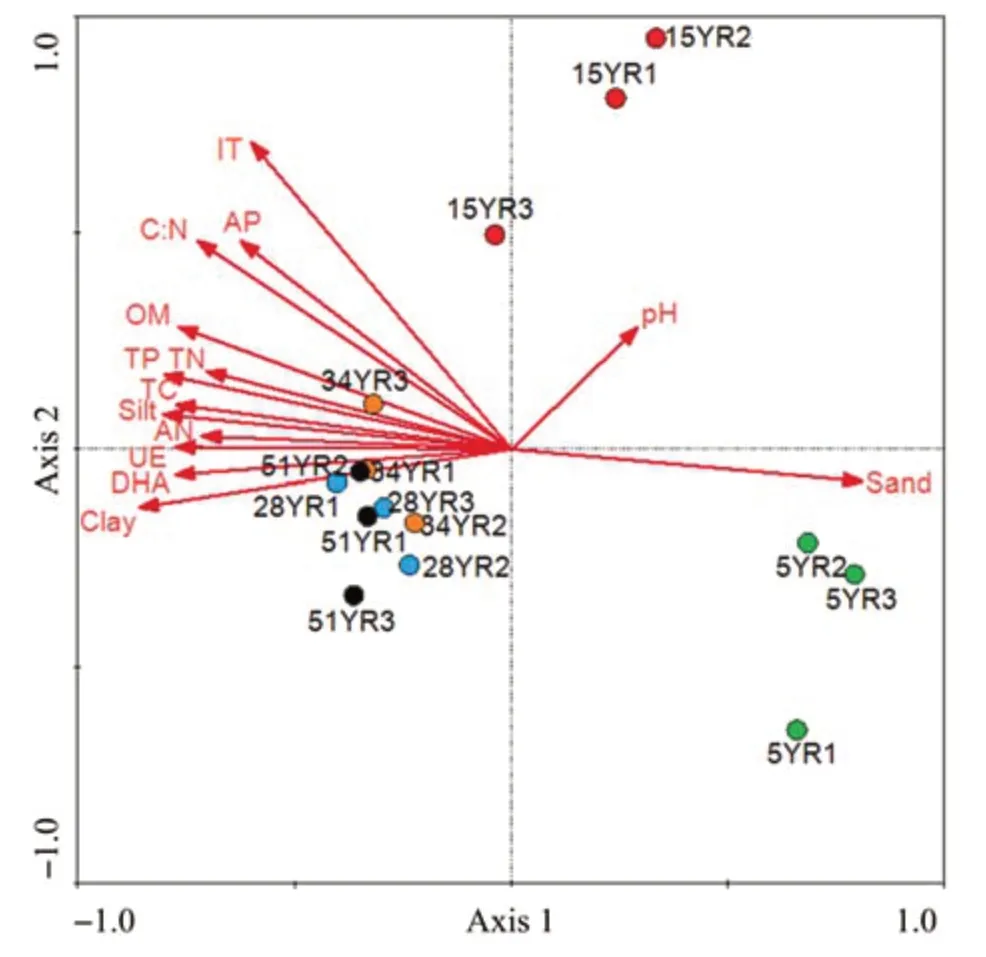
Figure 7 RDA of soil biochemical characteristics in relation to AOA compositional structures.Each dot represents the AOA community in each sample.Red arrows indicate the direction and magnitude of the impact of environmental factors on the AOA community,and the length of the red arrow indicates the intensity of the correlation.5YR,15YR,28YR,34YR,and 51YR represents 5-,15-,28-,34-,and 51-year-old BSCs,respectively
Owing to their vast richness, biomass, and abundance,microbial communities can respond to environmental changes more quickly than other organisms(Fierer and Jackson, 2006; Harris, 2009; López-Lozano et al., 2013). Our results show that the AOA community of BSCs changed with the improvement of soil texture, soil-nutrient contents, and soil-enzyme activities in the early successional stages of BSCs, especially the content of sand, clay,and silt in the Tengger Desert (Figure 7). Soil texture has been proved to be the main factor affecting soil physicochemical properties (e.g., Six et al., 2002) and has a close relationship with the ability of soil to retain moisture(e.g., Rawls et al., 2003). Consistent with other literature (Parton et al., 1989;Andrés et al., 2016), our research found that clay and silt contents were positively correlated with soil-nutrient contents, while the sand content was the opposite (Table S-3). Furthermore,we found that soil texture was also closely related to the soil biological characteristics,mainly reflected by strong correlations with the key enzymes of C and N cycling (IT and UE) and the indicator of soil microbial activity (DHA) (Table S-3). Thus, changes of the AOA community were jointly affected by the combined effects of BSC succession and soil-texture improvement; and the AOA community in turn improved the soil biochemical characteristics.
Overall, this study investigated the successional effects on compositional structure and ammoxidation activity of the AOA community along a revegetation chronosequence in the Tengger Desert. The results showed that the richness, composition, and amoA gene abundance of the AOA community were significantly different between 5-year-old BSCs and older BSCs;and network analysis revealed that the cooperative relationships were reinforced in AOA communities during BSC succession. Moreover, the main environmental factors driving the above changes were soil textures, which were closely related to soil biochemical properties. These findings demonstrated that the shifts of AOA-community structure induced by soil texture accelerated the recovery of ammoxidation activity, promoted N cycle, and supplied more available N for desert ecosystems.
Acknowledgments:
This work was supported financially by the Strategic Priority Research Program of Chinese Academy of Sciences (Grant No. XDA2003010301) and the National Natural Science Foundation of China (Grant No.41621001).
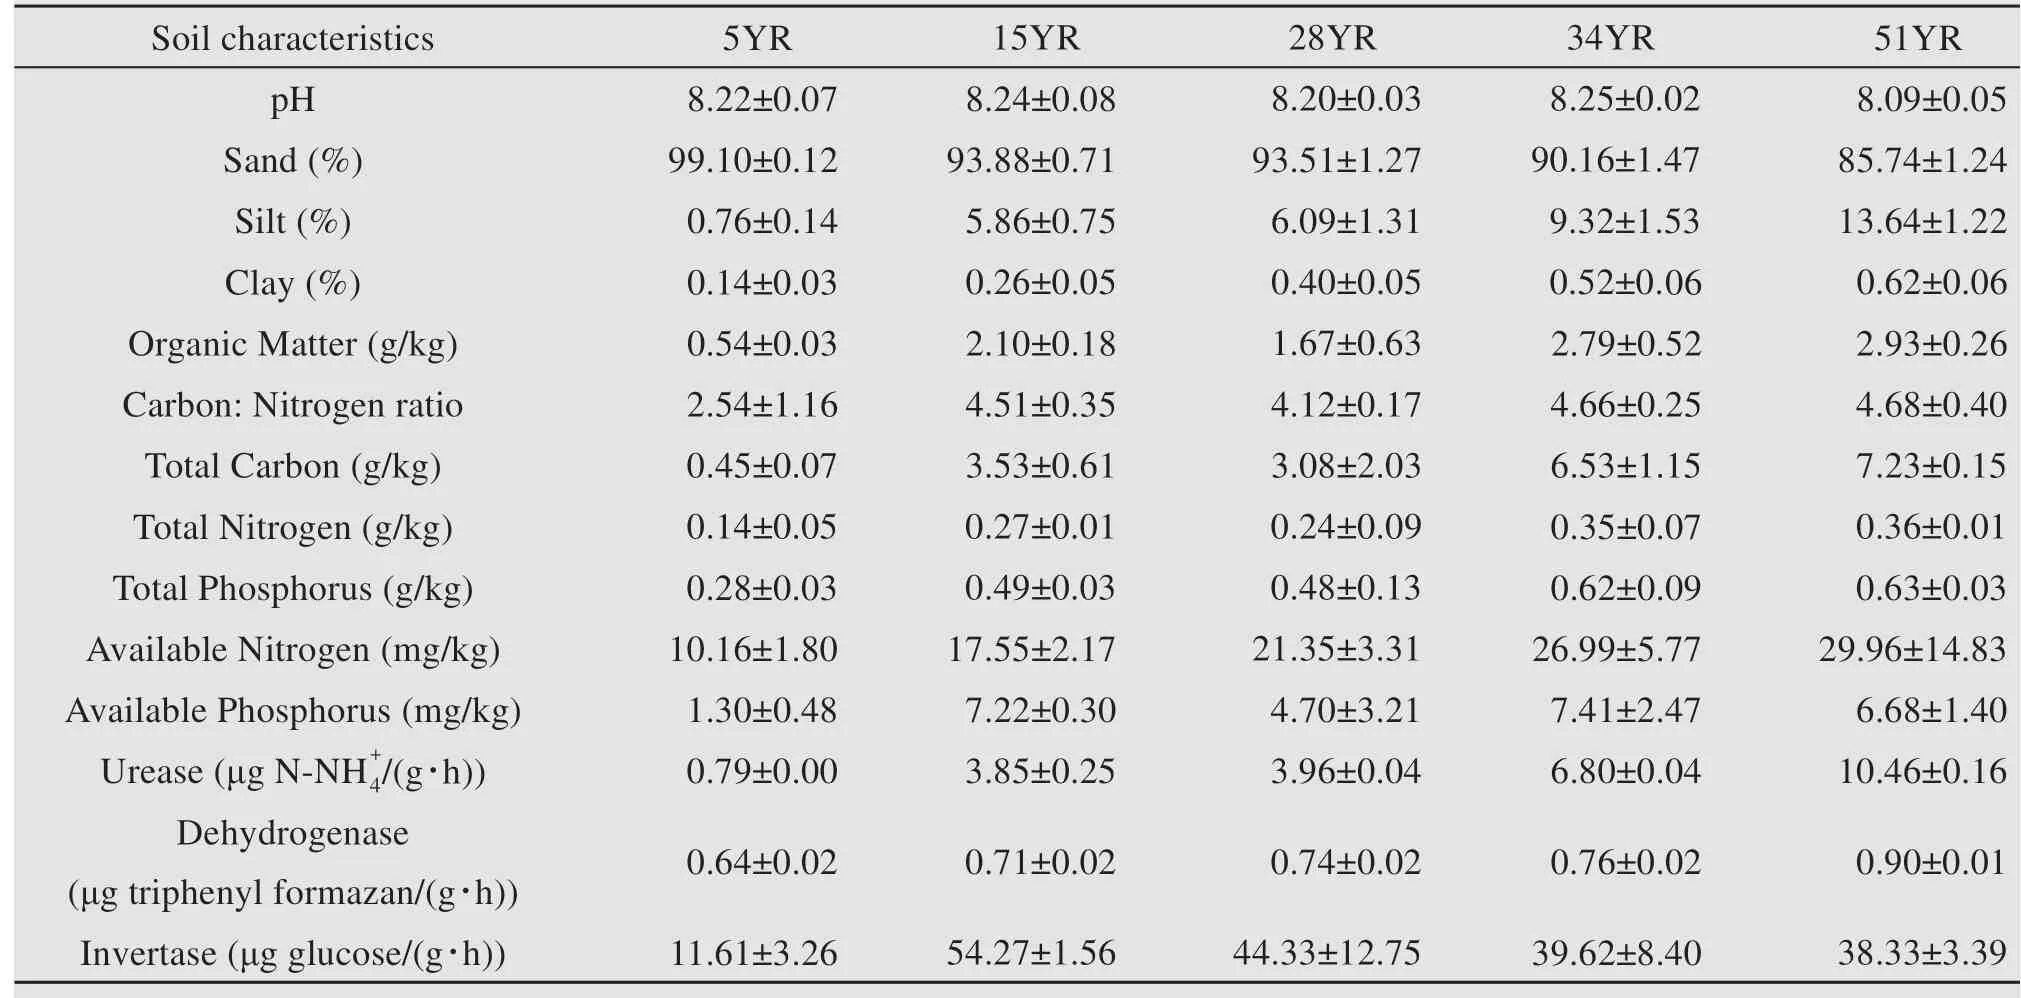
Table S-1 Soil characteristics of topsoil(0-5 cm)under BSCs in revegetated areas.5YR,15YR,28YR,34YR,and 51YR represents 5-,15-,28-,34-,and 51-year-old BSCs,respectively
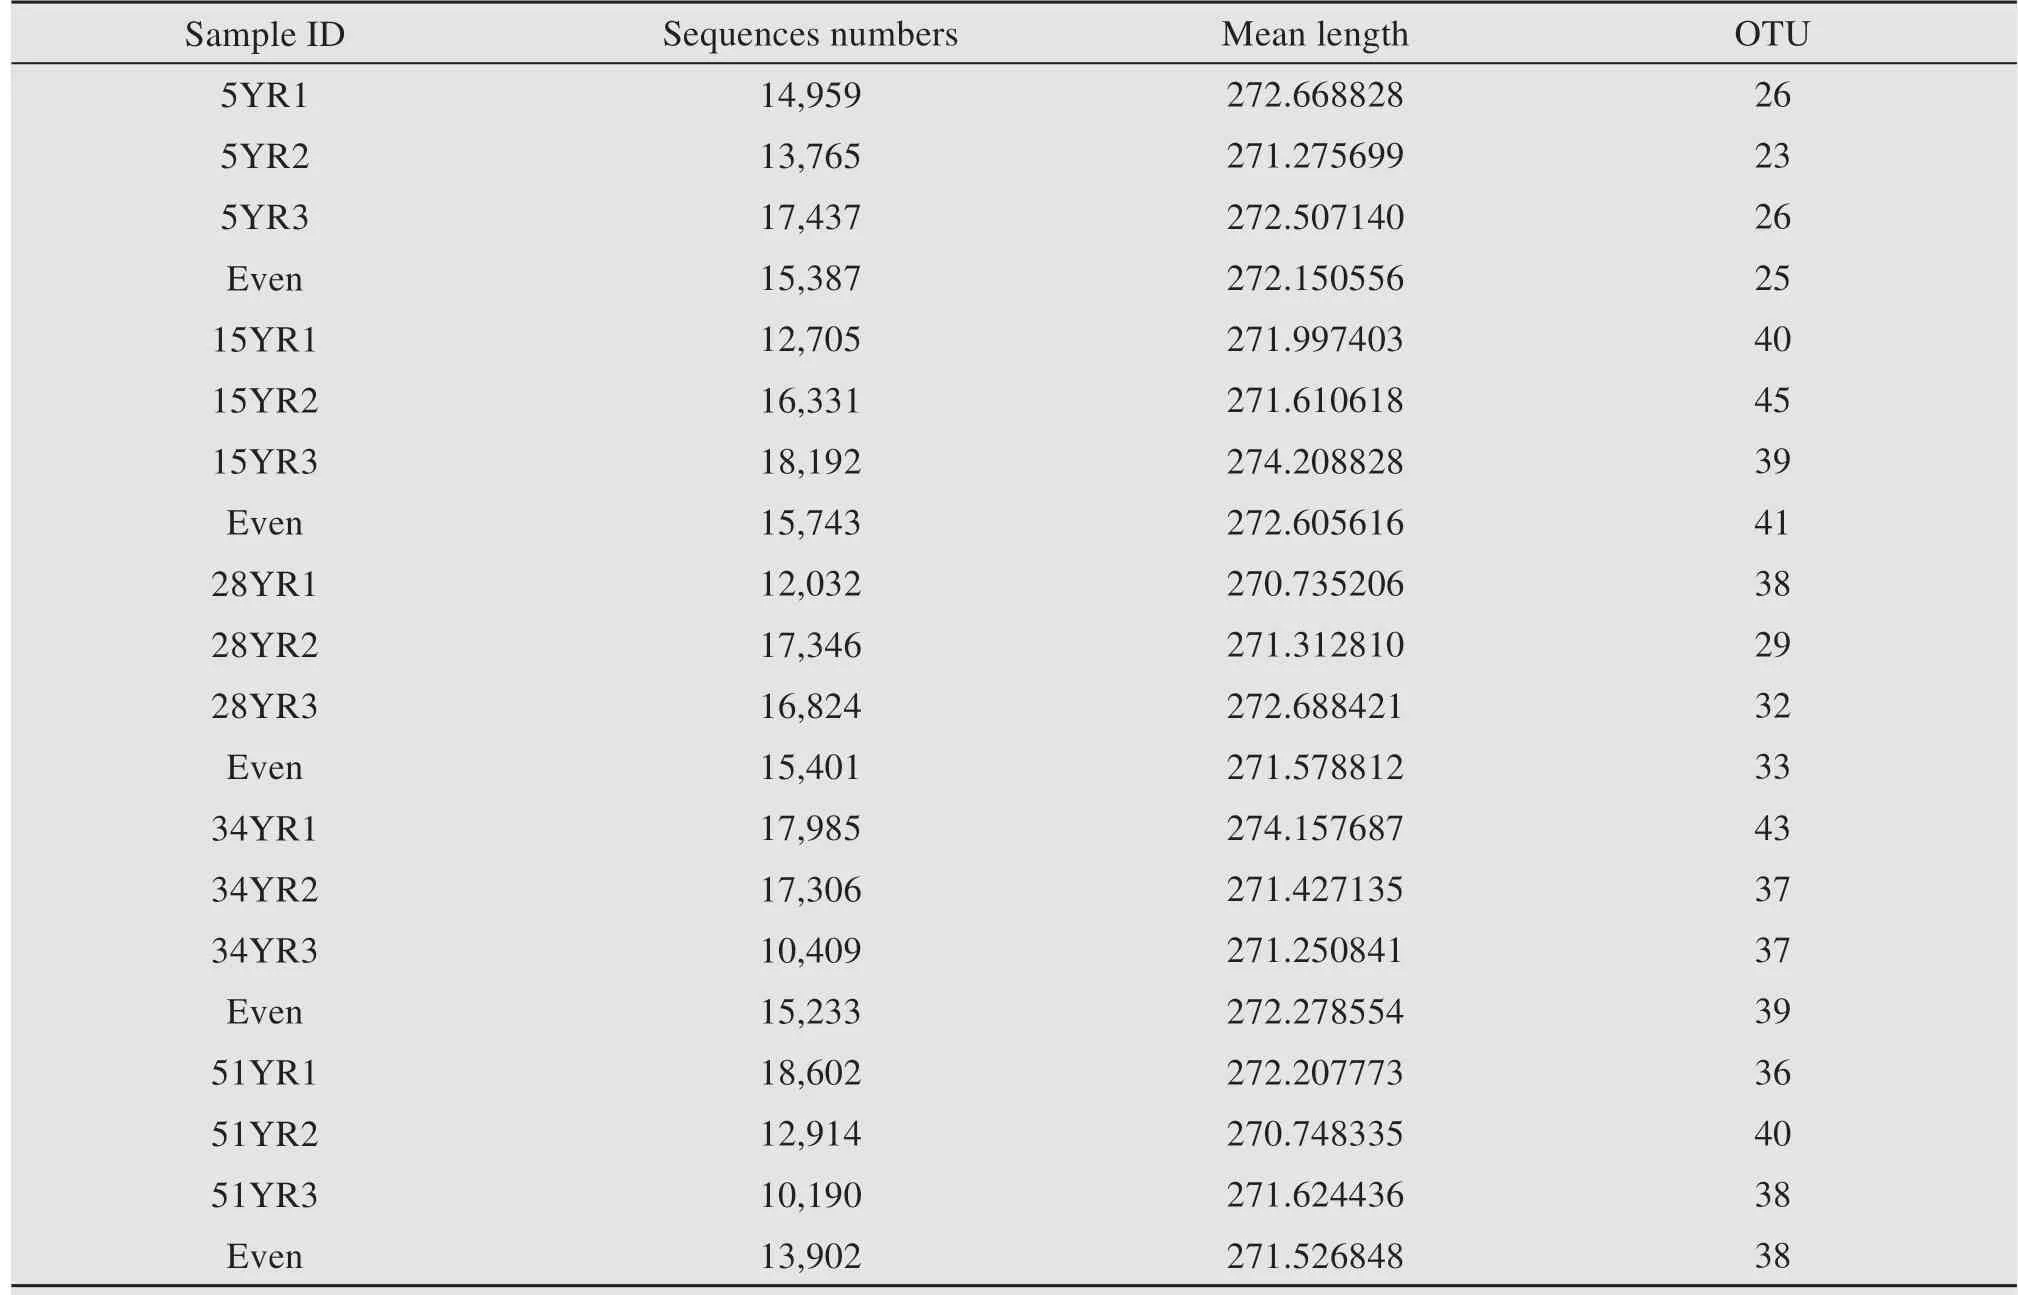
Table S-2 Sequence information from all samples.5YR,15YR,28YR,34YR,and 51YR represents 5-,15-,28-,34-,and 51-year-old BSCs,respectively

Table S-3 The Pearson correlations between soil biochemical characteristics of the topsoil(0-5 cm)under BSCs
 Sciences in Cold and Arid Regions2019年2期
- Sciences in Cold and Arid Regions的其它文章
- Effects of freeze-thaw cycle and dry-wet alternation on slope stability
- Analysis of vegetation changes and dominant factors on the Qinghai-Tibet Plateau,China
- Holocene climatic change reconstructed from trace elements of an aeolian deposit in the southeastern Mu Us Desert,northern China
- The establishment and development of Haloxylon ammodendron promotes salt accumulation in surface soil of arid sandy land
- Editors-in-Chief Guodong Cheng and Ximing Cai
- Review on simulation of land-surface processes on the Tibetan Plateau