TOD residents'attitudes toward walking to transit station:a case study of transit-oriented developments(TODs)in Bangkok,Thailand
Pornraht Pongprasert·Hisashi Kubota
Abstract The study aims to analyze the attitude toward walking to the stations of residents living within 1 km of transit stations,or they are called transit-oriented development(TOD)residents.They are highly expected to walk to transit station and use rail in their daily travel.In this research,249 respondents are asked 10 questions on attitudes of walking to station.The analysis was conducted in two stages:factor analysis and structural equation model.As the current access mode of respondents,walkers are more likely to be low-income households.People using motorized mode are mostly from middle-to high-income,households the largest group of respondents.For walking acceptance,high-income group accepts distance and time shorter than other incomes.Low-income households can accept the longer walking distance but shorter time.Middle-income households are more likely to walk in shorter distance than lower-income households,but they tend to accept longer walking time than others.As for the analysis results,the feeling of walking among allrespondents significantly in fluences the walking acceptance.The benefit of walking significantly in fluences walking acceptance only among middle-income households.The walking attitudes on convenience,safety,a sense of freedom, healthiness, and environmental
Keywords Attitude·Walking·TOD residents·Walking acceptance·Travel-related attitude·Transit-oriented development friendliness highly affect respondents'acceptable walking distance and time in TODs.
1 Introduction
The main goal of transit-oriented developments(TODs)is to stimulate active travel and especially transit ridership,and perhaps also to limit urban sprawl.Moreover,this land-use planning concepts create the compact,walkable,pedestrian-oriented,mixed-use communities surrounding transit systems[1].These perspective policies increase citizen's house ownership,merge low-income households into one group,stabilize the workforce,and increase rail ridership.Several previous studies found that low-income households are more transit dependent.They own less cars than others.Then,they tend to use transit more than middle-and high-income groups.Low-income households also use rail services during non-peak hours in TOD areas(a dense,walkable,residential,and commercial area built to support and encourage the access to public transit)[2].This makes transit service more efficient.The more the number of people using mass transit grows,the worse the congestion becomes.Mixed-income residents in TODs is the main factor proving that the highest percentage of transit riders access transit by placing a range of housing options within walking distance.In mass transit systems in Bangkok nowadays,there are three rail lines operating 60 stations with the total route of 85.6 km.The first line(sky train line:BTS)began operation in 1999.Second(underground train line:MRT)and third lines(Airport rail line:ARL)started in 2004 and 2010,even though the growth of high-rise residential buildings along transit route is much higher because of transit lines expansion.According to recorded data,the number of residential units grew higher from 3,000 to around 48,000 units within 5 years(2004—2009)[3].Many residents are attracted to live near transit station.They are expected to walk to transit station and use rail services in daily commute.However,it has not yet achieved the expectation.Some studies found that 40%of of fice employees in Bangkok go to work by auto vehicles[4].Moreover,most residents near transit earn high income and depend on car but only 33%of them use rail.According to recorded data,daily rail ridership of BTS,MRT,and ARL is approximately 630,000,255,000,and 47,000 riders,but they are now much lower than the target of 680,000,570,000,and 95,900 passengers[5].One problem of low-transit ridership is that transit access is not comfortable in TOD areas.Walkability is not good enough.There are some previous researches related to TOD residents'perception on pedestrian characteristics around transit station in Bangkok.Sansila[6]studied pedestrian behavior of 78 people living within 500 m around Punwitee BTS station and found that most people in the distance within 300 m are happy to walk to Punwitee station.The trend of walking to transit station is lower because people feel uncomfortable to walk and are not sure of pedestrian's safety(25%and 20%of respondents in total,respectively).Of the respondents,68%perceive that there are several obstacles to use sidewalks.73%suggest that sidewalks are very narrow,54%feel uncomfortable to walk because of rough pedestrian surface,36%mention about the unlivable sidewalks,and 62%think that pedestrians are not good enough to walk to station.In the other research by Chinorak[7],she studied 67 respondents living near Onnut BTS station(one of the major stations of sky train system)and found that 75%of respondents live in condominiums,65%of them use transit and only 40%walk to access the transit station.The trend of walking to transit continuously decreases.This research also found that the problems of narrow sidewalks,safety,and pedestrian obstacles such as motorcycle taxis parking and riding on sidewalks should be tackled soon.In the research by UDDC[8],it concludes that the current pedestrian environments in Bangkok have quite poor quality and are not attractive enough to walk.The summary of the main problems of pedestrians around transit stations includes(1)several obstacles to use sidewalks,(2)lack of well-equipped walking paths for pedestrians,and(3)too dim light during the night.It can be implied that most of station-area residents in Bangkok prefer to live near transit station but they do not want to walk to transit stations.Apart from studies on factors affecting travel modal choice,investigating the in fluences of residents'travel attitudes is necessary.The relation of attitude,intention,and behavior will be studied in this paper.If people have positive attitude on walking to transit station,they will pay higher intention and tend to walk longer distance and with longer time.Supposedly,walking attitudes of people in different income groups are not exactly similar.Low-income people are probably worried more about travel cost than any other aspects.Middle-to high-income groups might be more aware of comfort and safety while walking.In addition,they are not attracted by greenery environment around.However,the feeling of residents toward walking,pedestrian facilities,and built environment around transit station strongly in fluences their decision to walk to station and walking acceptance.The benefits of walking to station include air-pollution reduction,travel-cost saving,and greenery neighborhoods.Hopefully,the study results here would be helpful for urban land-use developmentpolicy-making including pedestrian-oriented design and built environment around transit station,in order to increase walkability and walking acceptance of TOD residents(the people who live in the TOD areas and they are encouraged to walk and use transit)in Bangkok.
2 Literature review
TOD is an urban planning concept suitable for urban development and sustainability through creating the highdensity,compact,and mixed land-use development near public transportation services.The travel-related attitudes and residential self-selection can affect mode choice behaviors in TOD areas[9].Cao et al.[10]stated that people who like to walk also like to live in walking-oriented places.Schwanen et al.[11]studied the factors affecting commute mode choice and they concluded that if the people live in a walking-oriented place,they might discover that they like to walk.De Vos et al.[12]studied the in fluence of residential dissonance on travel behavior and they suggested that the walking,bicycling,and the use of public transit can be explained by travel-related attitudes and land-use preferences.The rural dissonants are more capable of realizing their preferred travel behavior than urban dissonants.The decrease in the level of dissonance in TOD areas increases mode shifting behavior to public transportation and active travel[13].For TODs to be successful,a key factor in planning the concept is to have easy access to transit stations[14].Pedestrian-oriented design would encourage station-area residents to drive their car less and ride mass transit more.Likewise,if station-area residents prefer to walk and bike more,the transit ridership would definitely increase.As for the in fluences of pedestrian-oriented environment on walking or biking to station oftransitriders,Cervero [15]found that85% of Californians living in half-mile of rail stops mostly walk to station.He also found that high car-ownership levels strongly deterred walking and biking access while the neighborhood design variables regarding street connectivity indices,retail shops,residential densities,presence of street trees,and furniture would have in fluenced the willingness of station-area residents to walk or bike to stations.Transit riders with high incomes were generally more likely to walk or bike to a station.In other researches,Loo et al.[16]investigated the factors affecting weekday railway use in Hongkong and New York.They found that station characteristics regarding being interchange stations and the distance to midtown appeared to be relatively more important than other dimensions of land use,socioeconomic,and inter-modal competition in affecting railway use.The interchange stations provide higher accessibility to other stations.Better network connectivity can increase transit ridership.In Bangkok,Pongprasert and Kubota[17]studied how to reduce the automobile ownership and use of 322 residents within 1-km radius of stations.They found that difficulty of transit access especially,residence situated in narrow streets,in fluences car use and car-parking availability significantly and hence affects car ownership.It can be said that these factors discourage transit use of TOD residents in Bangkok.Fan et al.[18]studied the land use and travel demand in regards to the effectiveness of two transit station area development policies,park-and-ride(PNR)and TOD.They found that deployment of new PNR and new TOD can increase the transit ridership and reduce the vehicle kilometers traveled(VKT)/vehicle hours of delay(VHD).
According to previous studies,catchment area is defined as the maximum distance or acceptable distance people are happy to walk from home to station.The pedestrian radius of 500—1000 m around transit station is normally recommended for TODs design and planning because it is the range of distance station-area residents can walk to rail station in one way.Vuchic[19],Rood[20],and Regional Plan Association[21]define catchment area as a circular surface with a radius of 5-min maximum walking distance from the center of activities or 10-min walking from rail station.A 5-min walking is 400 m equivalent;so,a 10-min walking equals 800 m.These areas include mixed uses,pedestrian connections,and traffic calming design.NJTransit[22]states that the reasonable walking distance of residents near transit station in New Jersey is required based on general understanding of willingness to walk 5—15 min to get to or from transit stop,corresponding to 400—800 m.But it depends on topography,safety,and surrounding activities around transit stations.O'Sullivan et al.[23]found that,in Calgary,Canada,the average walking distance to transit station is 649 m with a 75th percentile distance of 840 m.At CBD stations,the average walking distance is 326 m and the 75th percentile distance is 419 m.There are other definitions of maximum walking distance;for example,in Great Britain,over 70%of all walking per one way was shorter than 1,600 m[24].Stringham[25]found that the average maximum walking distance of rail passengers in Toronto,Canada,was about 1,200 m.Rastogi and Rao[26]studied the maximum walking distance of rail passengers in Mumbai,India.They reported that 85%of rail passengers were comfortable with a maximum distance of 1,250 m.Lee et al.[27]studied subway accessibility of people in new towns in six metropolitan areas of Korea.They found that 93.7%acceptedmaximum walkingdistanceof732—762 m,equivalent to 10-min walk with an average walking speed of 1.22—1.27 m/s.Pongprasert and Kubota[28]studied the transit station access of residents living near transit within 1 km.They found that the average acceptable walking distance and time of walkers to transit station are 498 m and 9.10 min.In addition,they also found that income significantly in fluences TOD residents'motorcycle taxi use to transit station.However,acceptable walking distance was different depending on geographical condition,climate,land-use characteristics,and walking preferences[29].Moreover,developing public spaces and pedestrian network connectivity encourages people to walk longer[30].Based on previous researches,the catchment area in this study is within a radius of 1,000 m of rail stations.
Attitudes are defined in various terms.The most mentioned one is by Eagley and Chaiken[31],who define attitude as the psychological tendency expressed by evaluating a particular entity with some degree of favor or disfavor.According to this definition,evaluating refers to affective and cognitive responses.As for the attitude toward behavior,the theory of reasoned action(TRA)is used as a conceptual model of study on relationship between attitude and behavioral intention in several researches.It is a well-known concept by Fishbein and Ajzen[32].This theory was in turn grounded in various theories of attitude.The theory of reasoned action states that if people evaluate the suggested behavior as positive(attitude)and if they perceive the social pressure to perform the behavior(subjective norm),this results in higher intention and they are more likely to do so as shown in Fig.1.In the paper,this model can be used to illustrate the relationship between attitudes of walking to transit station and behavioral intention which is identified as acceptable walking distance and time of TOD residents.
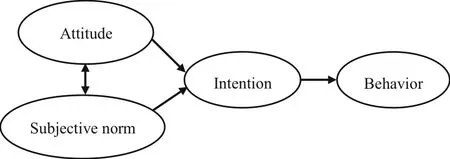
Fig.1 Theory of reasoned action[32]
Karash et al.[33]studied the relationship of attitude,intention,and behavior on walking and using public transportation of residents living in compact neighborhood areas.They found that positive attitude regarding the perceptions on improved reliability of the public transportation system,good health and environmental effects of walking longer,and pedestrian safety could increase walking and encourage public transportation use.As for the attitudes on walking to station,El-Geneidy et al.[34]investigated that the 85th percentile walking distance to transit service of pedestrians in Montreal of Canada was around 1,259 m.Walking distances depend on route and trip qualities such as transit services types,transfers,and waiting time.It also depends on personal,household,and neighborhood characteristics.Bicycle Federal of America[35]identified that acceptable walking distances depend on trip purpose,total travel time,physical condition of the pedestrian,walking environment,perception on safety and security of walking route,and economic factors.Walker[36]investigated how far rail passengers would be happy to walk to transit.He found that stop spacing,network structure,travel time,reliability standards,and frequency of transit services in fluence acceptable walking distance to station.Russonello and Stewart[37]studied the attitudes toward walking to transit of American people.They found that Americans preferred to walk to stations for exercise,relaxation,and fun.As for the guidelines on journeys on foot,Institution of Highways and Transportation[38]stated that the acceptable walking distances would depend on various factors such as individual's fitness and physical ability,encumbrances or the sense of freedom,cost and convenience of transport modes,time saving,journey purpose,and personal motivation.Gehl[39]mentioned in the book of ‘‘Cities for people''that walking distance depended on how people feel about walking.The Landcaster Environment Center[40]studied the attitudes to walking of pedestrians in Britain's urban areas and found that walking distance of pedestrians in four English towns(Leeds,Leicester,Worcester,and Lancaster)was positively associated with enjoyment,personal health,saving money,reduced local air pollution,and climate change.The key problem associated with walking was the risk of exposure to wet or windy weather,which was the main reason for not walking.
As concluded,according to the reviews,the attitude toward walking and acceptable walking distance of stationarea residents is associated with enjoyment,relaxation,comfortable walk,exercise,cost saving,freedom,physical conditions of pedestrian,walking environment,safety,and security.In addition,walking is a hot trend in Bangkok nowadays,judging from the number of running and walking events in Bangkok in 2016.It is around 40%higher than in 2015.
3 Data description
3.1 Respondents'characteristics
As for the summarized data of respondents'characteristics in Table 1,most respondents are female(62%),single(78%),middle-young age(64%),and of fice workers(54%);70%of them do not have car at home.The monthly income of respondents on average is 42,068 baht(1145 USD).The largest groups of respondents are people from middle-income group(20,001—50,000 baht/month)and high-income group(>50,000 baht/month),accounting for 48 and 27% of the total respondents.Low-income respondents(<20,000 baht/month)are the smallest group(25%).They have an average transit-access distance of 428 m.Among three access modes of respondents(walk,motorcycle taxi,and other transport modes such as bus,songthaew(a pickup truck like a shared taxi with tworowed seat),private car,taxi and van),the highest proportion of access mode is walking,62%.The share of motorcycle taxi is in the second,22%,and the share of other access modes is 16%.Most walkers are younger,from single household,and earn lower income.The rate of car ownership is also lower among walkers.Students prefer walking to station to other modes.Motorcycle taxi riders tend to be females,of fice employees,and from middleincome households(20,001—50,000 baht/month),35%of whom own at least one car at home.Respondents who are males,from married groups,in middle-adultage(40—64 years old),of fice employees,and have middle to high income(>20,000 baht/month)prefer other motorized vehicle modes to transit transportations,compared to walking and using motorcycle taxi to station.
The data collected between online(60 respondents)and on-the-road surveys(189 respondents)are similar.As for online survey,the respondents are females(60%),single(80%),possessing no car(70%),of fice employees(37%),and from middle-income households(43%).As for on-theroad survey,the respondents are exactly the same as online survey.Most are females(62%),single(77%),possessing no car(67%),of fice employees(60%),and from middleincome households(50%).
The summarized characteristics of respondents is the same as other researches,e.g.,[3],which mention that most residents near Bangkok transit stations are from middleincome group,at young adult age(31.37 in average),and females.Therefore,people in Bangkok's TOD areas who are younger and earn lower income prefer to walk.Car ownership rate is lower among these walkers,too.Middleto high-income groups choose motorized access modes instead of walking to transit stations.
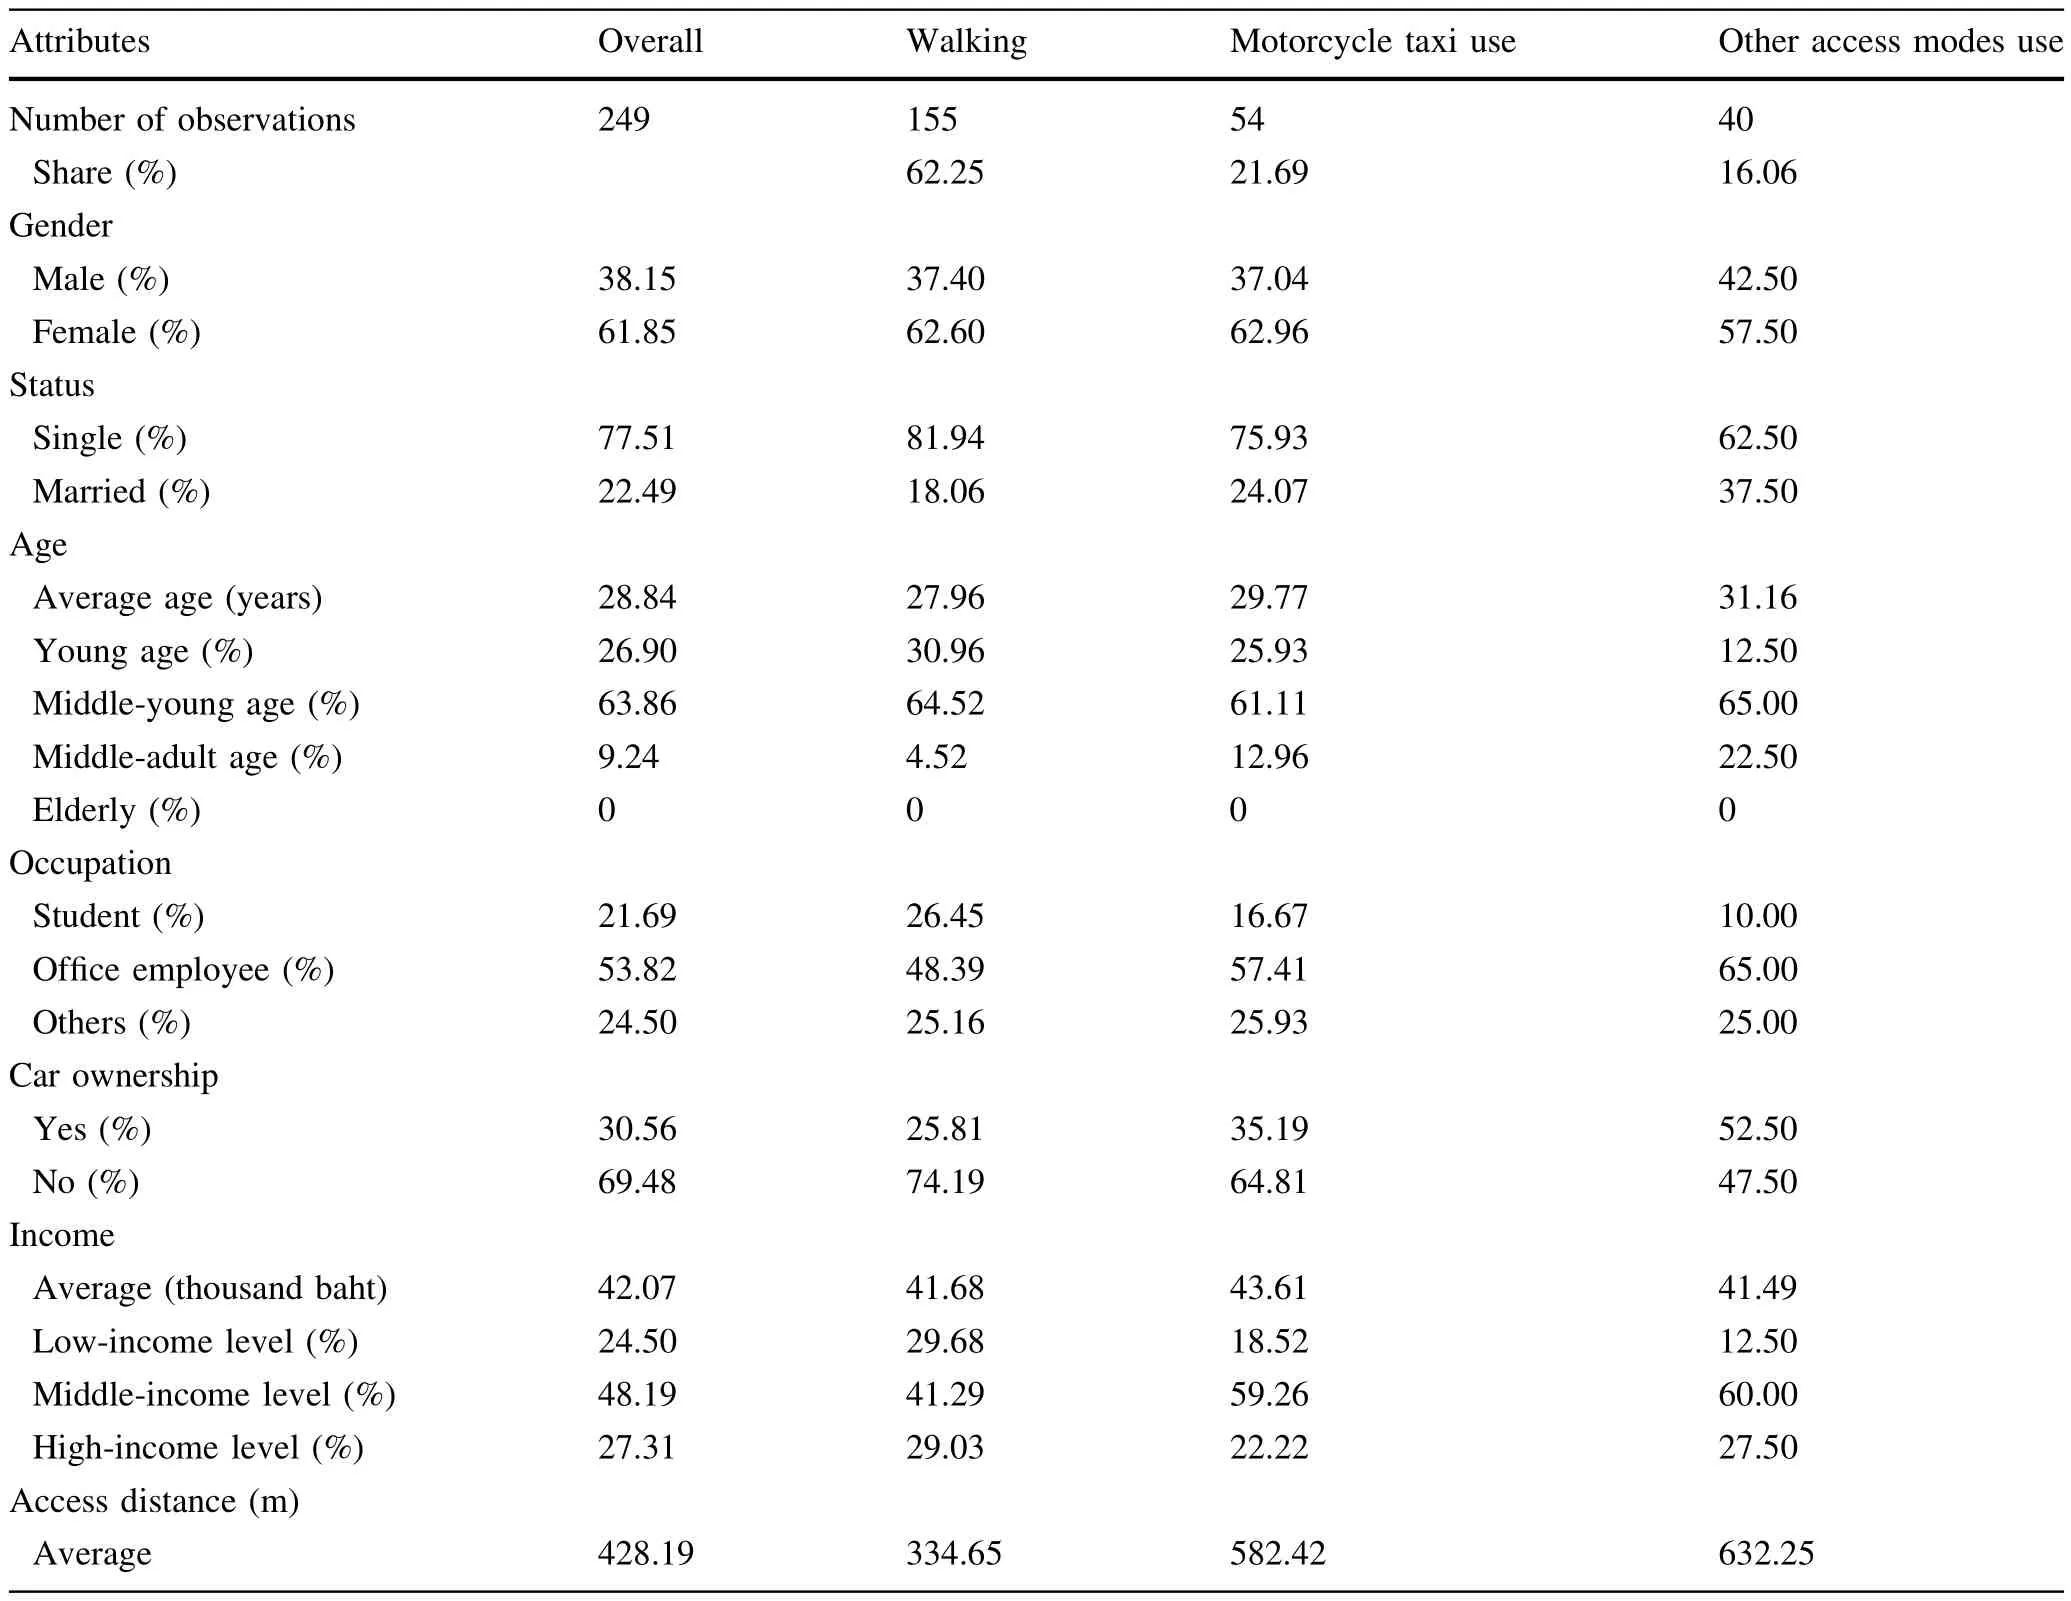
Table 1 Summary of respondents'characteristics
3.2 Acceptable walking distance and time of TOD residents
The average acceptable walking distance and time of all respondents are 494 m and 9.29 min as shown in Table 2. Low-income households tend to accept walking distance(535 m)farther than those who earn middle and high income.Middle-income households tend to accept shorter walking distance(505 m)than the low-income households.However,unexpectedly,they accept longer walking time(9.48 min)than other income groups.Thus,middle-income people are less likely to walk in long distance but they tend to accept more time on walking to station.High-income households tend to accept shorter walking distance and time than other groups.
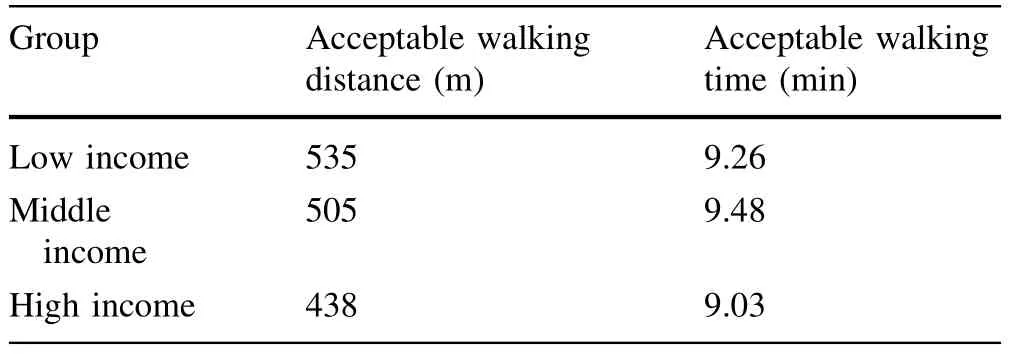
Table 2 Acceptable walking distance and time to transit station of TOD residents in each income group
3.3 Access modal share
According to Bangkok Comprehensive Plan 2006,the zoning regulations have granted additional floor area ratio(FARs)for new development projects within 500 m around transit station to promote higher density near stations[41].This study categorizes the distance into two groups:<500 and 500—1000 m from transit stations.The access mode share of respondents is shown in Fig.2.The farther the distance from transit stations are,the lower the share of walking is but the higher the shares of other modes become.Within a 500-m radius of station,the share of walking is the most popular mode,76%.The share of motorcycle taxi use is the second,17%.Obviously,in 500—1000 m distance,the share of walking sharply reduces to 25%,more than thrice.In contrast,motorcycle taxi use between 500 and 1000 m distance(37%)is two times higher than<500 m areas.Moreover,the share of car use can be seen only between 500 and 1000 m areas.Private motorcycle use is seen only in 500 m areas.In addition,the increase of motorcycle taxi use's share is the highest compared to other access modes at 500—1000 m range.However,regardless of the distance,the shares of bicycle use and other access mode stay the same.
3.4 Mean scores and mean difference of attitudes toward walking to station of TOD residents
In this part,the average mean score and mean difference of attitudes toward walking to transit station are shown in Tables 3 and 4,respectively.According to the whole data,most respondents positively think that walking to station is fashionable and good for their health,with the highest average scores of 3.337 and 4.00,respectively,and they are under ‘‘feeling of walking''and ‘‘benefit of walking''factors,while ‘‘fun''and ‘‘environment-friendly''attitudes show the lowest average score of 2.739 and 3.911,respectively.Judging from each income group,most respondents with low income think that walking to station is fashionable(3.590)and save travel cost(4.328).Most respondents from middle-income households think that walking to station gives them freedom(3.308),while saving travel cost is what they highly expect(4.033).Most high-income households strongly believe that walking is full of freedom(3.250)and good for health(4.250).However,all respondents think that they would not get fun and enjoy walking to station as seen in the lowest average scores in each income group.This is somewhat surprising as some recent studies analyzing travel satisfaction indicate that walking is mostly considered enjoyable[42—45].
As for mean difference between income groups as shown in Table 4,the one-way analysis of variance(oneway ANOVA)is used to identify whether a significant difference exists between two groups[46].It can be seen that eight attitudes toward walking,consisting of X1(comfortable),X3(relaxing),X4(fun),X5(enjoyable),X6(fashionable),X7(safe),Y1(healthy),and Y3(saving travel cost),show the statistically significant value at p<0.05.It means that at least one income group is significantly different from other groups on these attitudes.Then,we used post hoc multiple comparison technique according to the Scheffe's procedure to find out which groups were significantly different from others in each attitude.As for the results,the attitudes'means of X1(comfortable),X3(relaxing),X4(fun),X5(enjoyable),X6(fashionable),X7(safe),and Y3(saving travel cost)of low-income residents are higher than middle-and highincome respondents as statistically significant value at p<0.05,while high-income residents'mean on attitude of Y1(healthy)is significantly higher than that of people with middle and low incomes at p<0.05.As can be implied,high-income respondents in TOD areas greatly perceive that the benefit of walking to transit station is much good for their health.So if urban planners would like to encourage high-income TOD residents walk to transit station more,they should promote the walking activities related to getting the good health.
4 Methodology

Fig.2 Access modal share of residents living near transit station within 1 km

Table 3 Average score of attitudes toward walking to transit station in each income group

Table 4 Mean difference of attitudes toward walking to transit station in each income group
This paper investigates the attitudes toward walking to station of TOD residents.The analysis results are divided into three income groups(low,middle,and high).The data were collected from paper-and-pencil survey and online survey in April 2016.From 249 respondents in total,we got 60 respondents from online survey and 189 from paperand-pencil survey.All questionnaires were completed by TOD residents in 48 transit station areas(80%of 60 stations in total)due to the time and respondents'constraints.177 respondents(71.1%)live near BTS stations and 61 respondents(24.5%)live near MRT stations,but only 11 respondents(4.4%)are ARL station-area residents.The number of respondents is varied with the number of station in each transit group.As for online data collection,the questionnaires were distributed to only residents within 1 km from stations.All survey respondents were given the questionnaire in residential areas near transit stations such as coffee shops,restaurants,department stores,and recreation parks.The last group of respondents is the real research sample.The questionnaire consists of three parts:(1)socioeconomic data,(2)attitude toward walking to station,and(3)acceptable walking distance and time.The second part describes attitude toward walking to station,consisting of 10 attitudinal questions as shown in Table 5.The 10 questions on attitudes(observed variables)are rated by respondents on a five-point Likert type scale ranging from ‘‘strongly disagree''(=1)and ‘‘strongly agree''(=5).As for the comments ‘‘walking to station is enjoyable''and‘‘walking to station is fun'',the former is defined as the attitude of how people enjoy walking while doing something such as shopping,playing at the park,or walking on free spaces along the way to the transit station.Importantly,the results show how attractive the shopping areas,parks and,free spaces around stations are.On the contrary,the latter is only defined as the attitude of how people have fun(without doing anything)with surrounding activities in shopping areas,parks,and recreation areas along sidewalks to station.In terms of acceptable walking distance and time,the actual distance between respondent's home to nearest transit station is measured using Google Maps based on the shortest route.Although,the online survey could not meet the respondents,the results collected from them are not more different than those of on-the-road questionnaire.
In this paper,the income group is divided into three:(1)low income(<20,000 baht/month),(2)middle income(20,001—50,000 baht/month), and (3) high income(>50,000 baht/month).These data are obtained from Thai's minimum wage rate[47]and researched on monthly income of people in Bangkok[48].The age group is divided into four:(1)young age(lower than 22,students),(2)middle-young age(23—40),(3)middle-adult age(40—64),and(4)old age(65 or older)[49].
The data analysis was conducted in two stages:factor analysis and structural equation modeling.First,exploratory factor analysis(EFA)was taken to select significant factors from these indicators;then confirmatory factor analysis(CFA)tested the validity of latent constructs and observed variables,optimizing the factor analysis.
4.1 Factor analysis
The exploration factor analysis(EFA)was done using varimax rotation from the principal component analysis to measure the reliability and validity of the attitudinal data from the survey.This analysis process was conducted by IBM SPSS Statistics version 17.The data collected from 249 respondents,10 questions(as indicators)on attitude toward walking to station were subjected to an exploratory factor analysis.Results from pilot study show two main factors explaining 39.23%and 23.44%of the variance.These two factors are ‘‘feeling of walking''and ‘‘benefit of walking''including seven and three attributes,respectively,which shows strong loadings,between 0.5 and 0.92 and over 0.75(greater than 0.5[50])as shown in Table 5.Acceptable walking distance and time are observed variablesconducted in the latentvariable of ‘‘walking acceptance''.As for KMO and Barlett testing,KMO value is 0.873,greater than 0.8,showing that it is a very good model.It means that component or factor analysis will be useful for these variables[51].Chi square value in Barlett's test of sphericity is 1214.49 with significance at p=0.00.It clearly shows that all variables are correlated so they can be used in factor analysis.

Table 5 Exploratory factor analysis results
4.2 Structural equation model(SEM)
The analysis of structural equation modeling(SEM)was conducted using AMOS version 21.It is an extremely flexible linear-in-parameters multivariate statistical modeling technique,used to find the direct effects between independent and dependent variables.Furthermore,the indirect effects of each observed variable can be found by SEM.In this paper,the model is initially evaluated by the fit of model using confirmatory factor analysis procedure(CFA)based on significant criteria of 5%significance.The model was assessed by multiple fit indices including Chi square(χ2),goodness of fit index(GFI),adjusted goodness of fit index(AGFI),root mean square residual(RMR),root mean square error of approximation(RMSEA),Tucket-Lewis index(TLI),the Bentler-Bonett normed fit index(NFI)and the comparative fit index(CFI).The χ2/df for this model is 1.265,less than 2.The fit indices of the established model are explained by RMR,0.018,very near to zero.Moreover,RMSEA(0.033)is less than 0.08;so it means that the model is good fit.TLI,NFI,and CFI values are 0.990,0.968,and 0.993.They are more than the recommended value of at least 0.9.The GFI(0.970)and AGFI(0.947)values are more than the recommended ones of at least 0.9 and 0.8.Also,this means that 97%of covariation in the data could be represented by the given model.To conclude,all indices obtained from CFA could reach the recommended values.Each model contains one endogenous latent variable for walking acceptance attitude(η),and two latent exogenous variables for attitude of ‘‘feeling of walking''(ξ1)and ‘‘benefit of walking''(ξ2)as illustrated in Fig.3.
The observed variables of ‘‘walking acceptance''are applied for attitude measurement models.The model of each measurement can be defined in terms of structural equation model as follows:

where ξ1is attitude on ‘‘feeling of walking''measurement(latent exogenous variable 1),ξ2is attitude on ‘‘benefit of walking''measurement(latent exogenous variable 2),η is attitude of ‘‘walking acceptance''measurement(latent endogenous variable),β1is beta coefficient of relationship between variables of ‘‘feeling of walking''and ‘‘walking acceptance'',β2is beta coefficient of relationship between variables of ‘‘benefit of walking''and ‘‘walking acceptance'',and ε is error term of attitude measurement.
5 Model estimation results
Based on reliable and valid factor analysis,a structural model was developed to test the predictive relationship between ‘‘feeling of walking'', ‘‘benefit of walking,''and‘‘walking acceptance''in the proposed conceptual model by the use of maximum likelihood method.The structural model in AMOS version 21 is shown in Fig.4,where e1,e2,…,e13 are error variances.
The results of model measurement and indicators'factor loadings and significance of each income group are as follows.
5.1 Low-income group
Five common indices of model measurement reached the recommended value; χ2/df (1.028<2), RMSEA(0.022<0.08),AGFI(0.804>0.8),TLI(0.994>0.9),CFI(0.996>0.9)except the GFI(0.879).Even though the value for GFI does not exceed 0.9,they still meet the requirements suggested by Baumgartner and Homburg[52]and Doll et al.[53]:the value is acceptable if above 0.8.Thus,it can be concluded that the model of low-income people has a reasonably good fit.According to Table 6,all observed indicators significantly affect the latent variables of ‘‘feeling of walking'', ‘‘benefit of walking,''and‘‘walking acceptance''at p < 0.01.All factor loading values are higher than 0.5.The two highest loadings are‘‘comfortable''and ‘‘relaxing''(0.775 and 0.77,respectively)which highly affect‘‘feeling of walking''.However,the ‘‘fashionable''shows the lowest value of 0.593.The‘‘healthy''highly affects ‘‘benefit of walking''with the highest value of 0.895.Unexpectedly,walking attitude of‘‘saving travel cost''shows the lowest value of 0.517.As for the relationship of latent variables,only ‘‘feeling''positively in fluences ‘‘walking acceptance''with signi ficance at p<0.05(95%of confidence level).The beta coefficient(β1)is 0.577.
5.2 Middle-income group
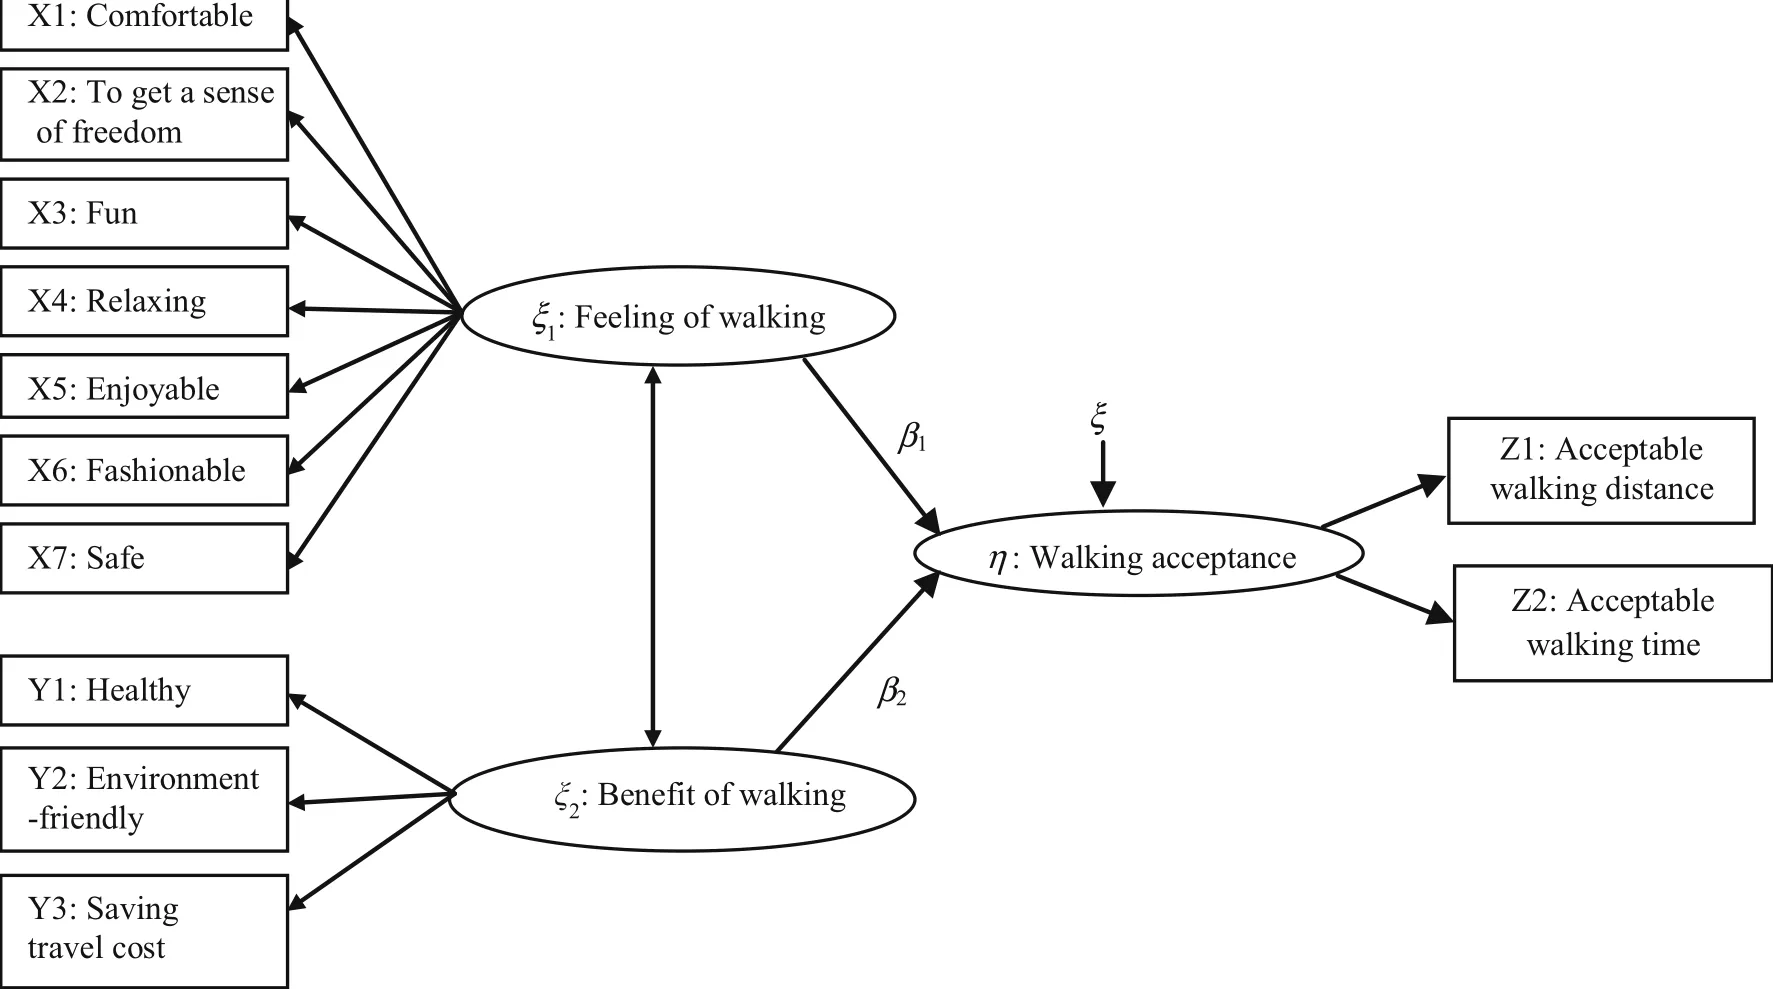
Fig.3 Structural model diagram
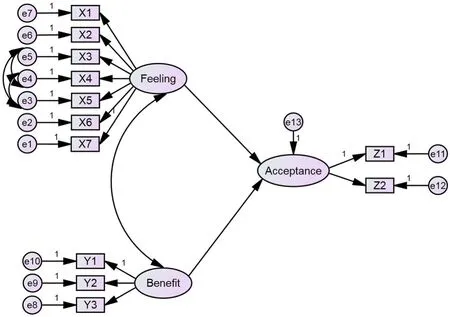
Fig.4 Structural modeling
All common indices of model measurement reached the recommended value:χ2/df value(1.693<2),RMSEA(0.076<0.08),GFI(0.904>0.9),AGFI(0.832>0.8),TFI(0.935>0.9)and CFI(0.954>0.9).It can be concluded that the model for middle-income people has reasonably good fit.According to results in Table 6,all observed variables are significant at p<0.01(99%of confidence level).All have the factor loading value higher than 0.5.As for observed variables in fluencing ‘‘feeling of walking'',the loading value of‘‘safe'',0.695,is higher than‘‘sense of freedom'', ‘‘enjoyable'', ‘‘fashionable'', ‘‘comfortable'', ‘‘relaxing,''and ‘‘fun''as 0.673,0.644,0.631,0.627,0.614,and 0.592,respectively.The observed variable of ‘‘healthy''has the highest effect to ‘‘benefit of walking''with the value of 0.915 while the ‘‘environmentfriendly''shows the lowest value of 0.688.As for the relationship of latent variables, ‘‘feeling''and ‘‘benefit''positively in fluence ‘‘walking acceptance''with signi ficance at p<0.05(95%of confidence level).The beta coefficients of β1and β2are 0.381 and 0.287,respectively.
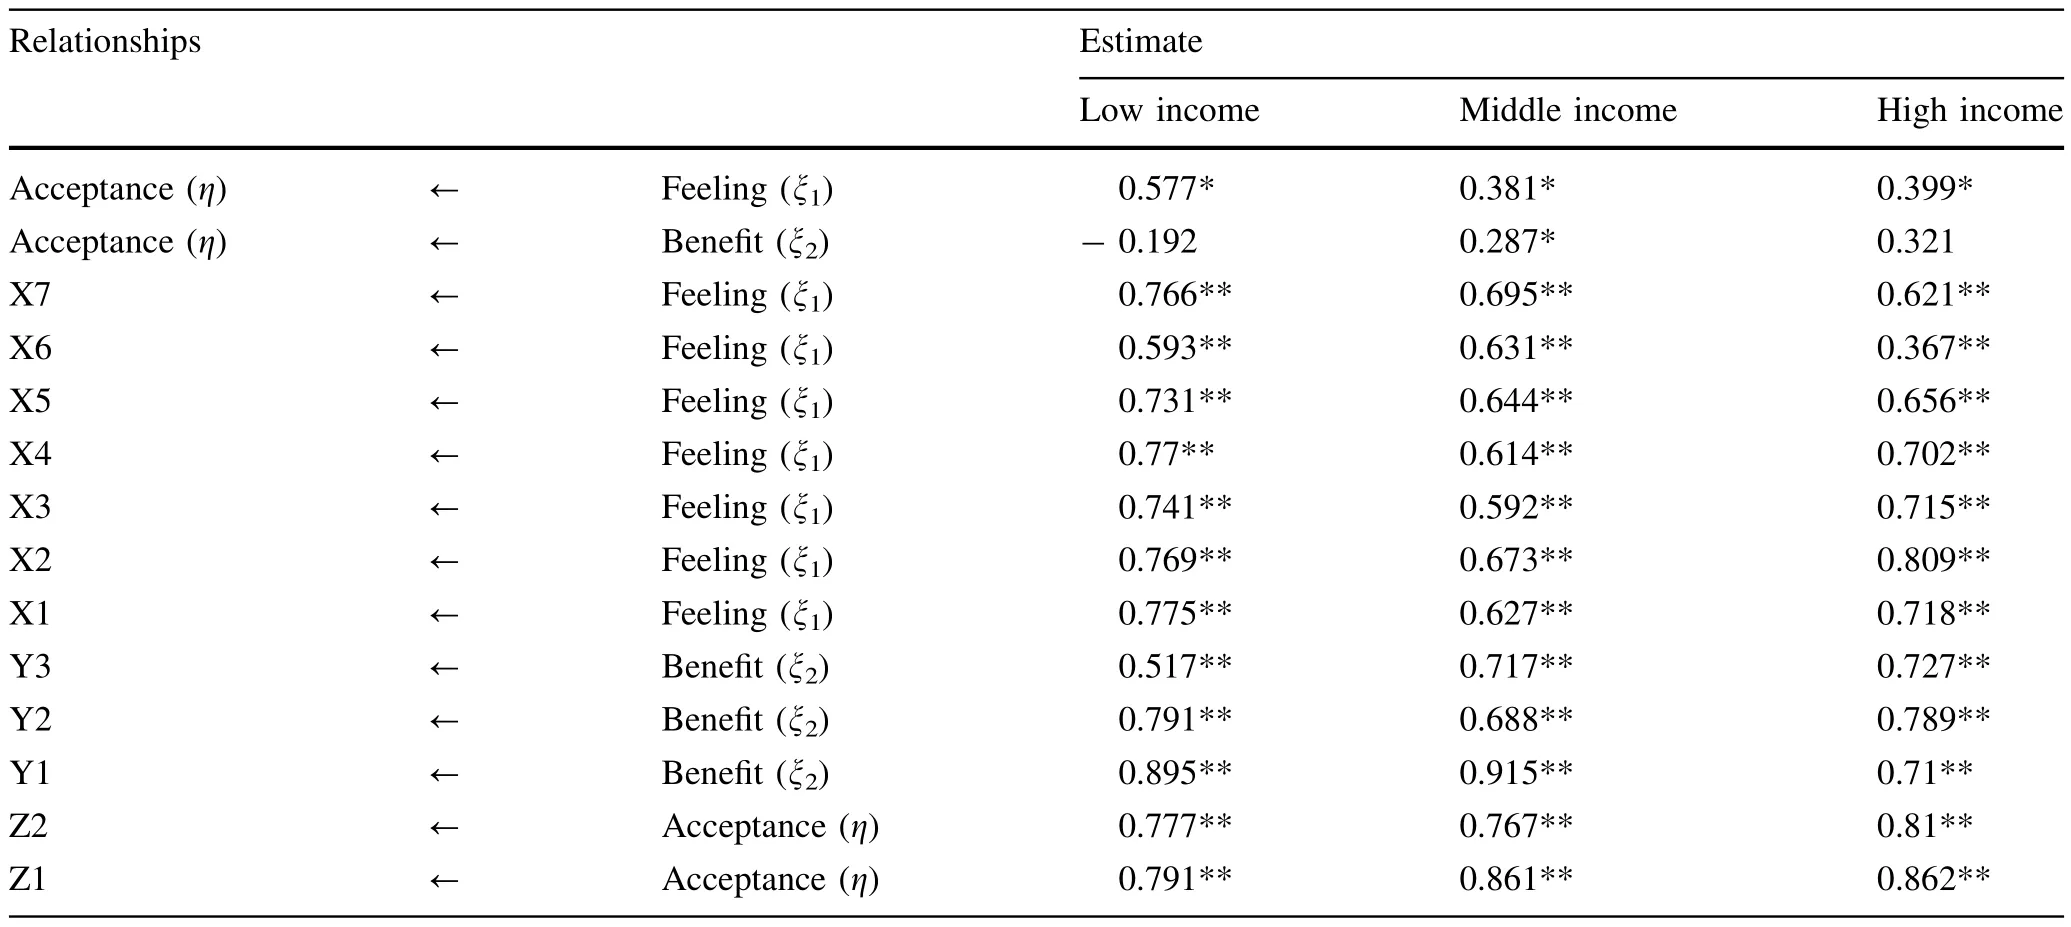
Table 6 Standardized regression estimates of measurement equations from SEM models
5.3 High-income group
Regarding the indices of model measurement, five reached therecommendedvalues; χ2/df(1.15<2),RMSEA(0.047<0.08),AGFI(0.804>0.8),TLI(0.935>0.9),CFI(0.983>0.9)except the GFI(0.879).Even though the value for GFI does not exceed 0.9,they still meet the requirements suggested by Baumgartner and Homburg[52]and Doll et al.[53]:the value is acceptable if above 0.8.Thus,it can be concluded that the model of high-income people has a reasonably good fit.According to Table 6,all observed variables significantly affect the ‘‘feeling of walking'',‘‘benefit of walking,''and ‘‘walking acceptance''at p<0.01.All factor loading values are higher than 0.5.As for observed variables affecting the ‘‘feeling of walking'', ‘‘sense of freedom''has the highest value of 0.809 and ‘‘comfortable''is the second of 0.718.The factor of‘‘benefit of walking''is positively in fluenced by ‘‘environment-friendly'', ‘‘saving travel cost,''and ‘‘healthy''with the loading values of 0.789,0.727,and 0.71,respectively.As for the relationship of latent variables,only‘‘feeling''in fluences ‘‘walking acceptance''with signi ficance at p<0.05(95%of confidence level).The beta coefficient(β1)is 0.399.
6 Discussion and conclusion
This paper investigates the in fluences of TOD residents'attitudes toward walking to station by making a comprehensive model on respondents'feelings of walking,benefits of walking,and walking acceptance.The main objective is to identify the main attitudes of walking to station among low-,middle-and high-income households in TOD areas in fluential to residents'decision to walk to station.The data analysis was conducted in two stages:factor analysis and structural modeling.There are 249 questionnaire respondents in total:60 answered online survey and 189 respondents completed paper-and-pencil survey.Most respondents are females,single,in middleyoung age,and of fice workers;70%do not have car.Obviously,most pedestrians to transit stations are from low-income households while motorized-mode users to stations tend to be middle-to high-income households which are the largest group of respondents.As for acceptable walking distance and walking time,middle-income households walk in shorter distance(505 m)than lower-income group,535 m.However,middle-income households accept longer walking time(9.48 min)than the low-income group,9.25 min.High-income group walks in shorter distance(438 m)and time(9.03 min)than others.Regarding the access modal share within 500-m distance,the share of walking is the highest(76%).The share of motorcycle taxi use is the second(17%).However,within 500—1000 m distance,the share of walking is lower for thrice down to 25%.The share of motorcycle taxi use is 37%,which is more than twice of<500-m areas.In terms of average score of attitude toward walking to station,lowand middle-income groups put higher awareness on travel cost saving while the high-income group focuses on their health.However,all respondents think that walking to station is not pleasant.In this paper,we examined the relationship between TOD residents'attitude and intention on walking to transit station.We categorized attitudes into 2 main groups:(1)feelings of walking and(2)benefit of walking.The intention is considered as walking acceptance(maximum distance and time)to transit station.According to the data analysis,it was found that the relationship of‘‘feelings of walking'',‘‘benefit of walking,''and ‘‘walking acceptance''show that ‘‘feeling''and ‘‘benefit''signi ficantly in fluence ‘‘walking acceptance''of middle-income group.However, ‘‘walking acceptance''is significantly in fluenced only by ‘‘feeling of walking''among low-and high-income groups.The attitudes on safety and sense of freedom on walking to station have high effect on feeling of walking,but the health awareness highly affects walking benefit among middle-income group(who accepts longer walking time than others).As for low-income(who accepts longer walking distance than others)and high-income group(who accepts shorter distance and time than others),attitudes of comfort and sense of freedom from walking to station directly affect feeling of walking while health awareness and environmental friendliness have high effect on benefit of walking.They are similar to the research's assumption.Obviously,the attitude on travel cost saving by walking underneath affects the feeling of walking in all income groups.Moreover,the attitudes on ‘‘feeling of walking''and ‘‘benefit of walking''of middle-income group are greatly in fluential to ‘‘walking acceptance'',while the low-and high-income groups are not.Their attitude on ‘‘feeling of walking''is significantly associated with ‘‘walking acceptance.''The findings of research can assist the urban planning policy-makers in how to improve the environment around transit stations of Bangkok.As for the research outcomes,we can know that the feelings of walking have more impact to the walking acceptance.Although the rail service is excellent,TOD residents,who live near a station,may not use it if they do not like the access to transit station.Middle-and high-income groups,the largest group of residents in TOD areas,are less likely to accept walking to transit station.Their attitudes of safe,comfortable walk and getting the sense of freedom are the most in fluential to walking acceptance.These are very necessary points that the planners should learn how to design the surrounding environment to support their walking preferences.Moreover,enhancing walkability,livable area,and sustainable land-use development in TOD areas should be seriously concerned in the future urban planning of Bangkok.
AcknowledgementsThis research was supported by the Ministry of Education,Culture,Sports,Science and Technology(MEXT)of Japan,which granted a scholarship for the author's study in the Transport and Planning Group,Saitama University.
Open AccessThis article is distributed under the terms of the Creative Commons Attribution 4.0 International License(http://creativecommons.org/licenses/by/4.0/),which permits unrestricted use,distribution,and reproduction in any medium,provided you give appropriate credit to the original author(s)and the source,provide a link to the Creative Commons license,and indicate if changes were made.
 Railway Engineering Science2019年1期
- Railway Engineering Science的其它文章
- Numerical optimisation and experimental validation of divided rail freight brake disc crown
- Modified criterion for prediction of tunnel deformation in non-squeezing ground conditions
- Analysis of a joint entry-and distance-based cordon pricing scheme:a dynamic modeling approach
- In fluence of work zone signage on driver speeding behavior
- Speed-density functional relationship for heterogeneous traffic data:a statistical and theoretical investigation
