Modified criterion for prediction of tunnel deformation in non-squeezing ground conditions
Ako Daraei·Shokrollah Zare
Abstract The strength factor-based criterion for tunnel deformation prediction proposed by Hoek in 2000 is reckoned to be the most practical criterion among the tunnel deformation criteria since 1980s.In view of the fact that Hoek's criterion was obtained based on case studies under squeezing ground conditions,it has a limited range of applications,applicable mainly in squeezing tunnels.In this work,this criterion was modified by taking into consideration the conditions of eight unstable stations in three non-squeezing tunnels in Iran to amplify its application range.Relative displacements and strength factor(defined as a strength-to-stress ratio)were obtained in unstable stations first.Then,the parametric values were plotted on a Cartesian coordinate'splane.By using the optimal regression line passing through all points,a criterion for prediction of tunnel deformation was proposed finally.A comparison made between the measured values and the ones predicted by the new criterion shows that the variance accounted for was 77%and the root mean square error was 2%,an acceptable accuracy and a small error implying the effectiveness of the new criterion in tunnel deformation prediction.In addition,the results show that the strength factor of 0.38 can be used to determine the boundary between squeezing and non-squeezing conditions;the behavior and type of failure of the tunnel would be predictable by use of the strength factor.
Keywords Strength factor·Tunnel deformation·Monitoring·Failure type·Tunneling
1 Introduction
Increase in the urbanization,heavy traffic and global warming has led transportation experts to construct largescale underground structures in complex geotechnical conditions.Although instrumentation and monitoring of tunnels are considered as appropriate means to recognize the deformations amount,due to increase in costs and construction constraints,the instruments cannot be installed too close to each other.In this case,it is necessary to have a criterion for calculating the deformation to get hold of the behavior of areas lacking any instrument.
Evaluation of the deformation behavior of the surrounding rock mass is an important aspect of the safety assessment for underground engineering in complex conditions,contributing to the design of tunnel excavation and support[1].As Cantieni et al.[2]stated, ‘‘despite improvements made in the theoretical assessment of the tunnel deformation and the experiences gained from the monitoring data with different construction methods,there is still no reliable and targeted method of prediction available.''The first attempt to predict the tunnel deformation criterion was made by Jethwa et al.[3]in order to express the squeezing degree of the rock mass.The development of the prediction of tunnel deformation criteria can be relevant to the progress in identification of squeezing ground condition since 1980s.Research on this matter has been conducted by many scholars,e.g.,[1,4—14].Li et al.[1]proposed a new method integrating support vector machine(SVM),particle swarm optimization(PSO)and chaotic mapping(CPSO-SVM)to predict the deformation of tunnel surrounding rock mass.Chern et al.[4]conducted a case study on 11 tunnels of Taiwan by use of the strength factor and presented a new definition on degrees of squeezing.Hoek[5]published a detailed analysis of the support for weak rock and proposed that the strength factor can be used as an indicator for potential tunnel squeezing problems;he also presented a strengthbased equation to predict the tunnel deformation[6]and defined classes of supporting system at different strain levels[7].Shimamoto et al.[8]focused on tunnel deformation due to earth pressure and attempted to apply numerical analysis to the situation.Dwivedi et al.[9,10]developed dimensionally correct empirical correlations with a correlation factor of 0.94 to predict tunnel deformation for squeezing grounds.Guo et al.[11]used the wavelet prediction method for approximating and predicting the ground deformations due to tunneling.Zhao et al.[12]applied a generalized Kelvin constitutive model for displacement prediction of tunnels.Li et al.[13]summarized the state-of-the-art and future research challenges of artificial neural networks(ANNs)on the tunnel deformation prediction.Among the presented criteria for tunnel deformation so far,Hoek's criterion can be accounted the most practical one.However,Hoek's criterion[6]is based on case studies under squeezing conditions;it therefore has a limited range of applications,mainly in squeezing tunnels.Hence,modification of this criterion taking into consideration the conditions of the non-squeezing tunnels and combining it with the previous results can make the output data more accurate and more user-friendly.In this study,the Hoek's tunnel deformation criterion as the most important criteria is reviewed first;then,this criterion is modified on the basis of the monitoring results of eight unstable stations in three non-squeezing tunnels in Iran.First,the relative displacements of unstable stations were determined using the monitoring data.Then,the radial strain and strength factor of the rock mass were obtained and plotted on a Cartesian coordinate's plane.Finally by using optimal trend line passed through all points,a new criterion forprediction oftunneldeformation was proposed.
2 Strength factor and prediction of tunnel deformation
According to Hoek[5,6],the severity of tunnel stability problems in weak rock conditions depends upon the strength factor.The strength factor(or called competency factor)is defined as the ratio of the uniaxial compressive strength of rock mass to the vertical stress(σcm/σv),and it reflects the radial strain of the tunnel[6].If the strength factor is larger than 1,the tunnel is in stable condition and only local collapses may occur.In this case,the tunnel needs a light supporting system.Hoek and Marinos[7]show that the strain increases asymptotically when the strength factor falls below about 0.2.On the other hand,Hoek et al.[5,7]related the strength factor with the radial strain of the tunnel using Monte Carlo analysis results based on several case studies performed on tunnels with squeezing rocks and presented Eq.(1)for it.These case studies include tunnels of various sizes and shapes excavated in the rock formation of various geological ages,rock types,rock mass qualities and overburden depths.According to their definition,the radial strain of the tunnel is defined as the ratio of absolute displacement to the tunnel radius.Equation(1)demonstrates the deformation of tunnel and the degree of squeezing related to different levels of strain.Hoek[6]assumed the hydrostatic stress condition in Eq.(1).His idea was verified by two dimensionless plots,in which the input parameters for the rock mass strength and the tunnel deformation were varied at random in 2000 iterations[15].The strength factor will be calculated based on the two components of uniaxial compressive strength(UCS)of the rock mass and the vertical stress.The vertical stress was calculated using the specific gravity at the height of the cover as Eq.(2).Two parameters of uniaxial compressive strength of intact rock and geological strength index(GSI)are required to determine the uniaxial compressive strength of the rock mass via Eq.(3).The first one is obtained by testing the uniaxial compressive strength on the core in the laboratory,and the second one is obtained by the GSI chart[16].The GSI,introduced by Hoek[17],Hoek et al.[18]and Hoek and Brown[19]provides a system for estimating the reduction in rock mass strength for different geological conditions as identified by field observations.The combination of two parameters,such as the structure of the rock and the surface condition of the discontinuities,provides a practical basis for describing a wide range of types of rock masses.Based on the description of the rock mass,the GSI value is estimated from the contours given in Fig.1.

where εtis radial strain of tunnel and is equal to u/req-t,in which u is mean absolute displacement of tunnel walls(m)and req-tis equivalent radius of tunnel(m);σcmis uniaxial compressive strength of rock mass(MPa);σciis uniaxial compressive strength of intact rock(MPa);γ is mass density(MN/m3);h is depth of tunnel.The radius of tunnels was calculated using the equivalent cross-sectional relationship by equalizing the area of the section of the tunnels(At)to the area of the circle(Ac)as Eq.(4).
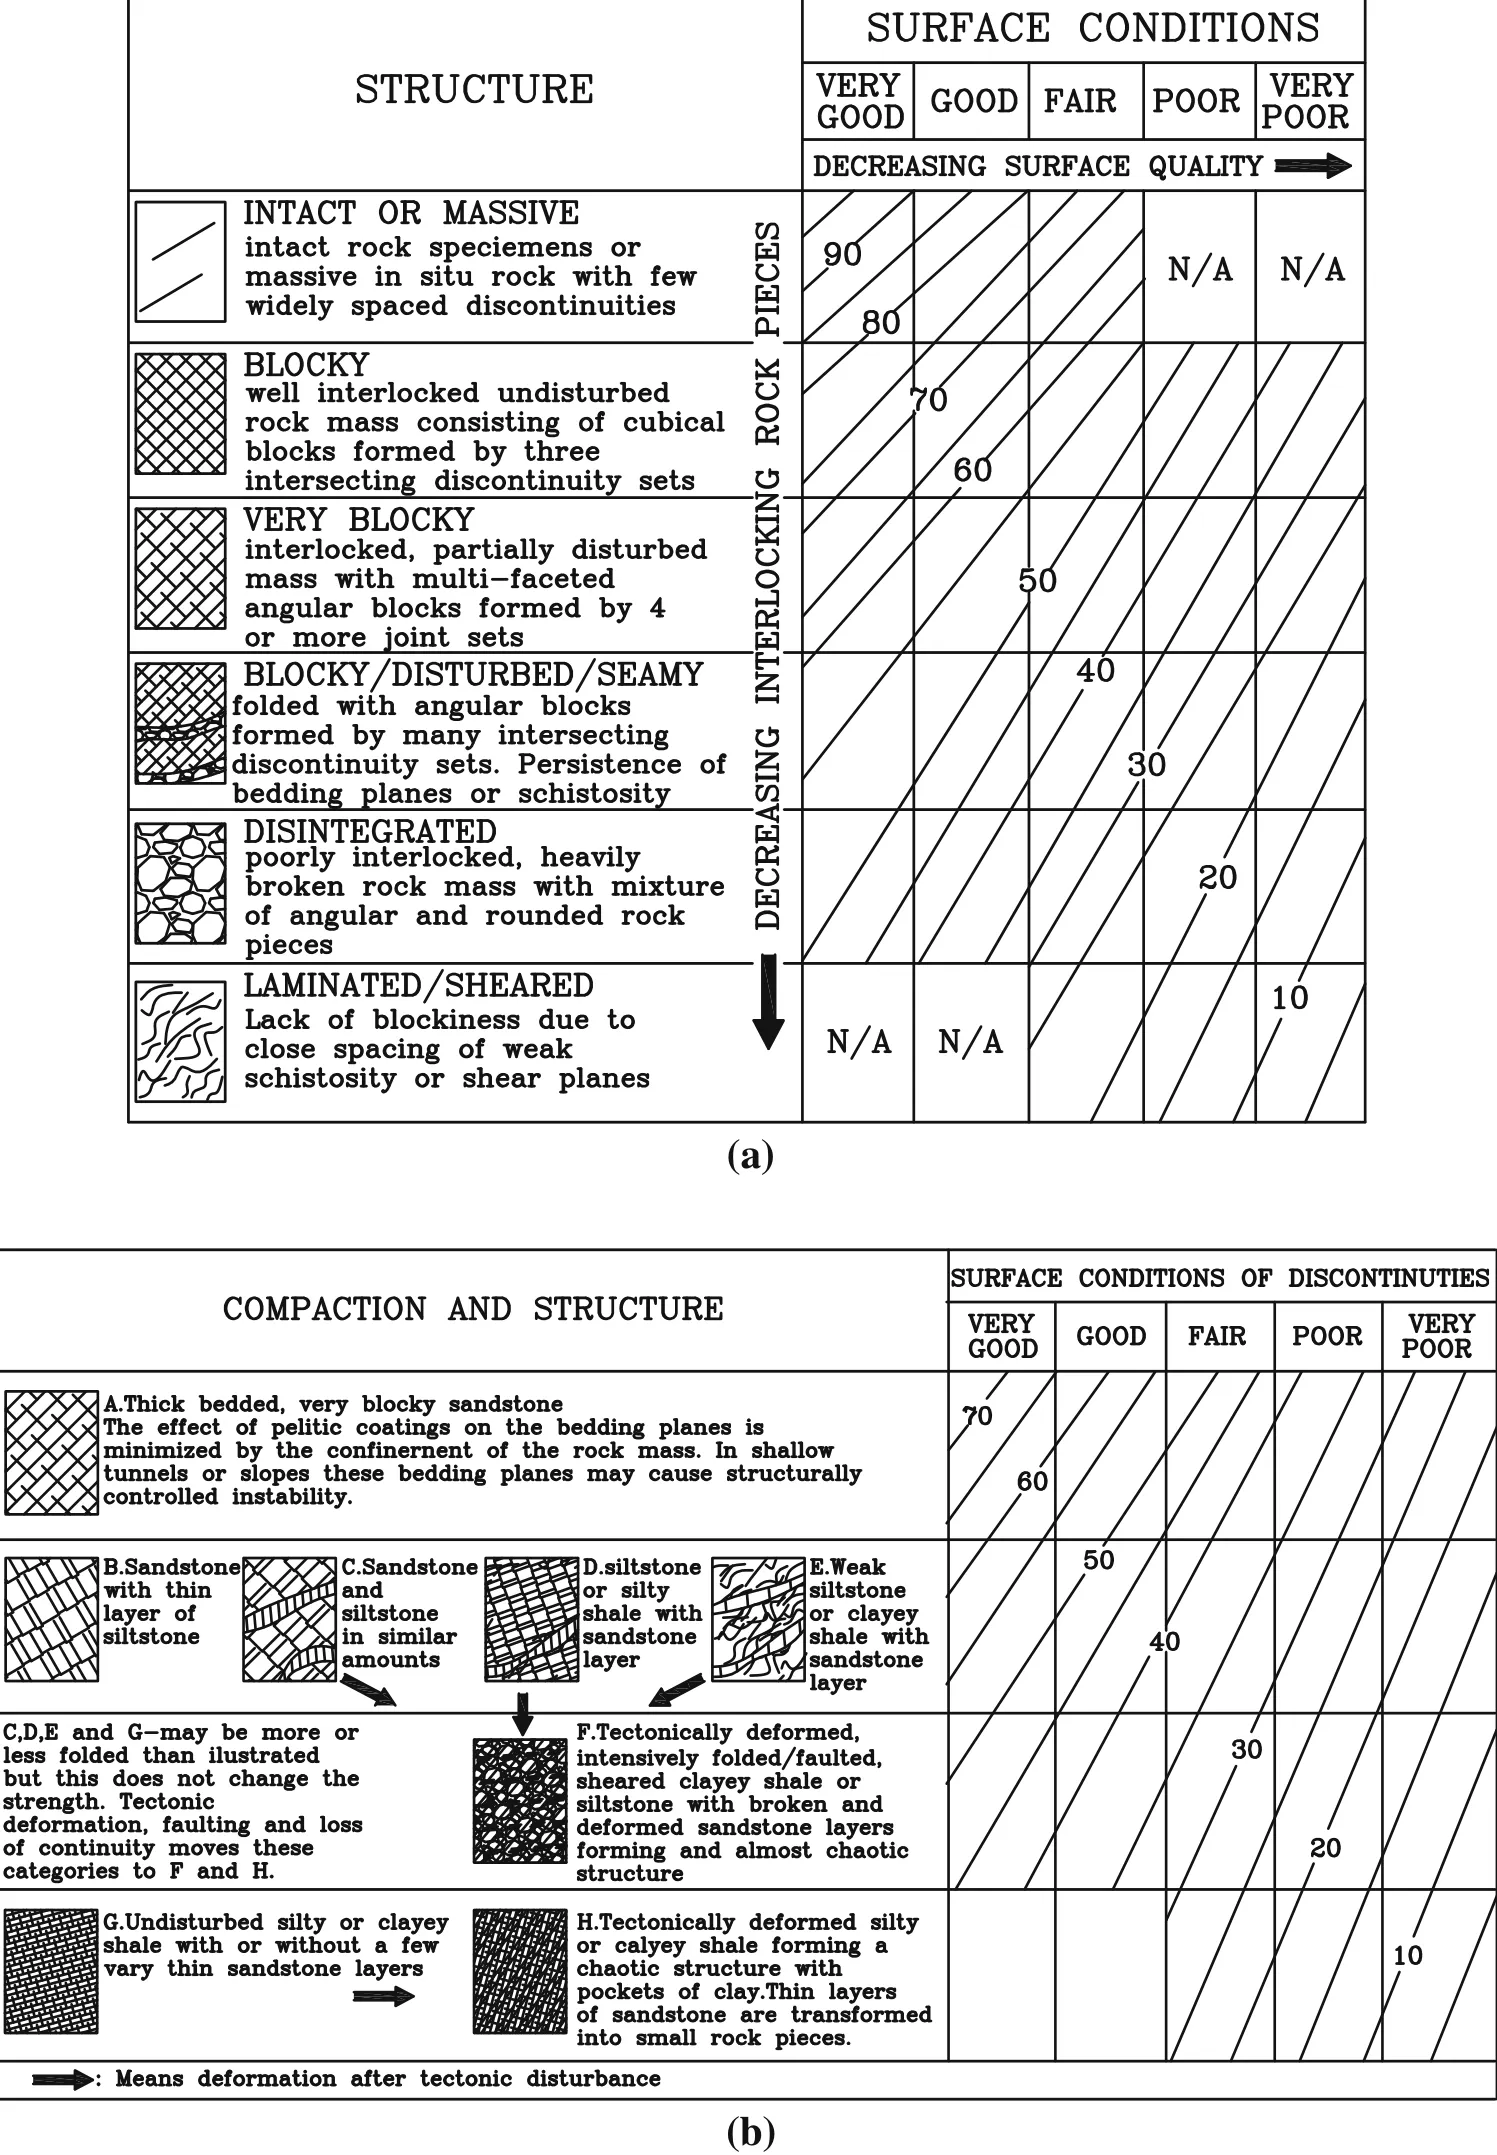
Fig.1 GSI charts mainly applicable for tunnels(a)and for surface excavations and slopes(b)[16]

To determine u at each station,the following steps were followed:
i.Determination of the relative displacements of the convergence pins(uC—L,uC—R,and uL—R)through the monitoring convergency graphs,where uC—Lis the displacement between center and left pins,uC—Rthe displacement between center and right pins,and uL—Rthe displacement between left and right pins.
ii.Converting the relative displacements of each pin(step 1)to absolute displacements.
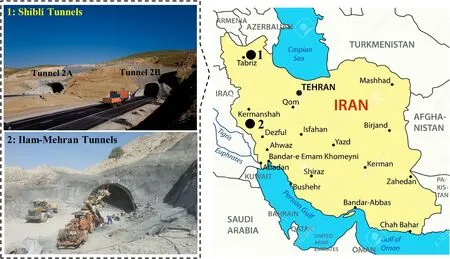
Fig.2 A close-up view of tunnels
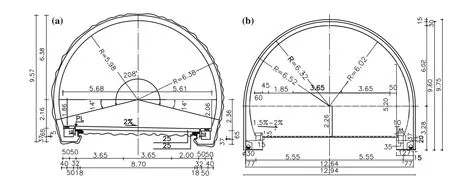
Fig.3 Cross sections of Shibli tunnels(a)and Ilam-Mehran tunnel(b)(unit:m)
iii.Calculate the average values of the second step for each station and introduce it as u.
3 Projects description
Three tunnels,including Shibli twin tunnels(2A and 2B)located in Zanjan-Tabriz Freeway in the northwest and Ilam-Mehran tunnel in the west of Iran,were selected to conduct case studies.Figure 2 shows the tunnels location.The Shibli twin tunnels are being constructed between Tabriz and Bostanabad to remove heavy traffic and decrease driving casualties.Their sections are both horseshoe shaped with 12.1 m width and 9.75 m height and with lengths of 2288 and 2244 m.The Ilam-Mehran tunnel is located in the Ilam province of west Iran.The tunnel lies at 12 km from Ilam with a length of 710 m.The tunnel section is horseshoe shaped,with a width of 12.94 m and a height of 9.75 m.Typical cross sections of the tunnels are shown in Fig.3.

Fig.4 Longitudinal section of Shibli tunnels
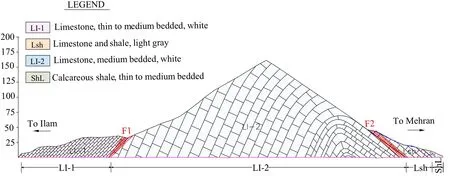
Fig.5 Longitudinal section of Ilam-Mehran tunnel
3.1 Geological and geotechnical setting
3.1.1 Shibli twin tunnels
Shibli tunnels host rocks are mostly composed of crushed limestone,gray to black shale,marl and calcareous shale.According to the engineering geological data and rating scores inferred from surface and underground mapping,the host rocks were divided into A,B and C blocks as shown in Fig.4.Block A consists of sandy limestone with some shale interbeds with a thickness of about 20 cm.Block B,assigned to the most competent part of the host rock,consists of alteration of shale and limestone.Lastly,the host rocks of block C are gray to black shale.Twelve minor fault zones,with NW—SE strike which are divergence from Tabriz fault,intersect the tunnels.The maximum rock cover thickness above the twin tunnels is 180 and 188 m,respectively.Due to low-strength properties of surrounding rocks in the tunnels path,the mechanical method has applied to excavate the tunnels[20].
3.1.2 Ilam-Mehran tunnel
Ilam-Mehran tunnel is located in the Zagros fold belt,consisting of numerous anticlines and synclines.The tunnel path is located in Pabdeh formation belonging to the Paleocene-Pliocene period.The major rock mass encountered are alteration of gray,white shale,marly limestone and red to brown shale with a UCS of 20—40 MPa,which belongs to soft to medium-strength rock according to the ISRM standard[21].As a result of tectonic movement,the rock mass in the area has been subjected to folding and faulting action.The maximum rock cover is 162 m.According to the engineering geological data and rating scores inferred from surface mapping,the host rocks were divided into four blocks as shown in Fig.5.The tunnels supporting systems are presented in Table 1.The rock mass quality has been scored using the rock mass rating(RMR)classification system.Detailed information of rock mass rating and properties of rock mass are demonstrated in Table 2.Since in situ tests are overpriced and timeconsuming,geomechanical properties were determined using the laboratory tests,and then,the parameters of the rock mass were obtained using generalized Hoek—Brown criterion(Eq.5)[22].

Table 1 Initial and secondary support systems

Table 2 Geotechnical properties

where σ1and σ3are the major and minor effective principal stresses at failure,mbis a reduced value of the material constant,and s and a are constants for the rock mass.
The coefficients s,mband a in Eq.(5)are calculated based on the uniaxial compressive strength of intact rock(σci),the intact rock parameter(mi),the GSI and the disturbance factor(D).Finally,the UCS,deformation modulus(E),cohesion(C),internal friction angle(φ)and tensile strength of the rock mass will be obtained using the relations provided by Hoek et al.[22].It should be noted that the indices RMR,GSI and Q are determined based on surface and subsurface geological mapping during the excavation of tunnels.
During surface and underground geological mapping,three and four major discontinuity sets were mapped in the Shibli and Ilam-Mehran tunnels.The distance of the discontinuity planes varies significantly,depending on the degree of fracturing of the rock.The spacing of the discontinuities is moderate(20—60 cm);hence,the sizes of the rock blocks are small to medium.Joints are spaced at 20—55 cm dipping with 25°—72°.The condition of discontinuities is slightly rough to slickenside surfaces,and the joint wall compressive strength is low.The discontinuity planes are generally in filled with clay<5 mm.Discontinuity set properties in each block and Fisher stereographic projection are presented in Table 3 and Fig.6.
3.2 Tunnels monitoring
Despite preliminary site investigations to characterize rock mass quality,it is not often possible to obtain a complete geomechanical characterization of the ground along a tunnel route.Therefore,it is essential to monitor the ground deformation during tunneling,not only to ensure the safety of construction but also to provide important information for the back analysis.Monitoring of inward tunnel deformation is believed to be a principal means for the safe and high-quality design of the supporting system and excavation method[23].Due to the weakness in geomechanical properties of shale in Shibli twin tunnels,the block C in inlet portals was observed with large deformations.These tunnels were monitored with convergence pins and extensometer.The instruments were installed in 128 stations with 30—60 m intervals.Most of tunneling problems were encountered in block C.Among the installed stations,collapses occurred in three stations(27+340,27+420 and 27+540)of tunnel 2A and two stations(27+980 and 28+005)of tunnels 2B.Thirty- five monitoring stations including the above instruments were installed in the Ilam-Mehran tunnel.The LI-I and ShL sections of the tunnel are the most unstable part of the tunnel due to the presence of groundwater.In this tunnel,three collapses occurred at stations 9+450,9+530 and 9+570.The deformation ranged from 2.2 cm at the crown and 19.4 cm at the sidewalls.Figures 7 and 8 depict the monitoring results of the aforementioned stations.

Table 3 Discontinuity sets properties
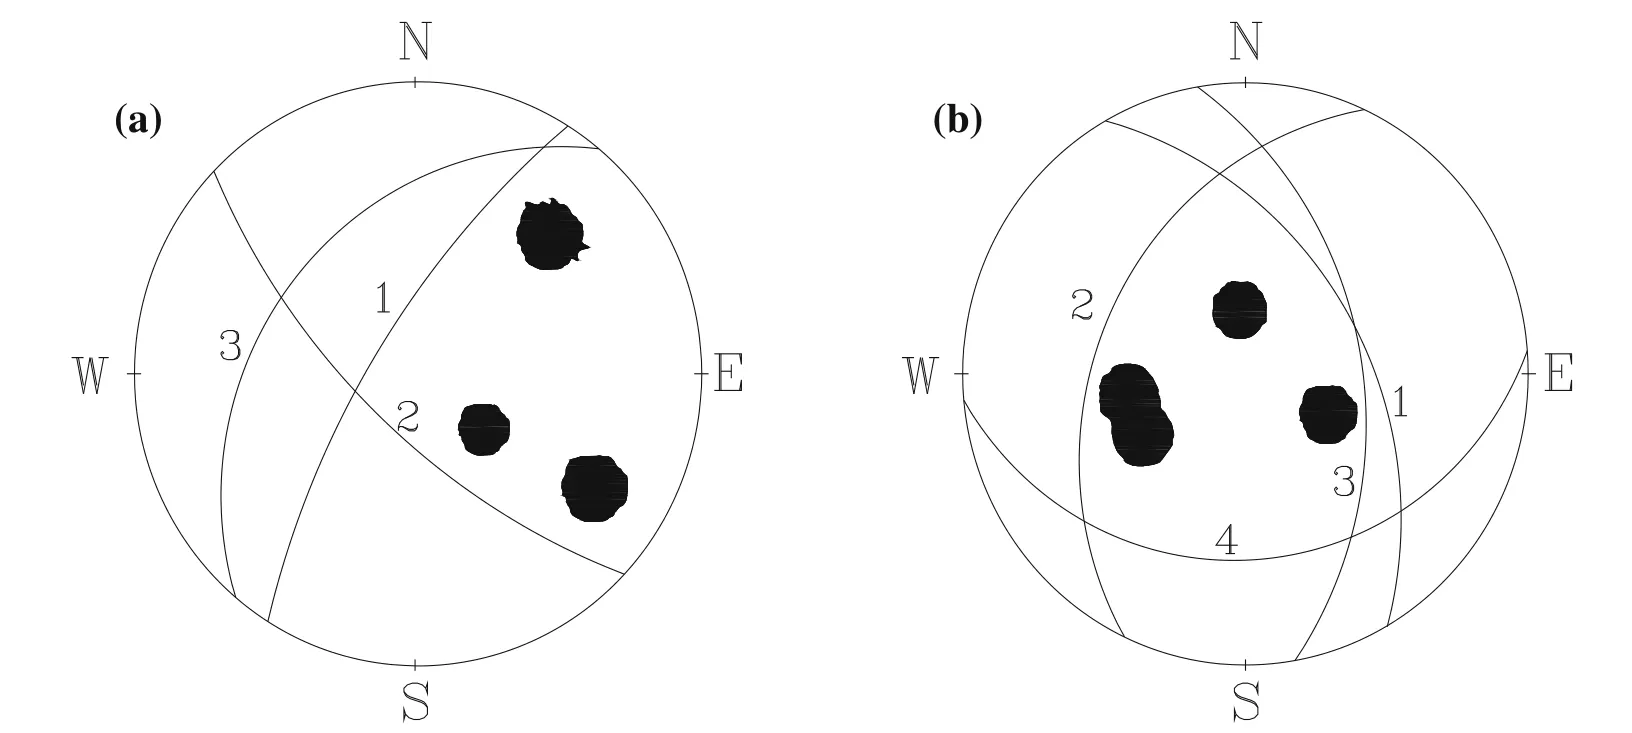
Fig.6 Stereographic projection of discontinuities in Shibli tunnels(a)and Ilam-Mehran tunnel(b)
The problem of instability occurred in these tunnels for two reasons.First,the host rock masses are shale and crushed limestone with clayey interbeds.Second,the groundwater presence,which is one of the outstanding parameters affecting the geomechanical properties,plays an important role in diminishing the mechanical and strength characteristics of the rocks[24].The presence of clayey interbedsin somechainages(27+980 and 28+005 in Shibli tunnels,and 9+450 and 9+570 in Ilam-Mehran tunnel),which are observed in the cores obtained during the study stages,raised concerns about the occurrence of swelling during the construction of the tunnels(Fig.9).These chainages were considered as unstable monitoring stations during tunnels construction.Two(direct and indirect)methods as free swell test(Fig.10a)and Atterberg limit were used to measure the swelling potential of the samples.Comparing the results of both methods with international standards[25—27],according to Table 4,confirmed a moderate-to-high swelling potential.On the other hand,the results of the UCS test conducted on the samples taken from the clayey interbeds(Fig.10b)show that these materials have a high deformability.Since during the UCS tests,the stress—strain curve did not reach a peak value,the experiment was stopped after the strain exceeded 15%.According to Einstein[28],such a behavior,i.e.,a considerable deformation without a specific rupture point,is a sign of swelling.In addition,the high deformability of the samples is confirmed by comparing the strain of the samples with the previous experimental results of the authors on various samples in the laboratory,as well as the results of similar tests in various studies of some other researchers[29,30].The presence of groundwater,along with in fluence of clayey interbeds,leads to swelling during construction,resulting in an increase in displacement rates in monitoring graphs.The existence of these interbeds plays an essential role in controlling the strength behavior of the host rock.Lama and Vutukuri[31]stated that the specifications of the in filling materials or interbeds determine the host rocks behavior,not the main lithology.Although the degree of deformations is high in aforementioned stations;however,because of the slow trend of swelling and the use of over-excavation technique,failure occurred in a local scale rather than a full collapse of the section.In the over-excavation technique,in order to obtain the required clearance pro file following convergence and less damage to support systems,tunnel excavation radius was considered larger than the original design radius(Fig.11).This technique were used 20 m before and after those stations where swelling potential were proved in the study stage.In general,the amount of over-excavation was considered as 30 cm based on the results of free swell tests,the monitoring data in previous stations and engineering judgment.In above-mentioned stations,the initial support systems have been implemented in two stages:(1)welded wire mesh embedded in 5 cm shotcrete and rockbolts was applied,and(2)30 cm lower,steel ribs embedded in 15 cm shotcrete were applied(Fig.11).Some instability events in the tunnels such as the buckling of the steel ribs,crack in the shotcrete,wedge failure in portal and face collapse occurred as shown in Fig.12.It should be noted that the main evidences of swelling potential including Gilgai topographic,soil hardness under dry conditions,high pH and deep cracks in roughly polygonal patterns in the ground surface[32]were observed nearby in the tunnels.With regard to the prediction of high swelling in stations having thick clayey interbeds,over-excavation technique and special arrangements for installation of convergence pins were applied.In this case,the tunnel section was excavated with a larger size to have less damage to the supporting system after the swelling of the host lithology.In these sections,convergence pins with a length of 50 cm and a diameter of 32 mm were fixed in the tunnel wall through a 2-inch diameter PVC pipe(Fig.13).When the swelling starts,the tunnel periphery converges to the over-excavation space;as a result,the pin will move inside the PVC pipe,and the tunnel displacement is calculated by reading the distance between pins.
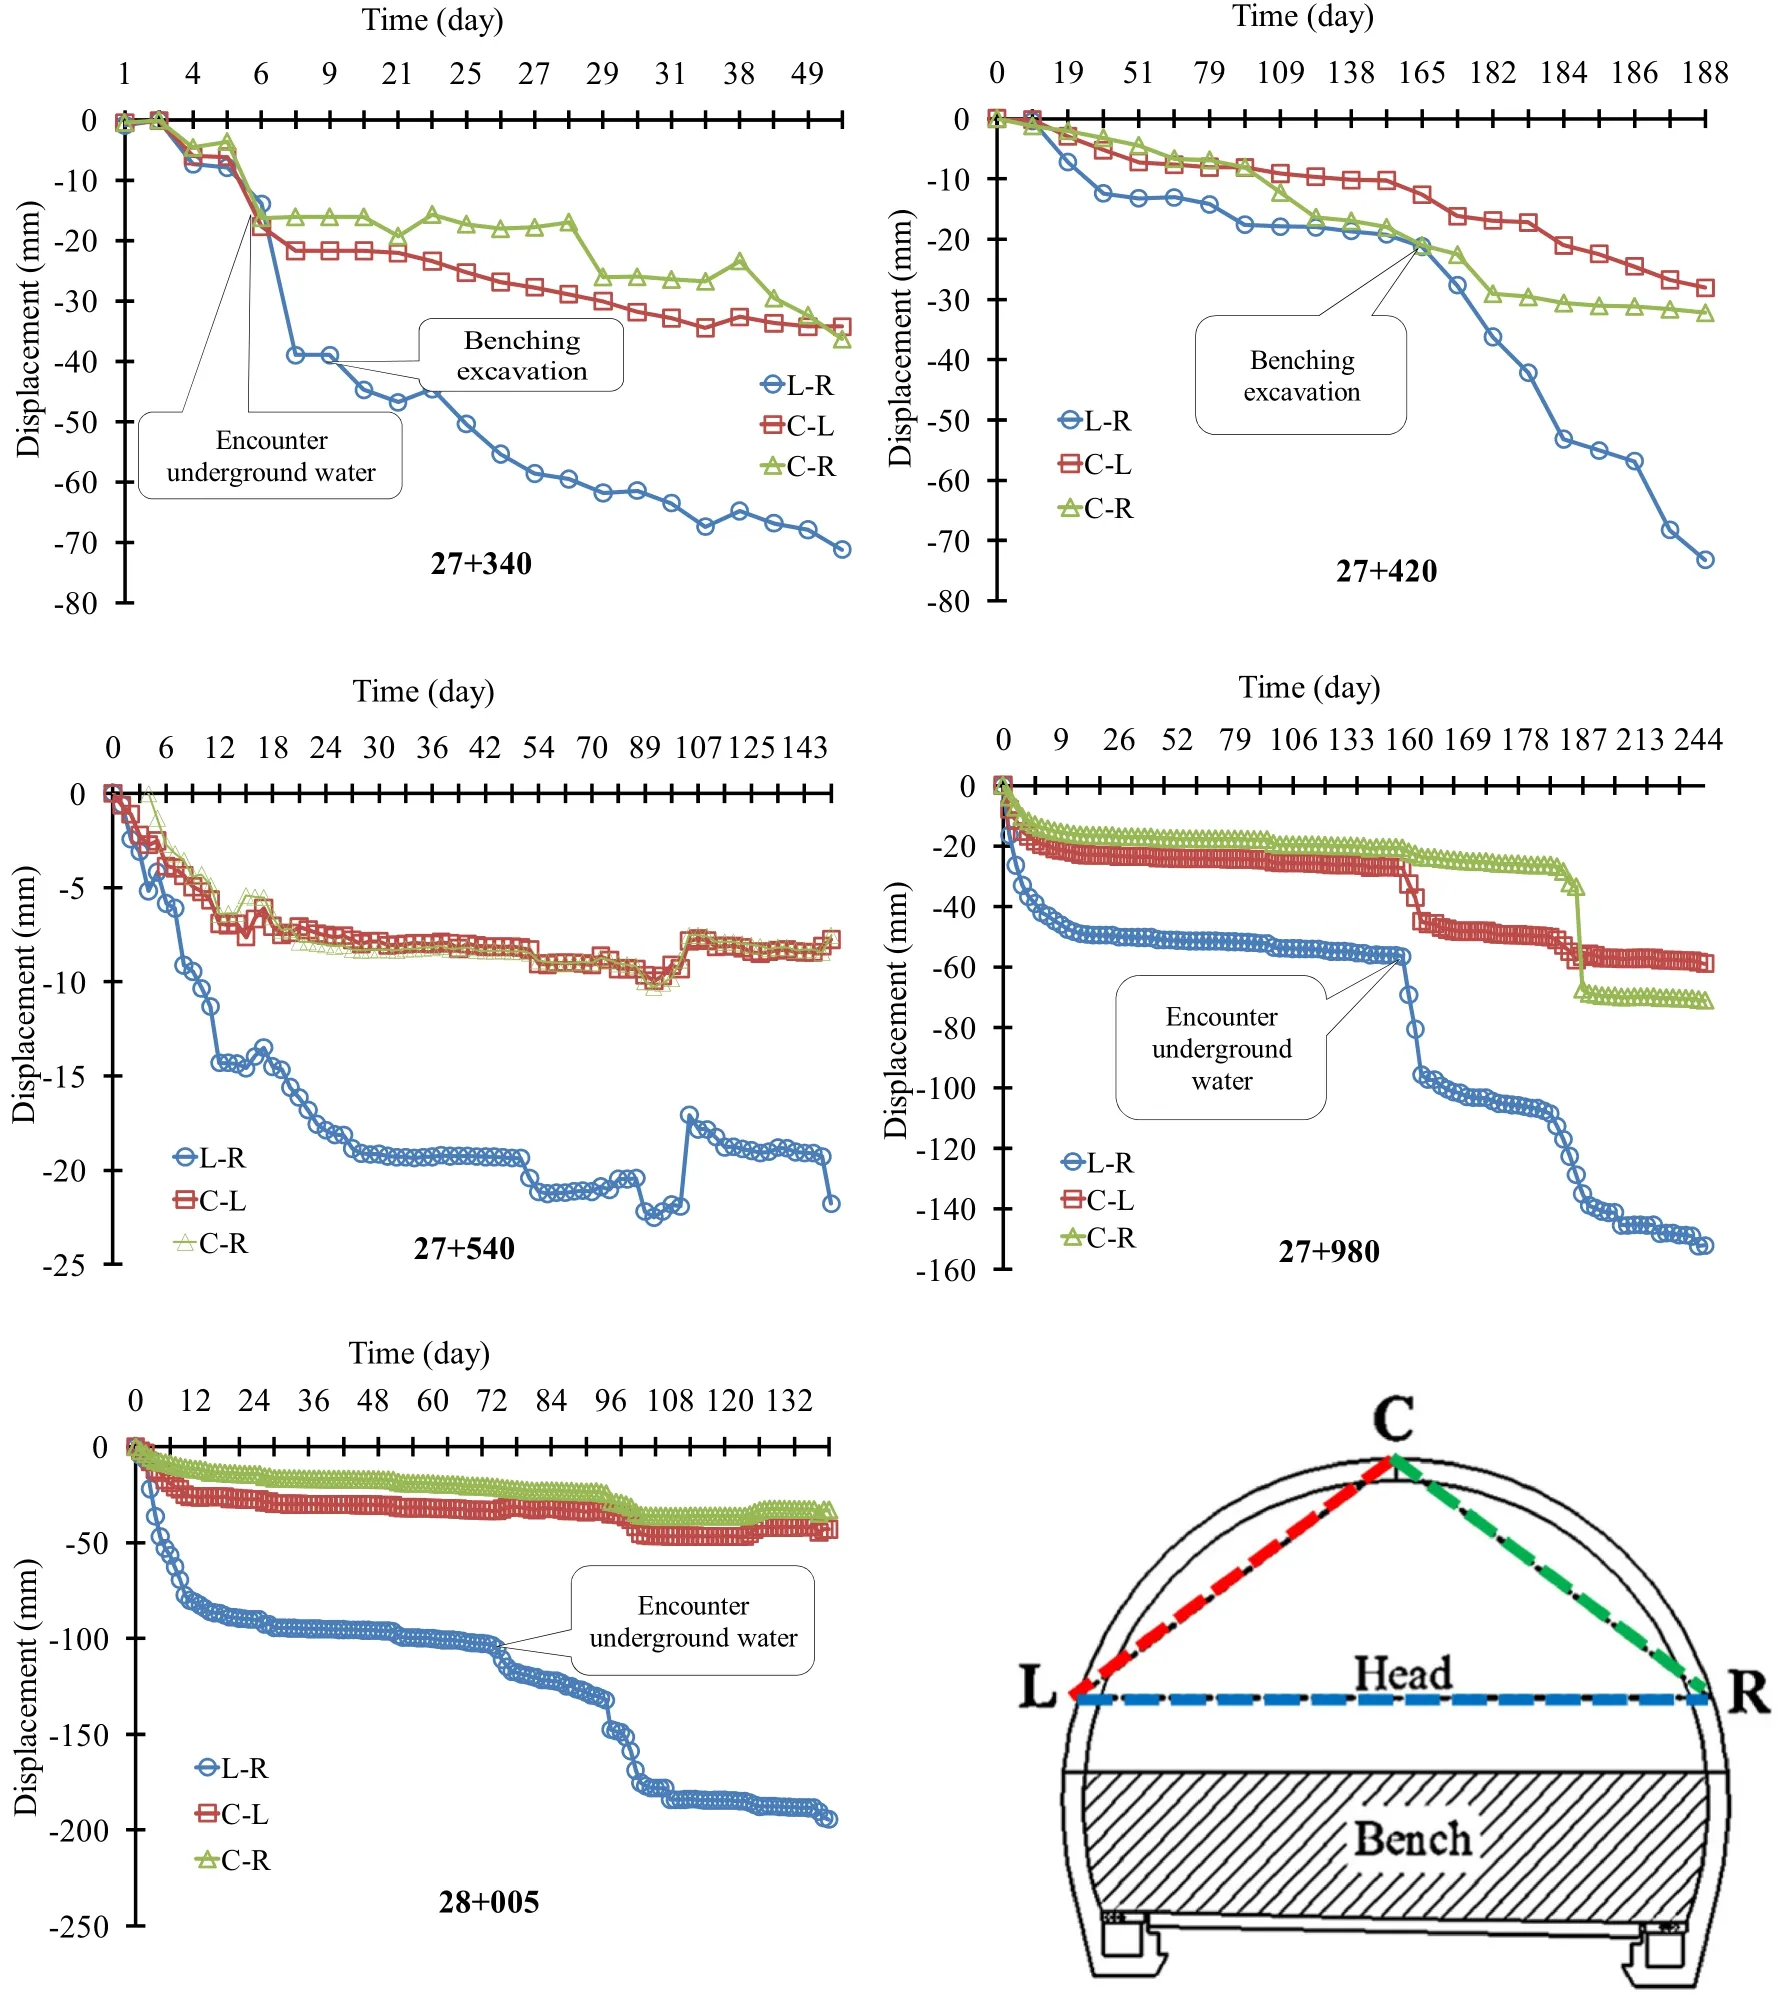
Fig.7 Monitoring results of unstable stations in Shibli twin tunnels

Fig.8 Monitoring results of unstable stations in Ilam-Mehran tunnel
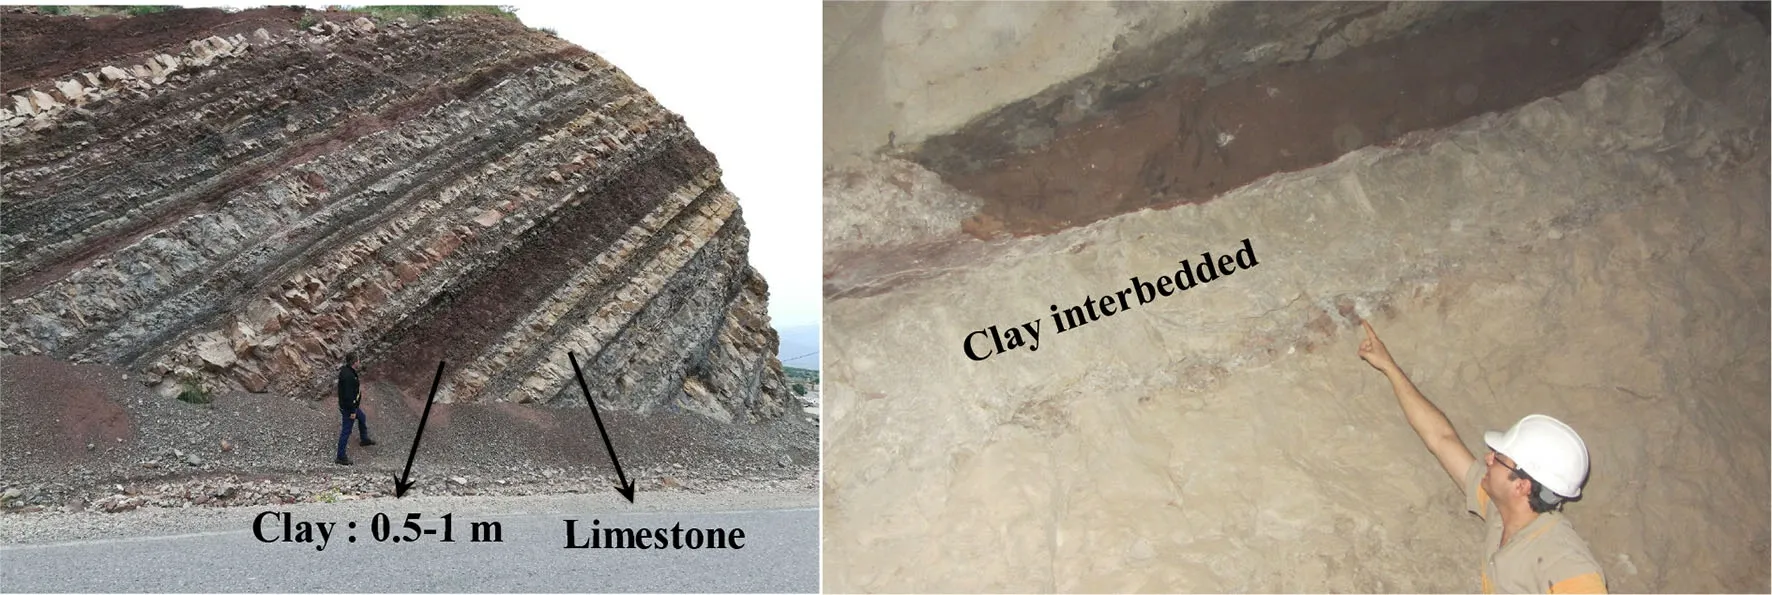
Fig.9 Clayey interbeds in the study areas
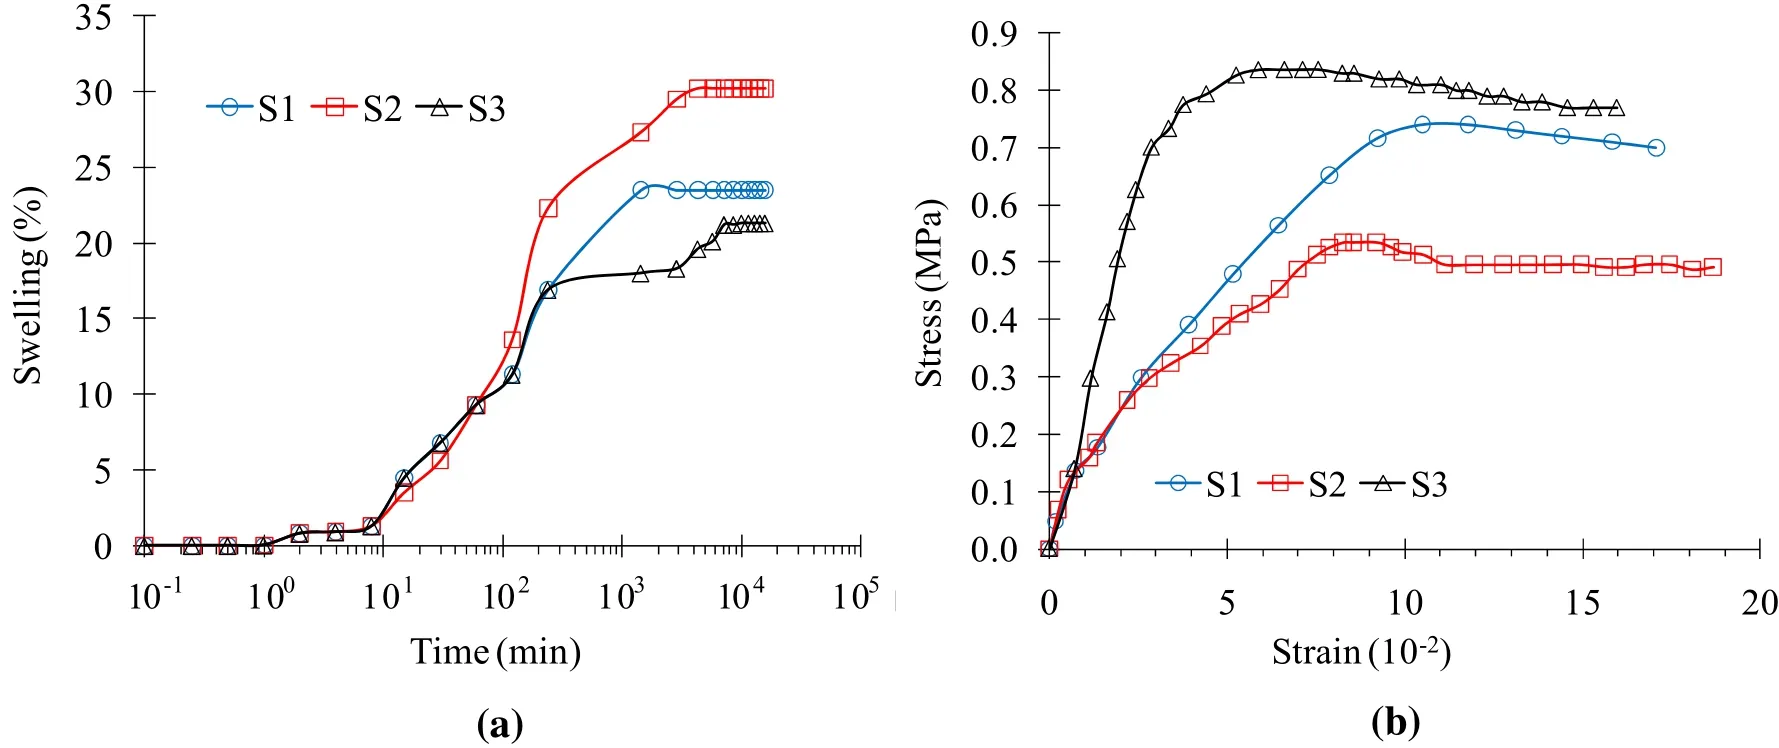
Fig.10 Laboratory tests on clayey interbeds samples.a Swell-time curves.b UCS test

Table 4 Swelling potential in various samples
4 Empirical correlations
In order to determine the relationship between the strength factor and radial strain,the strength factor was determined according to the procedure mentioned in Sect.2 for each station.The amount of the radial strain for each station was also obtained from its monitoring results.Radial strain of each station is defined as the percentage ratio of tunnel absolute displacement to tunnel radius[6].By convergence tape,the absolute displacement of each pin is not calculated but instead the relative change in length between a pair of pins is determined[33].As described in Sect.2,the maximum relative displacement was determined for each station by use of the monitoring graphs(Figs.7,8).In order to simplify the expression and avoid writing large mathematicalrelations,the relationship proposed by Sakurai[34,35]is used to convert the relative displacement to the absolute displacement.Using the transformation matrix,Sakurai explained the relationship between relative(Δu)and absolute displacements as Eq.(6).In this method,the rotation and vertical displacements of pins will be ignored after the displacement(i.e.,v′1=v′2=0).
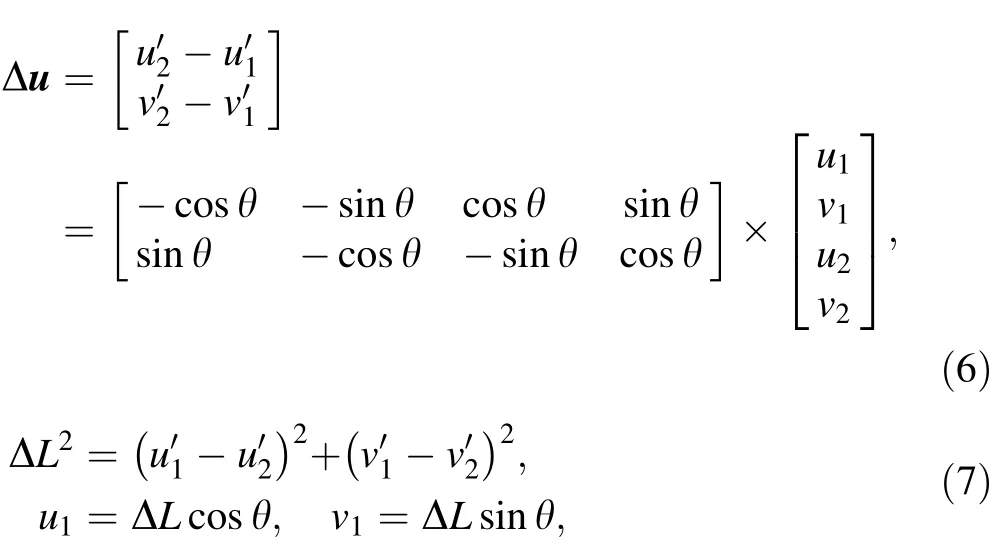
where(u1,v1)and(u2,v2)are initial coordinates of pins 1 and 2,respectively,and(,)and(,)are their secondary coordinates after displacements;ΔL is distance between two adjacent pins(see Fig.14).
According to the mathematical principles,the distance between two points can be expressed as Eq.(7).Using Eqs.(6)and(7),the absolute displacements of pins 1 and 2 can be determined.The procedure for pins 1 and 3 will also be repeated to eventually determine the absolute displacements of pins,including u1,u2and u3.The average of the three displacements is then used as the value u for determining the radial strain in Eq.(1).Note that the proof of Eq.(6)is omitted in this paper,and its details can be found in Sakurai's papers[34,35].

Fig.11 Over excavation technique in swelling stations
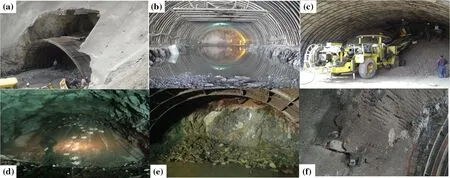
Fig.12 Instability events that occurred in the tunnels.a Wedge failure in portal.b Control of steel ribs buckling in roof.c-e Face collapse.f Cracks in the shotcrete
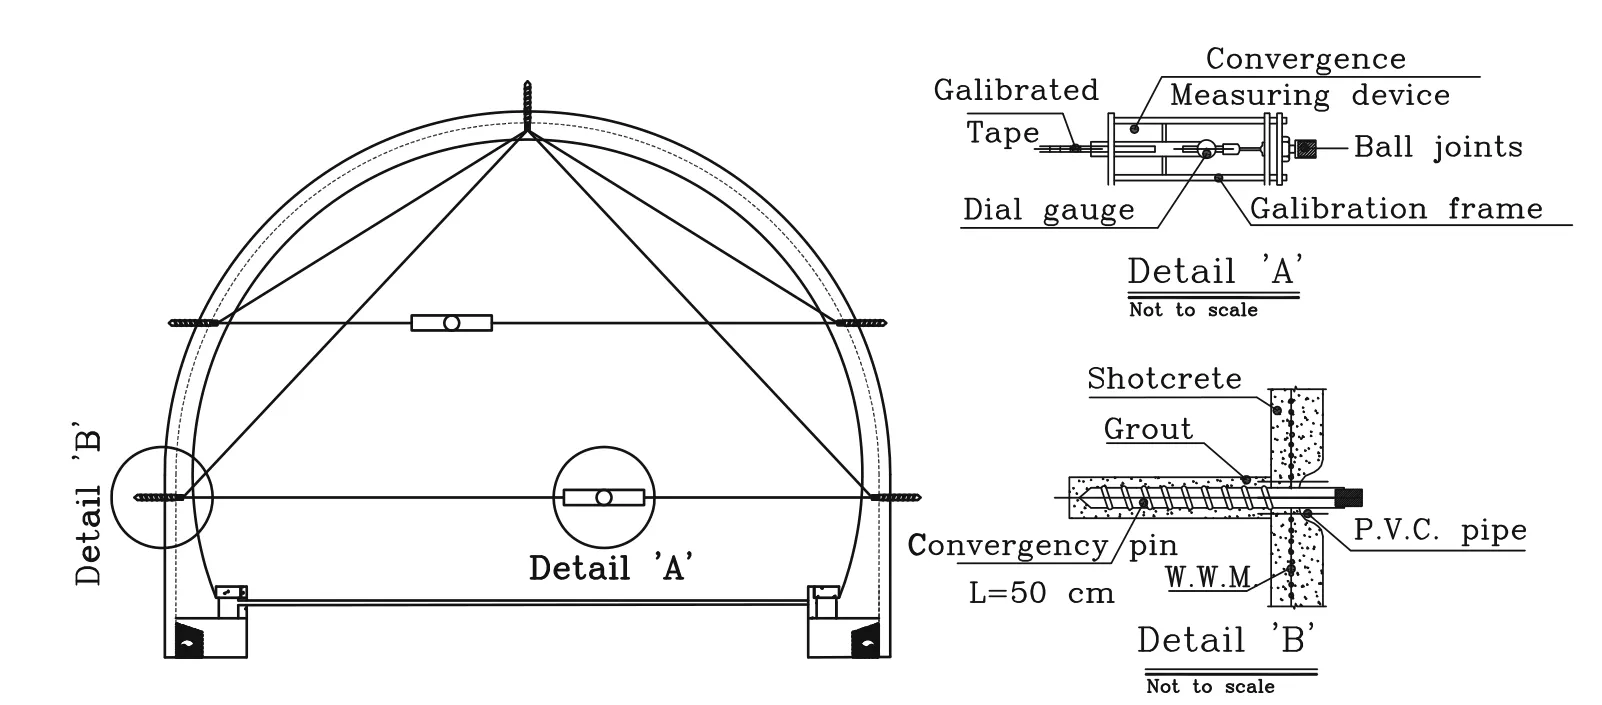
Fig.13 Details of convergence pins station
After determining the displacements of pins,their mean value was calculated and divided by the radius of the tunnel to obtain the radial strain at that station.According to Hoek criterion[6],if the radial strain is less than 1%,the tunnel will be in a non-squeezing condition.After calculating the strain and the strength factor at different stations as shown in Table 5,the squeezing potential in different areas was controlled based on this criterion.The results showed that the stations are in a non-squeezing category.
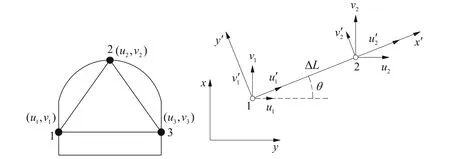
Fig.14 Displacement components at two adjacent measuring points

Table 5 Tunnel radial strain and strength factor
Figure 15 shows the relationship of the radial strain with the strength factor,which was plotted using the data of case studies by Chern et al.[4]and Hoek[6].From Fig.15,we obtained Eq.(8),which,with a correlation coefficient of 0.9,is the optimal regression line passing through all points and represents the general relation of radial strain and strength factor.

The coefficient of determination between the measured and predicted values is a good indicator to check the prediction performance of the model.In this study,the root mean square error(RMSE)(Eq.9)and the variance accounted for(VAF)(Eq.10)indices were calculated to control the prediction capacity of the predictive models developed in the study.Theoretically a VAF of 100 and an RMSE of 0 stands for an optimal model.Comparison of the predicted deformation with the observed data in Golab water conveyance tunnel[36]shows that the VAF and RMSE were 77%and 2%,respectively,implying a fairly high prediction performance.

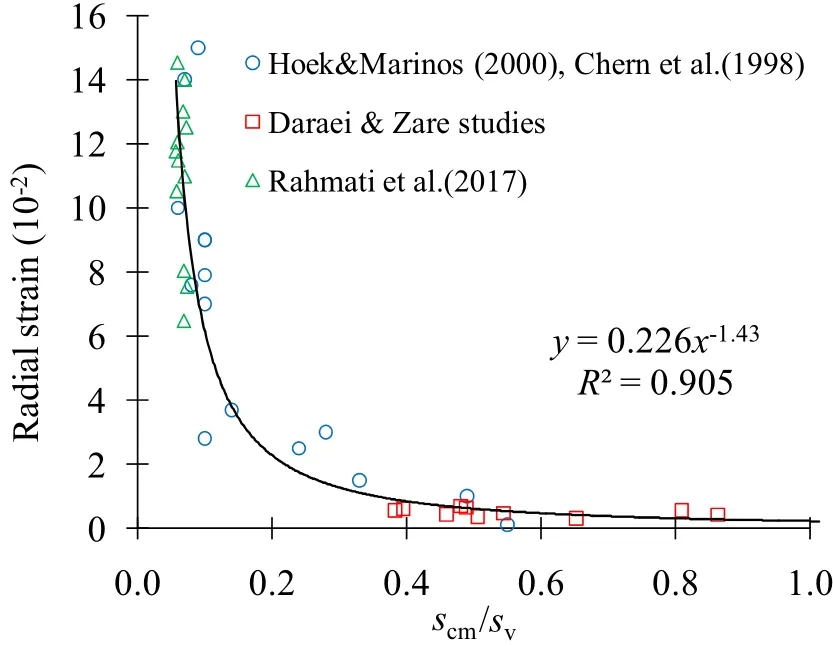
Fig.15 Relationship of the radial strain with strength factor

where y and y′are the measured and predicted values,respectively;n is the number of station readings,and Var(·)is the variance operator.

Table 6 Instability mechanism in terms of strength factor
5 Discussion
Considering the types of failures and the strength factor values shown in Figs.12 and 15,it can be stated that if the strength factor is between 0.6 and 1,the strength of the rock mass is close to the in situ stress,and the tunnel in hard rock is prone to instability in the form of fall or wedge slip.Such conditions would be expected in medium-to high-strength rocks as well as in areas with low stress(Fig.12a).In this case,the behavior of discontinuities is of great importance.In weak rocks,the instability of shallow tunnels is usually observed as cave in face or ‘‘caving.''Hoek[37]found that‘‘near surface rock masses are subject to stress relief,weathering and blast damage as a result of nearby excavations.These processes disrupt or destroy the interlocking between rock particles that play such an important role in determining the overall strength and deformation characteristics of rock masses.Near surface rock masses tend to be more‘mobile'than similar rock masses in the confined conditions that exist at greater depth''(Fig.12b,c).By reducing the strength factor to the range of 0.4—0.6,the failures become out of the structural control and tend to be ones resulted from stress.Such failures will be seen in the form of large caves in the tunnel crown(Fig.12d,e).By reducing the strength factor,the behavior of the tunnel will tend to be squeezing.Sakurai[38]mentioned that if the strain level exceeds 1%,the instability would be started;and there are few problems with tunnel stability for less than this level.Hoek[6]considered this strain level as a border between nonsqueezing and minor squeezing conditions.When applying 1%strain in Fig.15,the value of related strength factor would be determined about 0.38.It should be noted that squeezing has four classes including minor(1% < εt< 2.5%),sever(2.5% < εt< 5%),verysever(5% < εt< 10%)andextremelysever(εt> 10%)[6].According to Hoek[6],the strength factor of 0.2—0.3 would be considered as minor to sever squeezing class in fact.Hence,the strength factor of 0.38(approximately 0.4)can be considered as the boundary between squeezing and nonsqueezing conditions.The instabilitiesresulted from squeezing will be manifested by large time-dependent deformations.In this case,the tunnel strain will exponentially increase,and the stability control of the tunnel requires special support consideration,including the use of forepoling and face reinforcement and/or multi-sectional excavation methods such as central diaphragm and sidewall drifts using Norway tunneling method(NTM).The new Austrian tunneling method(NATM),however,is not appropriate for all conditions.The NTM,as a further development of tunnel construction theory,is a useful complement to the NATM.The core idea of the NTM is rock classification based on the Q system.High-performance materials are applied as a permanent support,with a secondary lining only set as required by leakage,frost and other hazardous conditions[39].In squeezing conditions,rapid installation of support and careful control of construction quality are recommended.The results show that instability can occur in strains less than 1%,while Chern et al.[4],Hoek[5,6]and Sakurai[38]have quantified the limiting value of unsupported and/or light support tunnel deformation as 1%for unstable ground,which is likely to result in constructional problems.According to the results,the relation between the strength factor and the instability mechanism can be expressed as Table 6.
6 Conclusions
In this paper,the dimensionless empirical correlations have been developed using eight unstable sections from three tunnels in Iran.The obtained results can be summarized as follows:
·The RMSE and VAF values indicate that the modified criterion has an acceptable accuracy and little error in the prediction of tunnel deformation.
·The strength factor of 0.38(approximately 0.4)can be used to determine the boundary between squeezing and non-squeezing conditions.
·The type of failure in tunnel is predictable using the strength factor.If the strength and in situ stress are close to each other,the failure in the tunnel would have structural control,i.e.,falling and/or sliding wedge from wall and roof.In this state,the behavior of discontinuities will be more important.
·Both types of instability(stress-induced and structural)may occur in strain levels of less than 1%.
Open AccessThisarticleisdistributedunderthetermsoftheCreative Commons Attribution 4.0 International License (http://creativecommons.org/licenses/by/4.0/),which permits unrestricted use,distribution,and reproduction in any medium,provided you give appropriatecredittotheoriginalauthor(s)andthesource,providealink to the Creative Commons license,and indicate if changes were made.
 Railway Engineering Science2019年1期
- Railway Engineering Science的其它文章
- Numerical optimisation and experimental validation of divided rail freight brake disc crown
- Analysis of a joint entry-and distance-based cordon pricing scheme:a dynamic modeling approach
- TOD residents'attitudes toward walking to transit station:a case study of transit-oriented developments(TODs)in Bangkok,Thailand
- In fluence of work zone signage on driver speeding behavior
- Speed-density functional relationship for heterogeneous traffic data:a statistical and theoretical investigation
