Value of Texture Analysis of Intravoxel Incoherent Motion Parameters in Differential Diagnosis of Pancreatic Neuroendocrine Tumor and Pancreatic Adenocarcinoma
Yingwei Wang , Xinghua Zhang, Botao Wang Ye Wang,Mengqi Liu , Haiyi Wang Huiyi Ye*, Zhiye Chen *
1Department of Radiology, Hainan Hospital of Chinese PLA General Hospital, Sanya, Hainan 572013, China
2Department of Radiology, Chinese PLA General Hospital, Beijing 100853, China
Key words: neuroendocrine tumor; pancreatic adenocarcinoma; texture analysis;intravoxel incoherent motion; differential diagnosis
p ANCREATIC adenocarcinoma (pAC) and pancreatic neuroendocrine tumor (pNET) are the first and second in the incidence for pancreatic tumor respectively.[1-2]Management and prognosis for these two tumors are entirely different.For pNET patients with liver metastasis, resection may achieved improved overall survival if lesions can be completely removed,[3-5]and for patients with smallsized tumor, partial pancreatectomy may gain a lower complication rate and a significantly higher overall survival when compared with aggressive surgery approach.[4,6]In addition, follow-up with surveillance may be an alternative for patients with nonfunctioning tumor less than 2 cm in diameter.[3-4]Given the fact that pNET had a higher resectability and relatively better prognosis, it would be important to differentiate pNET from pAC prior to surgical treatment.[7]
The characterized imaging feature of pNET is hyper-enhancement, whereas pAC often shows hypovascular and desmoplastic. Dynamic MR imaging or CT is frequently performed to observe the difference of vascular perfusion for the two neoplasms in clinical practice.[8]However, enhancement patterns of pNET or pAC on images are very sensitive to changes in tumor size, degree of differentiation and extent of necrosis,resulting in great difficulty in distinguishing them.[9]Moreover, contrast agents are likely to give rise to renal damage to patients, therefore contrast enhanced MR imaging cannot be performed sometimes, especially for people with renal insufficiency.
Diffusion-weighted imaging (DWI) is a proven,noninvasive MR imaging modality to have been applicable to getting perfusion and diffusion characteristics of tumors without using contrast media, carried out with sufficient b values by using biexponential fitting based on intravoxel incoherent motion (IVIM) model.[10-12]Quantitative IVIM parameters have been increasingly used to diagnose and differentiate pancreatic lesions recently.[13-21]Owing to the difference of the two tumors in spatial distribution of cellularity and vascularity, texture analysis would be superior to describing pancreatic lesions. previous studies have used texture or histogram analysis of MR imaging or DWI to differentiate pancreatic lesions.[21-23]However, there have been rare literature reports describing texture features of IVIM parameters to differentiate pancreatic tumors.Therefore, we performed this study for the purpose of evaluating diagnostic efficiency of texture features derived from IVIM parameters to distinguish between pNET and pAC.
PATIENTS AND METHODS
Patients
We retrieved image database of our hospital and identified 132 patients who were suspected of pancreatic tumor and underwent MR examinations including multi-b-value DWI in the period of Jun 2015 to Mar 2018. According to the following exclusion criteria, 82 patients were excluded from this study: (1) patients who had accepted treatment before MR examination;(2) those with pathologically confirmed other pancreatic diseases or without pathological results; (3) The imaging quality was inadequate for analysis. Finally, 18 pNET patients including 10 males and 8 females and 32 pAC patients including 20 males and 12 females were enrolled in our study. The mean age of pNET patients and pAC patients was 47 (range 26-59) and 54 (range 37-68) years. The distributions of gender(χ2=0.231, P=0.630) and age (t=2.013, P=0.052) of the two groups were similar. There were no significant differences in tumor diameter between the pNET and pAC groups [3.68 (range 1.3-5.7) vs. 4.45 (range 2.9-6.7) cm; t=0.938, P=0.367].
The ethics committee of Chinese pLA general hospital granted this retrospective study, and informed consent was waived.
MR imaging
All patients underwent MR examination with 3-T MR scanner (Discovery MR750, GE Healthcare, Milwaukee, WI, USA) with a 32-channel body array coil. The pancreatic MR imaging protocols were as follows: axial respiratory triggering fat-suppressed fast spin echo(FSE) T2WI, 3D liver acquisition with volume acceleration flex (LAVA-Flex) with breath-hold before contrast media injection and arterial, portal venous, equilibrium and delay phases after contrast media administration.
DWI was performed prior to contrast media administration. Spectral presaturation attenuated by inversion recovery was used for fat suppression.DW images were acquired by using axial single-shot echo-planar imaging pulse sequence in a free-breathing manner with following parameters: repetition time 5000 ms; echo time 52 ms; echo-planar imaging factor 136; bandwidth 250 kHz per pixel; field of view 380 mm×380 mm; matrix size 160×160; slice thickness 6 mm; intersection gap 1 mm; numbers of section 22; numbers of excitation 4; 10 b values (0, 25,50, 75, 100, 150, 200, 400, 600, 800 s/mm2); acquisition time 284 s.
Imaging analysis
DWI data were imported into an AW4.5 Workstation (GE Healthcare) for IVIM analysis. Based on IVIM model,IVIM parameters including perfusion fraction (f), fast component of diffusion (Dfast) and true diffusion parameter slow component of diffusion (Dslow) were calculated on a voxel-by-voxel basis and reorganized into gray-encoded parametric maps by using MADC program. The parametric maps were transferred into an open source software ImageJ (1.41v, https://imagej.nih.gov/ij/) to perform texture analysis using Gray-level Co-occurrence Matrix (GLCM) method by its plugin.The setting of GLCM was as follows: the size of the step in pixels 1 and the direction of the step 0 degree.The texture features including Angular Second Moment(ASM), Inverse Difference Moment (IDM), Correlation,Contrast and Entropy were measured.
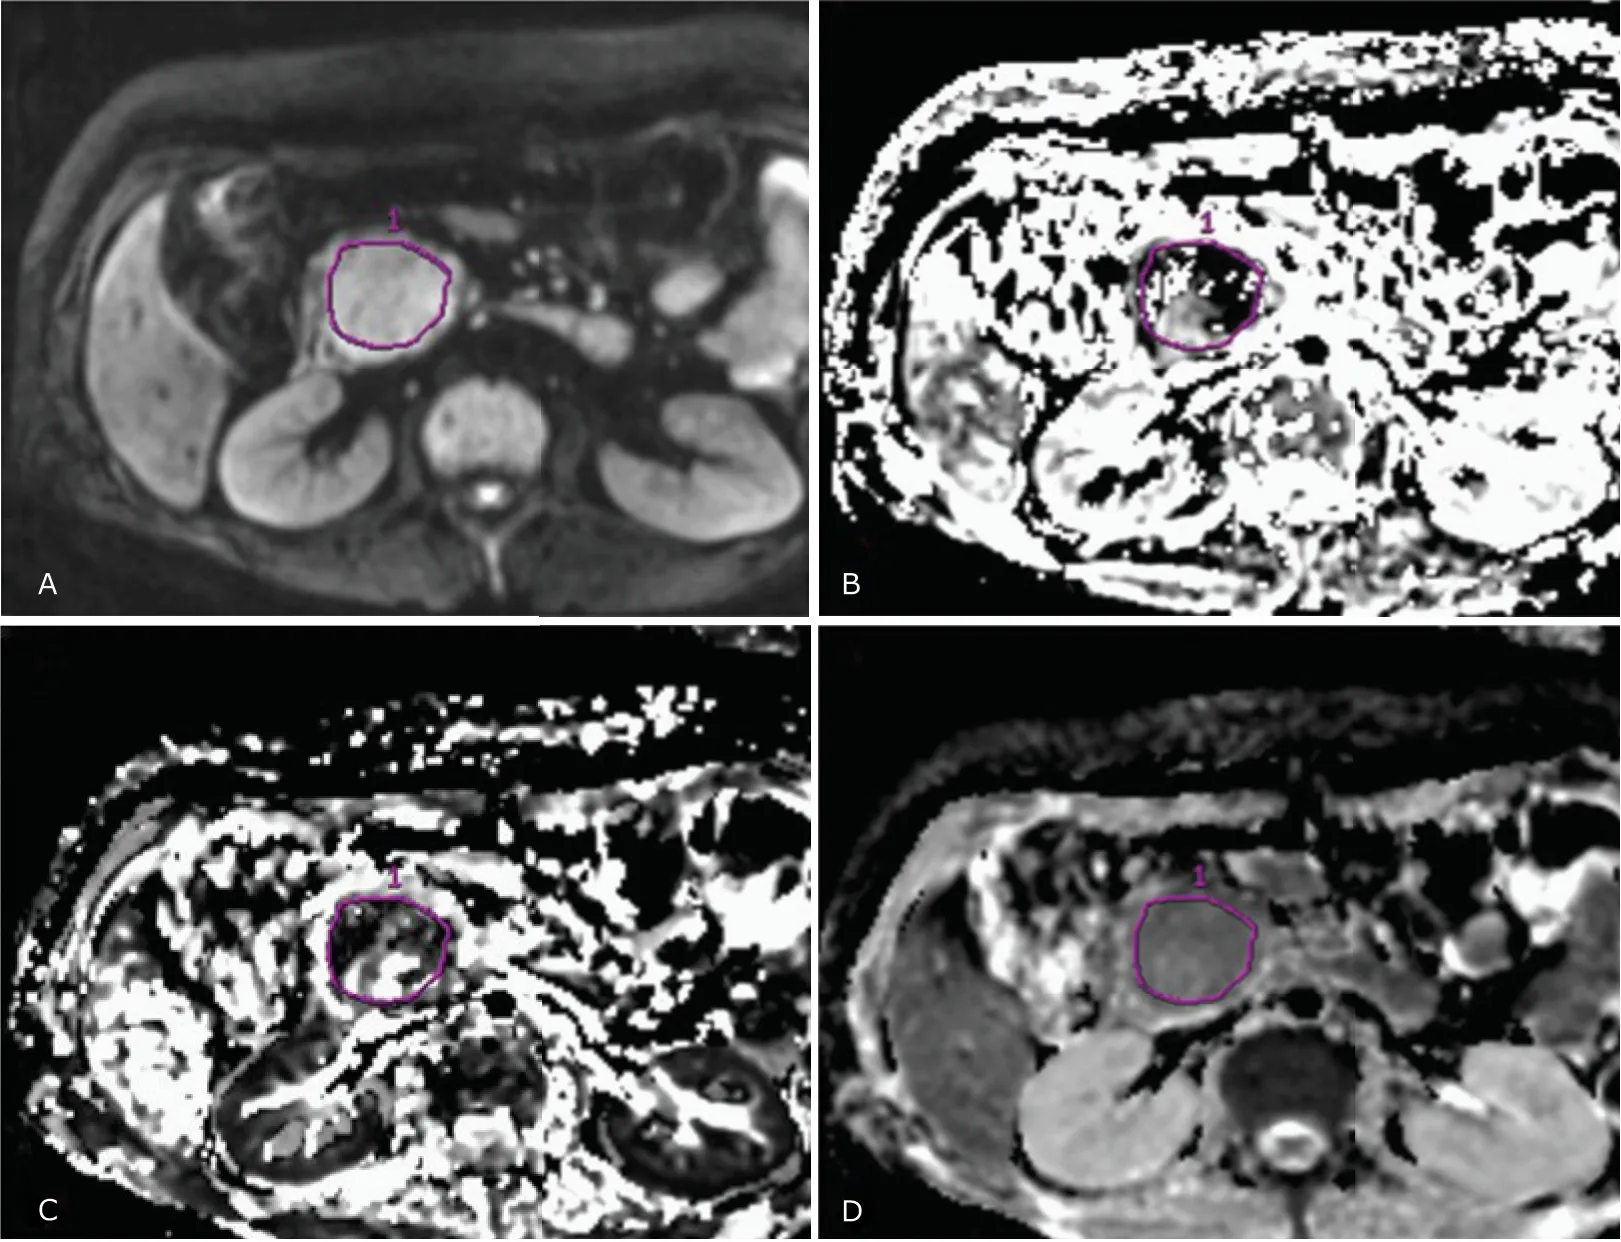
Quantitative analysis of IVIM parameters was performed by an experienced radiologist with 8 years of experience in abdominal MRI, who was blinded to the pathological results. Using conventional pancreatic MR images as anatomic references to identify the extent of the lesion, freehand regions of interest (ROIs)were drawn on the enhancing solid portion of tumors with maximal area on DW images at a b-value which best revealed the tumor margin, while avoiding the vessels, pancreatic duct, necrosis and cystic components. Well-matched copies of the ROIs were automatically and synchronously generated on each IVIM parametric map on corresponding locations (Figure 1)to obtain the mean value of each parameter by using built-in software (MADC programs on AW4.5 Workstation). Furthermore, the similar ROIs were manually drawn on the same locations of IVIM parametric maps to obtain texture features of each parameter by using the software ImageJ. To improve the accuracy of the measurement, ROIs were placed for three times by the same radiologist on the same image, and the average value was regarded as the final result.
Statistical analysis
Statistical analyses were performed using the SpSS Statistics Software Version 22.0 (SpSS Inc., Chicago,IL, USA). Normally distributing quantitative data were presented as mean ± SD and compared with independent t test, while non-normally distributing data presented as median (quantile range) and compared with Mann-Whitney U test. Qualitative data were compared with Chi-square test.
The Binary Logistic regression analysis was performed using forwards method with pNET and pAC as dependent factors, and IVIM parameters and their texture features showing statistically significant difference between the two groups as independent factors. The variables enrolled in the logistic regression equation were determined by Wald χ2value.[24]
To evaluate the diagnostic efficiency of IVIM parameters and their texture features in differentiating pNET from pAC, receiver operating characteristic(ROC) curve was built and pathological diagnosis was regarded as gold standard. To evaluate diagnostic performance of logistic regression model with combined variables in differentiating pNET from pAC, ROC curve was drawn and the probability derived from the logistic regression equation was regarded as the state variable. Areas under ROC curve (AUC) and cutoff values with the largest Youden index (the sum of sensitivity and specificity) were calculated from ROC curves and were regarded as the optimal diagnostic point. A rough guide for assessing the diagnostic efficiency based on AUC was as follows: excellent, AUC ≥0.9; good, 0.9> AUC ≥0.8; fair, 0.8 > AUC ≥0.7; poor, 0.7 > AUC≥0.6; fail, 0.6 > AUC ≥0.5.[25]Statistically significant difference was set at a P value of less than 0.05.

Figure 1. IVIM parameters measurement of the lesion. A ROI was drawn on the lesion with maximal area on DW image(A), and the mimic ROI was automatically generated on parameter f map (B), Dfast map (C) and Dslow map (D) on the corresponding location.
RESULTS
IVIM parameters
The mean value of parameter f in the pNET group was significantly higher than that in the pAC group (27.0%vs. 19.0%; P=0.001, U=-3.214), while no significant differences were found in parameter Dfast[median (quantile range), 30.6x10⁻³(11.8x10⁻³) mm2/s v s.2 8.4 x1 0-3(1 7.3 x1 0-3) m m2/s; P=0.1 9 6,U=-1.294) and Dslow[(1.21±0.13)x10-3mm2/s vs.(1.20±0.19)x10-3mm2/s ; P=0.913, t=-0.110].
Texture features
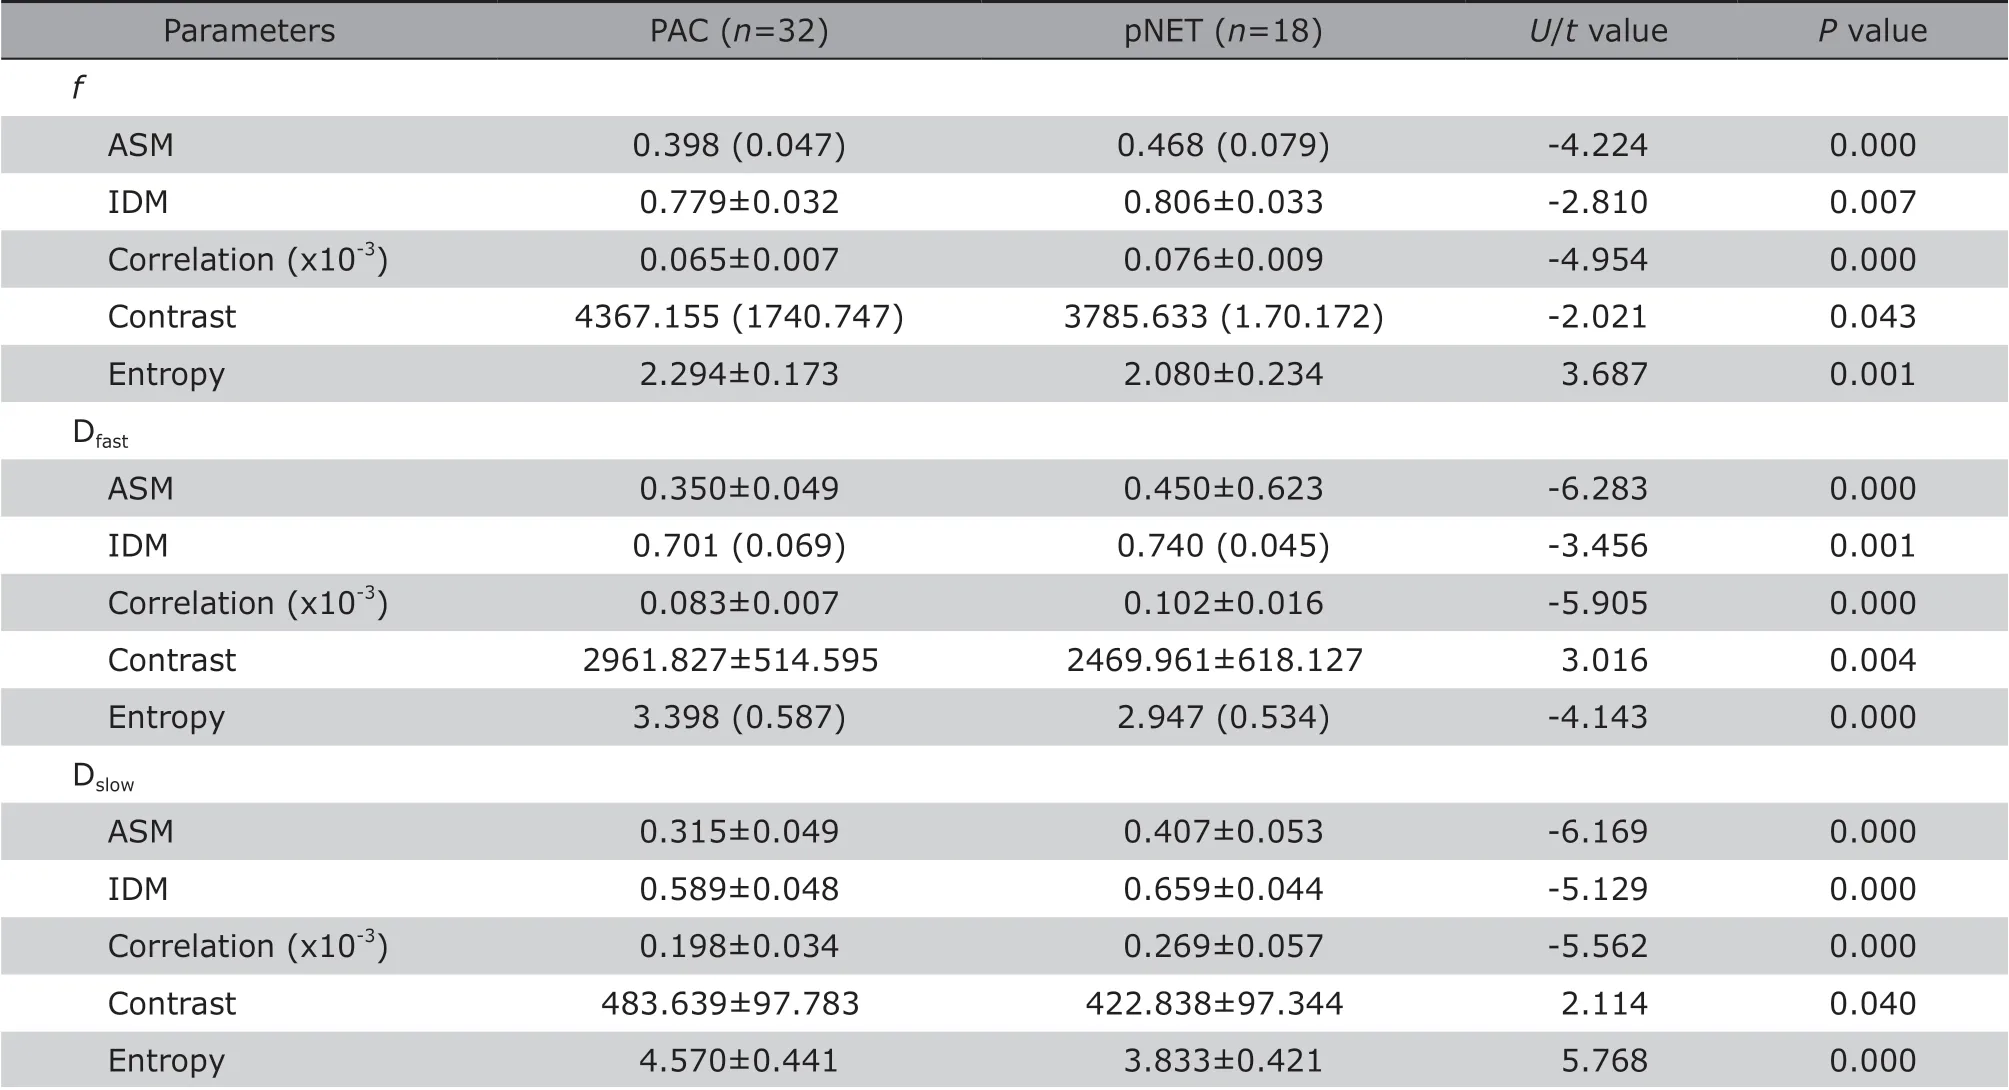
As illustrated in Table 1, all texture features of each IVIM parameter showed significant differences between the two groups. Values of ASM, IDM and Correlation were significantly higher in the pNET group (all P<0.01), while values of Contrast and Entropy were significantly higher in the pAC group (all P<0.01).
Binary Logistic regression analysis revealed both ASM of Dfastand Correlation of Dslowmanifested significantly statistical difference between the two groups(P<0.05) and were regarded as independent variables(Table 2), and then were incorporated into the regression equation: P=1/1+e-(-22.112+35.251×ASM-Dfast+33247.943×Correlation-Dslow).
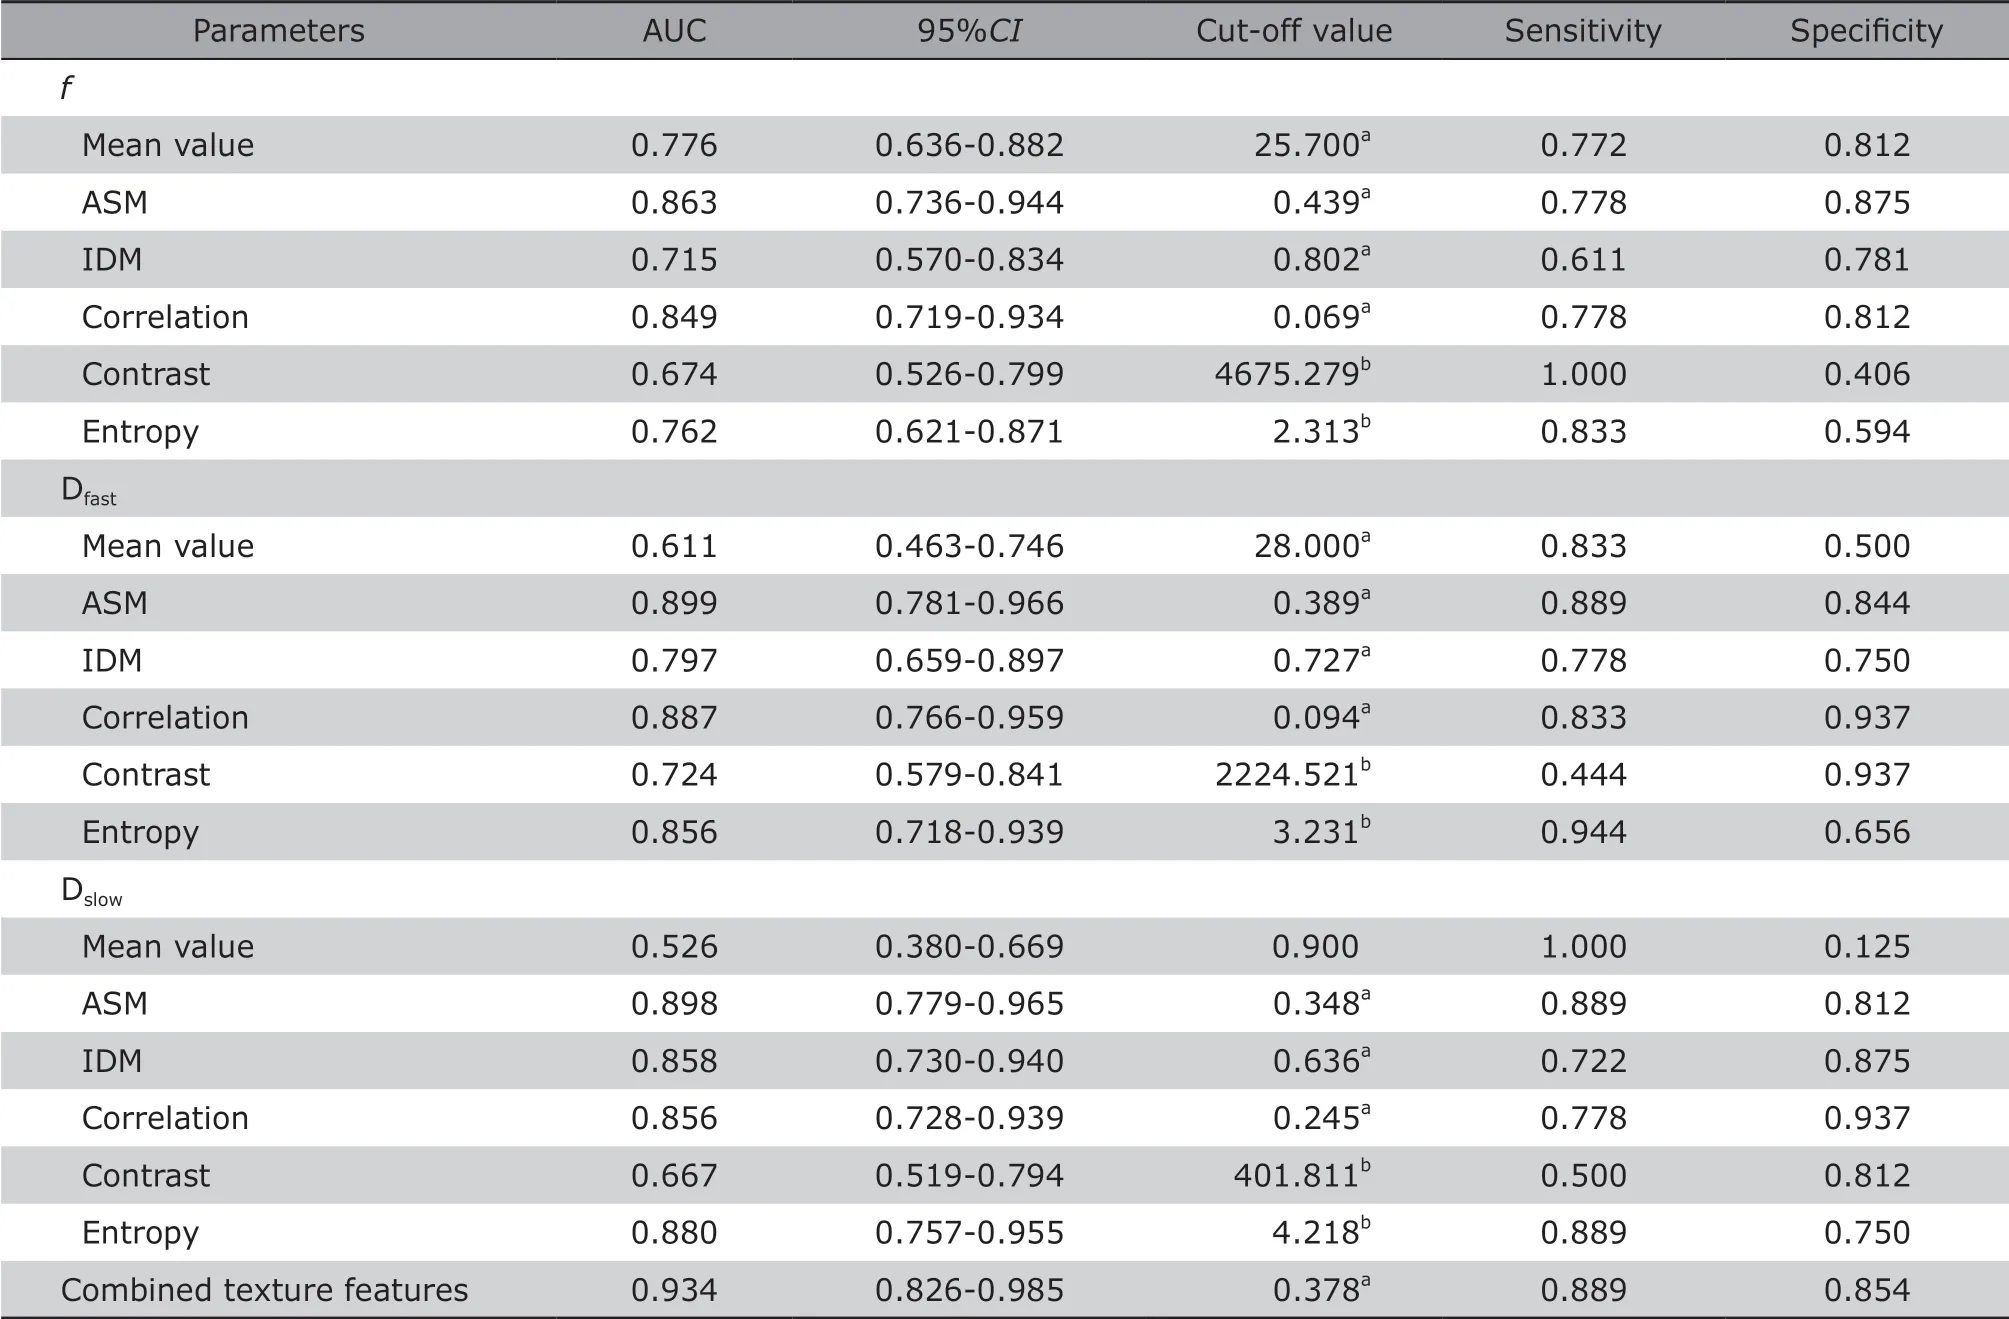
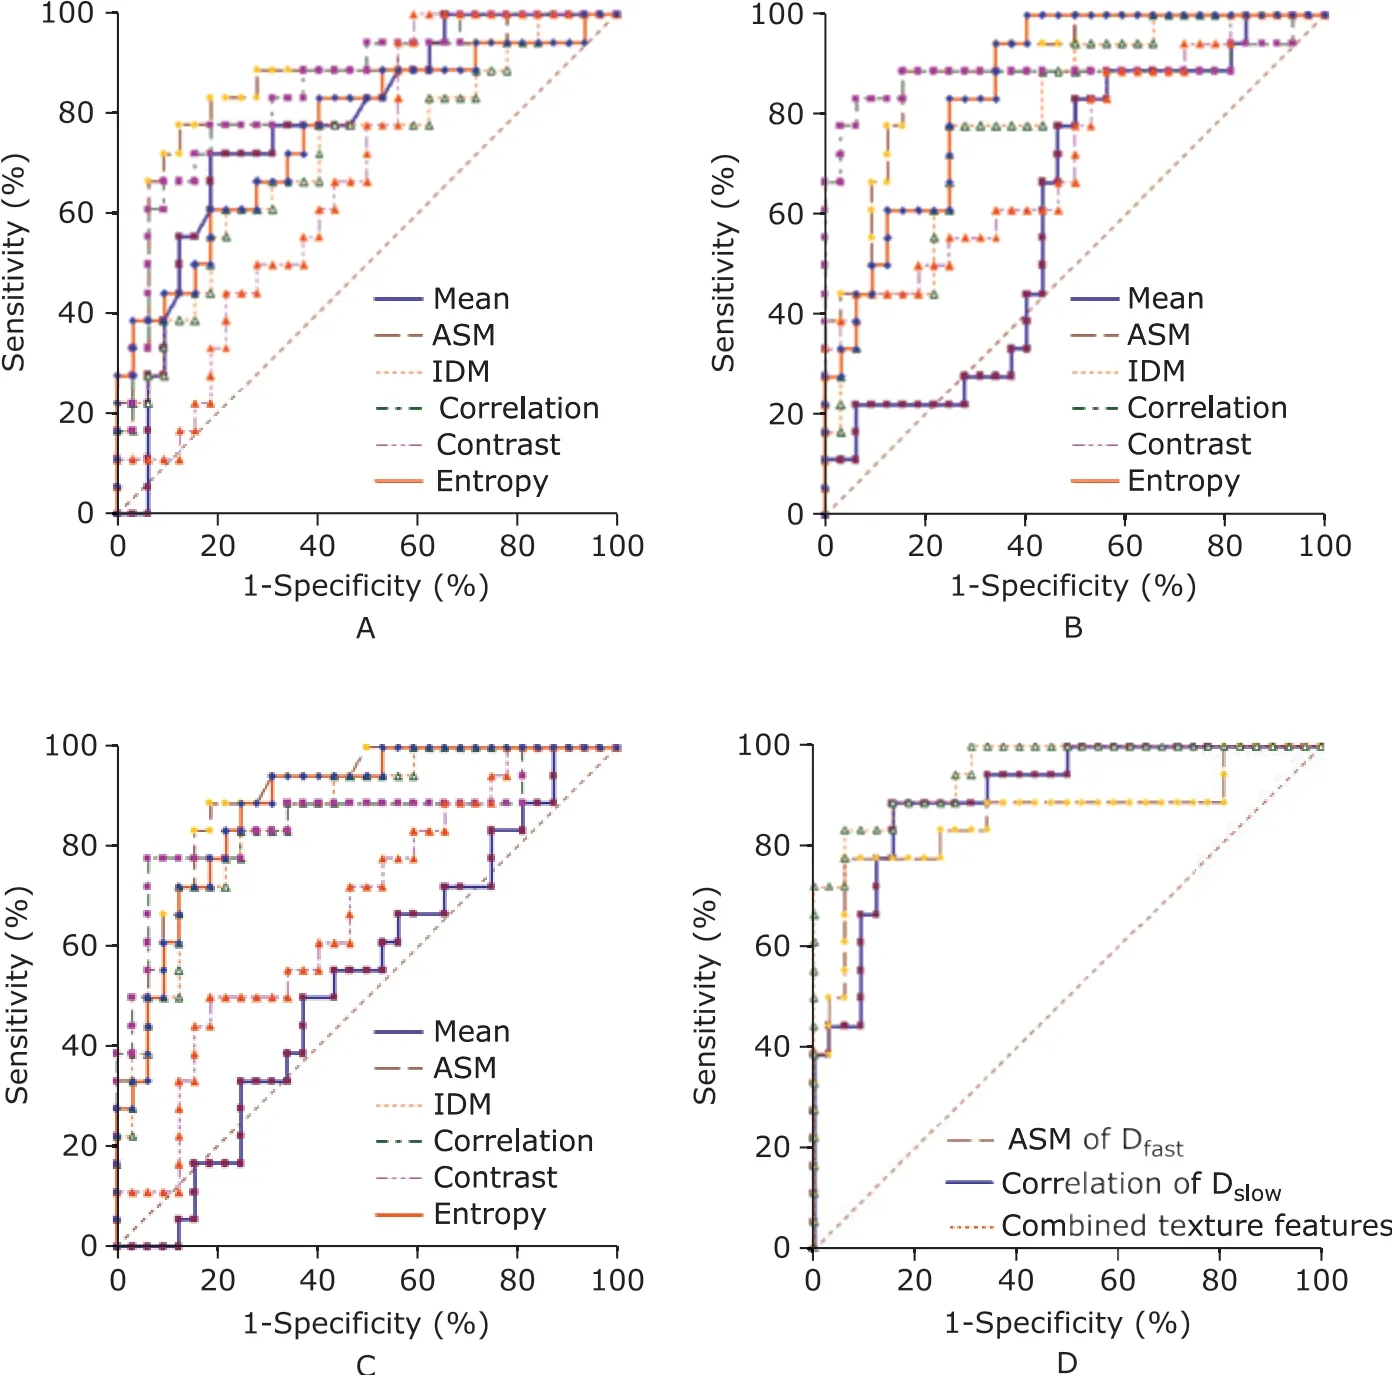
As shown in Table 3 and Figure 2, ASM and Correlation of each IVIM parameter, Entropy of Dfastand Dslow, and IDM of Dfastdemonstrated good diagnostic efficiency for differentiating pNET from pAC (AUC 0.849-0.899), while IVIM parameters failed to show fair diagnostic efficiency (AUC 0.526-0.776). The combined texture features (ASM of Dfastplus Correlation of Dslow) were enrolled in the regression equation and showed a larger AUC than single texture feature did(Figure 2D), and presented the excellent diagnostic performance (AUC 0.934, cutoff 0.378, sensitivity 0.889, specificity 0.854).

Table 1. Comparisons of texture features of IVIM parameters between the pNET and pAC groups

Table 2. Binary Logistic regression analysis of texture features between the pNET group and pAC group
DISCUSSION
IVIM DWI can substantially distinguish perfusion effects from true tissue diffusion on images,[18]making it possible to obtain perfusion-related parameters(f and Dfast) reflecting microcirculation and true water molecule diffusion parameter (Dslow) reflecting cell density of tissues.[26]Our study showed that mean f value was valuable for distinguishing pNET from pAC, while mean values of Dfastand Dslowdid not present helpful in differentiating them, which was consistent with the results of previous studies, which reported that the characteristic IVIM manifestation of pAC was significantly lower f value than pNET.[18-21]Nevertheless, there were inconsistent in regard to Dfast. In the two studies of them, the researchers found Dfastwas significantly lower in pAC than pNET;[18,21]in the other two studies,while they revealed no significant difference in Dfastvalue between the two tumors,[19-20]which may be related with limited measurement reliability of Dfast.[19]
GLCM is a common method of texture analysis to be used to display the relationship of two selected points in distance, direction and change magnitude on image.[27]Texture features derived from GLCM have been applied to diagnose multiple disorders, as the parameters can intuitively offer information on spatial attribute of pixels on images.[22,28-30]In this study 5 texture features were extracted from IVIM perfusion-related or true diffusion parameter maps to show the spatial profiles of cells and blood vessels of tumors. The 5 texture features ASM, IDM, Correlation,Contrast and Entropy respectively represent texture homogeneity, regularity, similarity, variation and complexity of an image. The results showed all the texture features of each IVIM parameter were significant difference between the pNET and pAC groups. pNET wascharacterized by significantly higher values of texture features ASM, IDM and Correlation, and lower values of Contrast and Entropy, which indicated image texture of pNET had greater homogeneity and less variation and complexity compared with pAC. These findings manifested that the arrangement of cells and the distribution of blood vessels of pNET are more homogenous than those of pAC.

Table 3. ROC analysis of mean value of IVIM parameters, texture features and combined texture features (ASM of Dfast and Correlation of Dslow) with logistic regression for differentiating pNET from pAC
In the clinical practice, DWI has been routinely used to observe the signal changes of the lesion and apparent diffusion coefficient (ADC) value is measured to evaluate molecular diffusion. Shindo et al.[23]performed texture analysis of ADC map and demonstrated that only one texture parameter Entropy had diagnostic value and fair diagnostic efficiency (AUC 0.76-0.78) for differentiating pNET from pAC. In the current study, only one IVIM parameter mean f value showed limited value for the differentiation of pAC and pNET. However, the texture analysis demonstrated that all the texture features of each IVIM parameter presented significant differences between the two tumors, and multiple texture features presented good diagnostic efficiency (AUC 0.849-0.899) for differentiating pNET from pAC, while IVIM parameters failed to show fair diagnostic efficiency (AUC 0.526-0.776). Therefore, texture analysis could provide much more diagnostic information than mean value measurement of IVIM parameters and might be considered as an effective tool for differentiating pNET from pAC.
Furthermore, binary logistic regression analysis showed texture ASM of Dfastand Correlation of Dslowwere independent variables for differentiating pNET from pAC. ROC analysis showed that texture features ASM of Dfastplus Correlation of Dslowhad an excellent diagnostic efficiency (AUC 0.899), while single texture feature merely presented good diagnostic efficiency.Therefore, multiple texture features with logistic regression analysis would be more valuable for the differentiation between pNET and pAC.

Figure 2. ROC curves of IVIM parameters and their texture features of the logistic regression model for differentiating pNET from pAC. A: f; B: Dfast ; C: Dslow; D: ASM of Dfast , Correlation of Dslow, and combined texture features.
There are some limitations for this study. Firstly,this is a retrospective study, and likely subjects to selection and verification biases. Secondly, size of sample is relatively small, especially for the pNET group.Thirdly, quantitative analysis was based on single-slice measurement, which may omit potential information from the rest of volume. Whole volume measurement may better represent heterogeneity of lesion. However,whole-tumor analysis is too complicated to be carried out in clinical practice.
In summary, texture features of IVIM parameters provided more valuable diagnostic information than mean value measurement of IVIM parameters, and texture ASM of Dfastcombined with Correlation of Dslowboth enrolled in regression analysis might improve diagnostic performance. Texture analysis of IVIM parameters could be a noninvasive tool to differentiate pNET from pAC.
Conflict of interest statement
The authors have no conflict of interest to disclose.
 Chinese Medical Sciences Journal2019年1期
- Chinese Medical Sciences Journal的其它文章
- Differential Diagnostic Value of Texture Feature Analysis of Magnetic Resonance T2 Weighted Imaging between Glioblastoma and Primary Central Neural System Lymphoma
- MRI Histogram Texture Feature Analysis of the Optic Nerve in the Patients with Optic Neuritis
- Value of Texture Analysis on Gadoxetic Acid-enhanced MR for Detecting Liver Fibrosis in a Rat Model
- Value of Magnetic Resonance Imaging Texture Analysis in the Differential Diagnosis of Benign and Malignant Breast Tumors
- Prediction of Hidden Blood Loss During Posterior Spinal Surgery
- Bilateral Peripheral Facial Paralysis Combined with HIV Meningitis During Acute HIV-1 Infection: A Case Report
