
被毛对热成像检测生猪体表温度精度的影响及噪声滤除方法
2019-03-28 11:38贾桂锋蒙俊宇王登辉冯耀泽
农业工程学报 2019年4期
贾桂锋,蒙俊宇,武 墩,王登辉,高 云,冯耀泽
被毛对热成像检测生猪体表温度精度的影响及噪声滤除方法
贾桂锋1,2,蒙俊宇1,武 墩1,王登辉1,高 云1,2,冯耀泽1,2※
(1. 华中农业大学工学院,武汉 430070;2. 农业部长江中下游农业装备重点实验室,武汉 430070)
生猪皮肤的温度分布是表征其生理状态和疾病的重要指标,通常由红外热成像技术(infrared thermography, IRT)检测,然而由于生猪体表附有被毛在热图像中产生大量的温度噪声,降低了IRT对皮肤温度的检测精度。该文针对此问题探索被毛对皮肤温度分布的影响规律,并设计消除被毛影响的热图像降噪算法,提高对温度分布的检测精度。通过对12头生猪试验,分析目标区域在正常被毛和剔除被毛后温度分布的统计量得出被毛在温度分布中产生大量的“峡谷”状低温噪声,显著降低了目标区域的最低温度及平均温度。根据毛发噪声的影响规律提出网格化最大值-双三次插值算法并确定算法的最佳邻域尺寸为4.25mm。采用均方误差、峰值信噪比等指标定量评价算法的有效性,结果表明经算法处理后,均方误差由0.38下降到0.05(<0.01),峰值信噪比由45.14 dB上升到53.66 dB(<0.01),说明该算法能够滤除热图像中毛发引起的噪声,可提高IRT对温度分布的检测精度。
红外热成像;温度分布;滤波器;猪;图像插值;算法
0 引 言
生猪体表的温度分布是表征其生理状态和疾病的重要指标,可用于异常行为识别[1]、发育状况评估[2]、炎症检测[3-4]、排卵预测[5-6]及发热诊断[7-8]。特别在发热诊断应用中,通过温度异常可早期检测猪瘟、伪狂犬病、蓝耳、圆环和猪肺疫等伴随有发热症状的主要流行病[9],避免造成呼吸、消化和繁殖障碍[10]。红外热成像(Infrared thermography, IRT)测温技术因其非接触式、灵敏度高且响应时间快等优点在畜牧动物检测中备受关注,且不会造成应激反应等负面影响[11-13]。IRT测温原理是利用非制冷红外探测器捕获动物体表辐射的长波段红外线(波长范围通常为7~13m)并将辐射强度按一定的空间分辨率转换为数字图像[14],以反映体表各点温度的高低与分布,继而揭示动物的生理状态及健康状况[3,15]。Sapkota等在研究猪的体表温度与核心温度之间的关系时将肩部、胸部、臀部等9个区域的平均温度作为体表温度以研究其能否准确反映体温的变化[16];Menzel等根据胸部生理结构在第5、7、10根胸椎处各选取3个直径1 cm的圆形区域和腹部2个较大区域作为目标区域(regions of interest, ROI),再根据这些ROI热成像的最高温度和平均温度与肺部的计算机断层扫描所测量的组织厚度进行相关性分析,研究胸部温度分布与胸部及肺部组织厚度的关系[17]。通常生猪体表有不同程度的被毛附着,遮挡皮肤的热辐射,影响体表温度的准确提取,甚至使之不能用于发热诊断[18]。本文针对该问题基于红外热成像技术探索生猪被毛对体表温度检测精度的影响,并根据影响规律提出被毛噪声的滤除算法,以提高表面温度分布检测精度和疾病诊断能力。
1 材料与方法
试验数据于2018年8月在安徽省临泉县某生猪养殖场获取,来源于12头处于空怀期的母猪,胎次2~3胎。环境温湿度用环境指标测量仪(Victor,VC231)测量,试验中猪舍内的平均环境温度和湿度分别为27.4 ℃和80.3%。体表温度采用手持式红外热像仪(Fluke,Ti-300)检测,该仪器分辨率为240×180像素,灵敏度达50mK,精度为2%,可同时采集相同区域的可见光图像,并搭载精度0.01 m的激光测距传感器,用于测量被测目标到热像仪的距离。
试验方案是通过对比感兴趣区域(region of interest, ROI)内正常被毛(normal coat,NC)和剔除被毛后(shed coat,SC)两种状态下热成像的测温数据,分析被毛对IRT测温的影响,根据影响规律设计被毛噪声的滤除算法并验证算法有效性。在生猪背部最后一根肋骨距中心线约6 cm处选取5 cm×5 cm的方形区域作为ROI并用记号笔标记,该区域较为平坦且易于辨识,可确保各试验动物选取区域的一致性,故选择该位置作为ROI。IRT测量前将热像仪的发射率设定为0.97[19-20],背景温度设置为当前环境温度,温度测量范围设定为−20~80 ℃。就绪后采用热像仪在ROI上方0.3 m处采集NC状态下的热图像,然后立即用刀具将ROI内的毛发剃除干净,在同样方位和距离下采集SC状态下的热图像,共采集24幅热图像,用于提取ROI在两种状态下的温度分布,以分析被毛对测温精度的影响。
2 试验数据分析
2.1 试验数据提取与分析
热图像的温度数据由SmartView(Fluke Co, Ltd)软件提取,用矩形选取工具选择热图像的ROI区域,分别提取区域中的最大值、最小值、平均值和温度矩阵的标准差,共12组数据,统计结果见表1。

表1 NC和SC状态下IRT测温的统计数据 Table 1 Statistical temperature of ROI(region of interest) measured by IRT in NC (normal coat) and SC (shed coat) status ℃
注:NC表示ROI正常被毛状态下的热图像,SC表示ROI被毛剔除状态下的热图像。
Note:NCindicates the thermal image of ROI under the normal coat state , andSCindicates the thermal image of ROI under shed coat status.
从数据统计结果中可看出:1)ROI区域内毛发剃除前后,IRT所测温度的统计值均存在差异,SC状态下的温度最大值、最小值和平均值分别比NC状态下平均增大0.19、1.59和0.47 ℃,而标准差减小0.22 ℃,且检验表明2种状态下温度的最小值、标准差存在非常显著的差异(<0.01),而最大值和平均值差异不显著(>0.05),说明被毛对红外测温的最小值和标准差存在显著影响,对平均值有一定的影响,而对最大值则影响较弱;2)标准差反映了数据的离散程度,正常被毛时温度数据的离散程度较大,而剔除被毛后数据的离散程度显著减小,同时最小值和平均值增大,说明被毛引入了大量的低温噪声。通过观察NC状态下的热图像(图1)也发现最小值均是由毛发引起的,并非是真实的皮肤温度;3)正常被毛时的最高温度比无被毛时略低0.19 ℃,在疾病诊断的允许误差范围±0.3 ℃(经验数据)内,仍具有诊断意义,故认为最高温度客观地反映了ROI内的皮肤温度。
因此,正常被毛时IRT检测的温度分布存在大量低温噪声,不能直接用于生理状况评估与诊断,而如何将体表热图像通过图像处理滤除毛发噪声以客观地表征皮肤的温度分布是准确评估生猪发热状态、疾病诊断等应用的关键问题。
2.2 被毛噪声在热成像中的分布特征
生猪背部ROI区域在毛发剃除前后的温度分布分别如图1a和1b所示。由图1a可知,NC状态下的温度分布面上随机出现了若干条“峡谷”状的凹陷,这些相互交错的凹陷降低了ROI的平均温度和最低温度,影响皮肤温度的检测。毛发引起的噪声不同于高斯、瑞利等服从特定分布的概率密度噪声[21],难以用数学模型描述和处理,该噪声由被测物的结构引起,可称之为结构型噪声,且噪声纹理具有一定的方向性。研究该类型噪声的滤波方法需根据其分布特点展开。图1b所示的是SC状态下温度分布,其温度变化较为平缓,未出现“峡谷”状的温度凹陷等噪声,客观地表征了皮肤表面的温度分布,可作为评价滤波算法的真实温度分布。

图1 NC和SC状态下IRT检测的ROI温度分布
3 体表热图像中被毛噪声的滤除方法研究
3.1 热图像的非线性滤波方法设计
图像滤波通常是选择图像中的一点并将该点邻域×像素内的数据点与滤波模板进行运算,运算结果为该点的响应,对图像采用滑动邻域操作或分离邻域操作即可对整幅图像处理[22-23]。为准确提取生猪热图像中的皮肤温度值,应避免由毛发引起的低温噪声参与运算,本文根据被毛对IRT测温值的影响规律及噪声结构提出一种网格化最大值-双三次插值算法(grid maximum- bicubic interpolation, GMBI),其流程如下:
1)图像网格化分割,首先设置邻域尺寸,然后将图像分割为若干个方块,即、的大小均为,分割时要求每个块内至少包含1个皮肤温度数据。若邻域尺寸过小则图像块内可能完全被噪声覆盖,无法提取皮肤温度,而尺寸过大时则降低热图像对皮温分布的分辨力,故邻域尺寸的确定较为关键。
2)根据毛发对体表温度的影响规律可知体表的最高温度能客观反映皮肤温度,故搜索各图像块内的最高温度作为相应网格的响应值,得到图像。
3)对图像通过二维插值算法重建热图像,常用的内插核有盒状核、三角核和立方核,其中立方核生成的曲面具有连续的二阶导数和最小的平方曲率,灰度变化较为平滑[24],与温度分布特征相吻合,故采用立方核进行图像重建。设重建图像的点()在中的映射为(00),则采用该点4×4邻域内16个点(x,y)的值作三次插值,再由式(1)计算16个像素点的权重。

式中为(x,y)到(00)的距离,()为该距离下对应的权重,常量影响清晰度,通常取-0.5[25]。由于图像是二维矩阵,横向和纵向分别进行插值运算。然后再与(x,y)按式(2)做卷积运算。

得到的(,)即为重建图像点(,)的值,迭代计算,即可重建整个图像[26]。
4)输出重建后的图像。
3.2 算法的邻域尺寸确定
GMBI滤波算法实现的关键问题是如何选择合适的邻域尺寸以满足网格化后每个块内至少包含1个皮肤温度值,且分辨率尽可能高。实际上,由于被毛厚度在不同部位上分布不均且猪只之间也存在差异,因此难以直接确定邻域尺寸。本文采用数理统计的方法在同一养殖区内随机选取另外的18头母猪在NC状态下采集相同ROI的热图像进行研究,具体计算方法采用不同的邻域尺寸对热图像进行处理,图像分辨率为×,邻域尺寸L在2到/4范围内以1为步长增长,GMBI滤波算法处理后得到重建图像I,并以I、I+1之间的均方误差(mean square error,MSE)为准则进行判别,MSE()计算方法见式(3)。
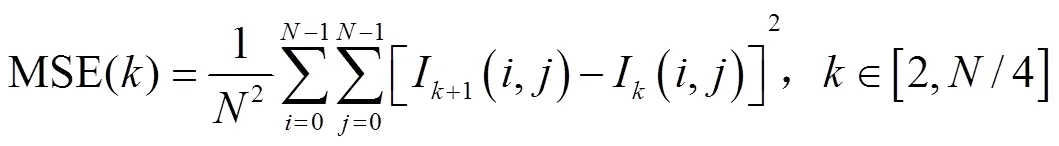
式中为图像分辨率,为循环序数,I指邻域尺寸为L时算法处理得到的重建图像。故每幅热图像经迭代处理后会得到一条MSE()关于L的关系曲线,为刻画MSE()与L的内在关系,对18组MSE()数据进行曲线拟合,并用FCmse表示,以刻画MSE()随L的变化规律。定义FCmse的累计贡献率(accumulative contribution rate,ACR)用于表征不同邻域尺寸L对图像的消噪能力[27],ACR越大,其对应邻域尺寸L的消噪能力越强,ACR计算方法如式(4),各指标其随邻域尺寸L的变化曲线如图2所示。


注:邻域尺寸为L×L像素。
由图2可知:1)在邻域尺寸较小时,I、I-1之间的MSE较大,随着邻域尺寸的增大,I、I-1之间的MSE急剧减小,而后趋于平缓。由此说明,随着邻域尺寸的增大,算法对热图像滤波品质的改善能力逐渐减小;2)从贡献率曲线可得出当邻域尺寸为8个像素点时对应的贡献率为0.92,说明此时已消除92%的噪声,而大于此邻域尺寸时,噪声的滤除能力难以进一步改善,反而降低了对皮表温度分布的分辨力。由于像素对应的实际尺寸由热像仪的视场角和拍摄距离决定,试验中的拍摄距离为300 mm,根据视场的几何关系可算出8个像素对应的实际尺寸是4.25 mm。综上所述,4.25 mm为热图像处理的最佳邻域尺寸,此时既滤除低温噪声,还对温度分布具有较高的分辨力。图3展示了邻域尺寸为2.13 mm(=4像素),4.25 mm(=8像素)和10.63 mm(=20像素)时GMBI算法对图1a热图像的处理结果。
由图3可知,当=4像素时,重建图像的温度分布尚存在一定的噪声,起伏紊乱;当=8像素时,温度分布的变化趋于平缓,与图1b中无毛发时的温度分布相吻合;当=20像素时,邻域尺寸过大,虽噪声被滤除,但温度变化较平,忽略较多细节,降低了温度分布的分辨力。由此表明4.25 mm是GMBI算法消除毛发噪声的最佳邻域尺寸。

图3 不同邻域尺寸对热图像噪声滤除效果的对比
3.3 算法的有效性验证
GMBI算法的有效性采用文中12头生猪的ROI热图像数据进行验证。为定量评价算法的有效性,分别采用NC状态下的热图像和GMBI算法重建的图像与SC热图像间的MSE、峰值信噪比(peak signal-to-noise ratio,PSNR)及统计量差值作为算法性能的评价指标[24,28]。MSE用于度量两幅图像之间的差异程度,PSNR表示信号的最大功率与噪声功率的比值,常用于评价图像的重建质量[29],MSE和PSNR的计算方法分别见式(5)和式(6)[30]。统计量差值则是指两图像温度数据的最大值、最小值和平均值的差值。

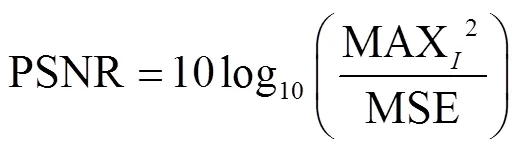
式中为降噪后的重建热像,分辨率为×像素,SC为SC状态下的热图像,MAX表示热图像测温的量程,试验中设置的测温范围为-20~80℃,故MAX的值为100。对热图像数据计算后的各个指标见表2,其中N-S对应的数据是指NC热图像与SC热图像之间的参数指标,G-S指经GMBI重建的图像与SC热图像之间的参数指标。
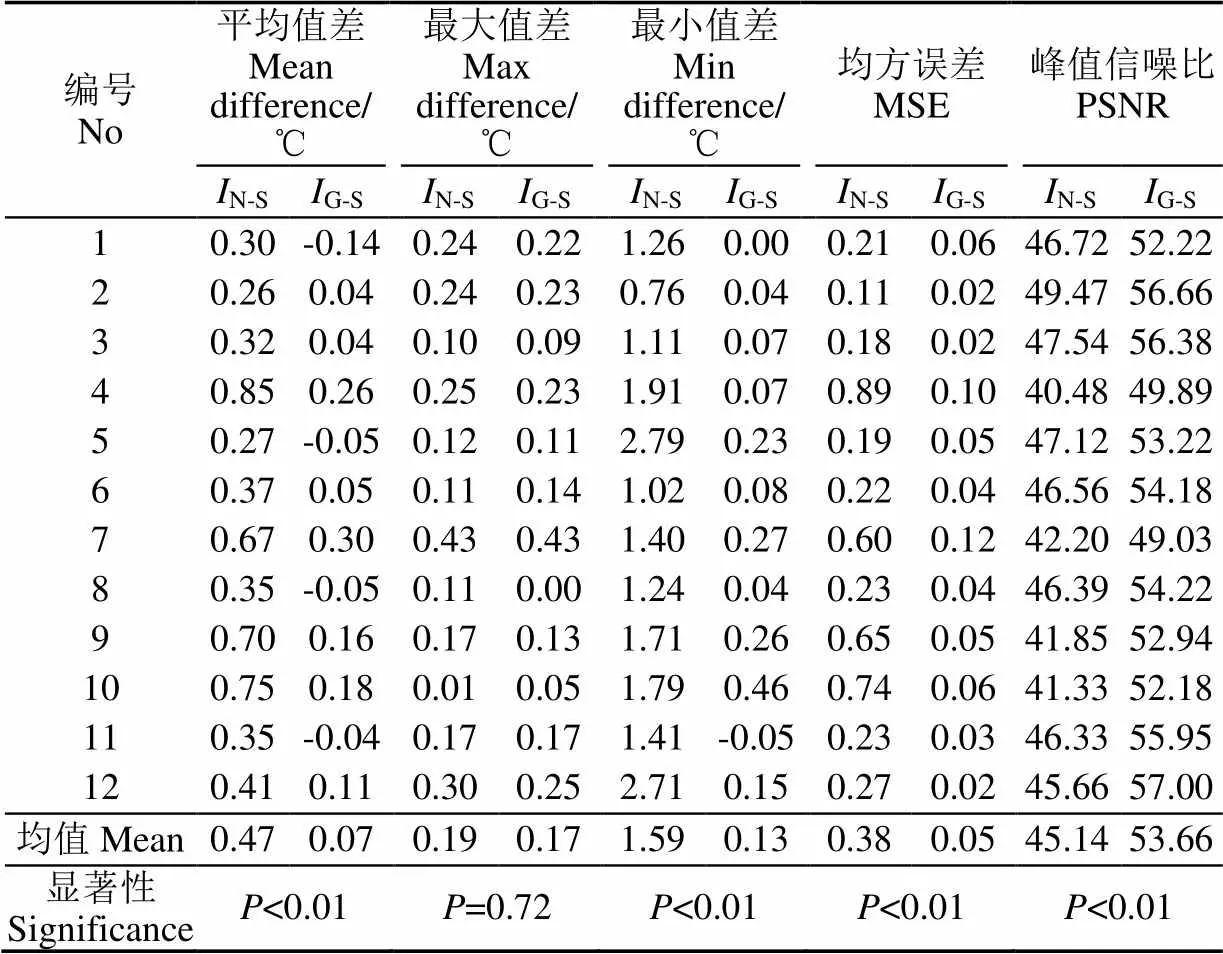
表2 GMBI算法对NC状态热图像处理前后的试验结果
注:N-S指NC状态下的热图像与SC状态下的热图像之间的参数指标,G-S指NCNC状态下的热图像经GMBI算法重建后与SC状态下的热图像之间的参数指标。
Note:N-Srefers to the parameter between the NC thermal image and the SC thermal image,G-Smeans the parameter between the image reconstructed by the GMBI and the SC thermal image.
根据表2数据可得出:1)算法处理后的热图像与SC热图像的最小值差和平均值差比处理前显著减小(<0.01),分别由原来的1.59 ℃、0.47 ℃下降到0.13 ℃和0.07 ℃,最大值变化不大,同时MSE由0.38显著下降到0.05(<0.01)。这些变化说明GMBI算法处理后热图像的统计指标已接近无毛发状态下的热图像,能客观表征生猪表面的温度分布。2)PSNR指标的均值由45.14 dB显著上升到53.66 dB(<0.01),说明经算法处理后热图像的信噪比得到非常显著的提升,即已消除毛发引起的低温噪声,改善了重建图像的质量。
4 结 论
本文通过热成像数据分析确定了生猪体表毛发对温度检测精度的影响规律,并根据影响规律设计热图像处理算法以消除毛发引起的噪声。
1)通过热成像数据分析,证实了基于红外热成像测温时毛发对生猪皮肤表面温度的分布存在影响,毛发产生大量的低温噪声显著地降低了ROI的最低温度(<0.01),而对最高温度影响较小(>0.05),最高温度仍能客观地反映皮肤温度,具有诊断意义。
2)根据毛发对热图像的影响规律提出网格化最大值-双三次插值算法,采用不同邻域尺寸热图像进行迭代处理,并以均方误差累计贡献率为准则确定算法的最佳邻域尺寸为4.25 mm。
3)采用经网格化最大值-双三次插值算法(grid maximum -bicubic interpolation, GMBI)处理前后的正常被毛热图像与无被毛热图像之间的均方误差MSE、峰值信噪比PSNR及统计量差值定量评价算法的有效性,结果表明MSE由处理前的0.38显著下降到处理后0.05(<0.01),PSNR由45.14 dB显著上升到53.66 dB(<0.01),说明提出的GMBI算法是正确的,可显著提高图像信噪比,改善重建图像的质量,使得NC热图像准确表征皮肤的温度分布。
[1] Cook N J, Bench C J, Liu T, et al. The automated analysis of clustering behaviour of piglets from thermal images in response to immune challenge by vaccination[J]. Animal, 2018, 12(1): 122-133.
[2] Caldara F R, dos Santos L S, Machado S T, et al. Piglets’ surface temperature change at different weights at Birth[J]. Asian-Australasian Journal of Animal Sciences, 2014, 27(3): 431-438.
[3] Sathiyabarathi M, Jeyakumar S, Manimaran A, et al. Infrared thermography: A potential noninvasive tool to monitor udder health status in dairy cows[J]. Veterinary World, 2016, 9(10): 1075-1081.
[4] Menzel A, Beyerbach M, Siewert C, et al. Actinobacillus pleuropneumoniae challenge in swine: Diagnostic of lung alterations by infrared thermography[J]. BMC Veterinary Research, 2014, 10(1): 199.
[5] Simoes V G, Lyazrhi F, Picard-Hagen N, et al. Variations in the vulvar temperature of sows during proestrus and estrus as determined by infrared thermography and its relation to ovulation[J]. Theriogenology, 2014, 82(8): 1080-1085.
[6] Luno V, Gil L, Jerez R A, et al. Determination of ovulation time in sows based on skin temperature and genital electrical resistance changes[J]. Veterinary Record, 2013, 172(22): 579.
[7] Traulsen I, Naunin K, Mueller K, et al. Application of infrared thermography to measure body temperature of sows[J]. Zuchtungskunde, 2010, 82(6): 437-446.
[8] Chung T H, Jung W S, Nam E H, et al. Comparison of rectal and infrared thermometry for obtaining body temperature of gnotobiotic piglets in conventional portable germ free facility[J]. Asian-Australasian Journal of Animal Sciences, 2010, 23(10): 1364-1368.
[9] 李春华,王英,蒋凤英,等.猪伪狂犬病研究进展[J]. 动物医学进展,2008,29(3):68-72.
Li Chunhua, Wang Ying, Jiang Fengying, et al. Progress on porcine pseudorabies[J]. Progress in Veterinary Medicine, 2008, 29(3): 68-72. (in Chinese with English abstract)
[10] 陈焕春. 猪系统性疾病的流行现状与防控措施[J]. 饲料与畜牧,2018(2):45-50.
[11] Stewart M, Webster J R, Schaefer A L, et al. Infrared thermography as a non-invasive toot to study animal welfare[J]. Animal Welfare, 2005, 14(4): 319-325.
[12] Petry A, McGilvray W, Rakhshandeh A R, et al. Technical note: Assessment of an alternative technique for measuring body temperature in pigs[J]. Journal of Animal Science, 2017, 95(7): 3270-3274.
[13] 曹哲,施正香,安欣,等. 基于热成像技术的牛舍围护结构传热阻测试方法[J]. 农业工程学报,2017,33(24):235-241.
Cao Zhe, Shi Zhengxiang, An Xin, et al. Evaluation on measure method of heat transfer resistance for enveloped structure of cattle barn based on infrared imaging method[J]. Transactions of the Chinese Society of Agricultural Engineering (Transactions of the CSAE), 2017, 33(24): 235-241. (in Chinese with English abstract)
[14] Usamentiaga R, Venegas P, Guerediaga J, et al. Infrared thermography for temperature measurement and non-destructive testing[J]. Sensors, 2014, 14(7): 12305-12348.
[15] Lahiri B B, Bagavathiappan S, Jayakumar T, et al. Medical applications of infrared thermography: A review[J]. Infrared Physics & Technology, 2012, 55(4): 221-235.
[16] Sapkota A, Herr A, Johnson J S, et al. Core body temperature does not cool down with skin surface temperature during recovery at room temperature after acute heat stress exposure[J]. Livestock Science, 2016, 191: 143-147.
[17] Menzel A, Siewert C, Gasse H, et al. Infrared thermography of the pig thorax: An assessment of selected regions of interest by computed tomographical and anatomical parameters[J]. AnatomiaHistologiaEmbryologia, 2015, 44(2): 107-117.
[18] Bekkering J, Hoy S. Continuous monitoring of ear temperature in boars[J]. Dtw Deutsche Tierarztliche Wochenschrift, 2007, 114(1): 16-19.
[19] Zhang K, Jiao L, Zhao X, et al. An instantaneous approach for determining the infrared emissivity of swine surface and the influencing factors[J]. Journal of Thermal Biology, 2016, 57: 78-83.
[20] Soerensen D D, Clausen S, Mercer J B, et al. Determining the emissivity of pig skin for accurate infrared thermography[J]. Computers and Electronics in Agriculture, 2014, 109: 52-58.
[21] 贾伟宽,赵德安,阮承治,等. 苹果采摘机器人夜间图像降噪算法[J]. 农业工程学报,2015,31(10):219-226.
Jia Weikuan, Zhao Dean, Ruan Chengzhi, et al. De-noising algorithm of night vision image for apple harvesting robot[J]. Transactions of the Chinese Society of Agricultural Engineering (Transactions of the CSAE), 2015, 31(10): 219-226. (in Chinese with English abstract)
[22] 王海超,王春光,宗哲英,等. 基于噪声类型及强度估计的狭叶锦鸡儿叶切片图像盲去噪[J]. 农业工程学报,2017,33(10):229-238.
Wang Haichao, Wang Chunguang, Zong Zheying, et al. Blind image denoising of microscopic slices image of Caraganastenophylla Pojark based on noise type and intensity estimation[J]. Transactions of the Chinese Society of Agricultural Engineering (Transactions of the CSAE), 2017, 33(10): 229-238. (in Chinese with English abstract)
[23] 廖建尚,王立国,郝思媛. 基于双边滤波和空间邻域信息的高光谱图像分类方法[J]. 农业机械学报,2017,48(8):140-146,211.
Liao Jianshang, Wang Liguo, Hao Siyuan. Hyperspectral image classification method combined with bilateral filtering and pixel neighborhood information[J]. Transactions of the Chinese Society for Agricultural Machinery, 2017, 48(8): 140-146, 211.(in Chinese with English abstract)
[24] 钟宝江,陆志芳,季家欢. 图像插值技术综述[J]. 数据采集与处理,2016,31(6):1083-1096.
Zhong Baojiang, Lu Zhifang, Ji Jiahuan. Review on image interpolation techniques[J]. Journal of Data Acquisition and Processing, 2016, 31(6): 1083-1096. (in Chinese with English abstract)
[25] Keys R G. Cubic convolution interpolation for digital image processing[J]. IEEE Transactions on Acoustics Speech and Signal Processing, 1981, 29(6): 1153-1160.
[26] 张玉存,张喜英,付献斌,等. 基于小波与双三次插值的高温锻件红外图像增强方法[J]. 中国机械工程,2017,28(17):2095—2099.
Zhang Yucun, Zhang Xiying, Fu Xianbin, et al. Infrared image enhancement algorithm for hot forgings based on wavelet transform and bicubic interpolation[J]. China Mechanical Engineering, 2017, 28(17): 2095-2099. (in Chinese with English abstract)
[27] 王丽杰,杨羽翼,代敏,等. 基于直方图分层映射的近红外光谱预处理算法[J]. 激光与光电子学进展,2017,54(9):393-401.
Wang Lijie, Yang Yuyi, Dai Min, et al. Near infrared spectral pre-processing algorithm based on histogram layering mapping[J]. Laser & Optoelectronics Progress, 2017, 54(9): 393-401. (in Chinese with English abstract)
[28] 刘姗姗,白美健,许迪,等. 畦田灌溉模拟中田面微地形空间分布插值方法改进[J]. 农业工程学报,2015,31(17):108-114.
Liu Shanshan, Bai Meijian, Xu Di, et al. Improvement of interpolation methods for surface micro-topography spatial distribution in border irrigation simulation[J]. Transactions of the Chinese Society of Agricultural Engineering (Transactions of the CSAE), 2015, 31(17): 108-114. (in Chinese with English abstract)
[29] 黄小乔,石俊生,杨健,等. 基于色差的均方误差与峰值信噪比评价彩色图像质量研究[J]. 光子学报,2007,36(S1):295-298.
Huang Xiaoqiao, Shi Junsheng, Yang Jian, et al. Study on color image quality evaluation by MSE and PSNR based on color difference[J]. Acta Photonica Sinica, 2007, 36(S1): 295-298. (in Chinese with English abstract)
[30] 肖祥元,景文博,赵海丽. 基于峰值信噪比改进的图像增强算法[J]. 长春理工大学学报:自然科学版,2017,40(4):83-86,92.
Xiao Xiangyuan, Jing Wenbo, Zhao Haili. An improved image enhancement algorithm based on the peak-signal to noise ratio[J]. Journal of Changchun University of Science and Technology: Natural Science Edition, 2017, 40(4): 83-86, 92. (in Chinese with English abstract)
Effect of hair on thermometry of skin by infrared thermography and noise reduction method for live pigs
Jia Guifeng1,2, Meng Junyu1, Wu Dun1, Wang Denghui1, Gao Yun1,2, Feng Yaoze1,2※
(1.,,430070,; 2.,,430070,)
The temperature distribution of pig skin is an important indicator to characterize its physiological state and disease. However, due to the surface hair coat, the skin temperature accuracy which detected by infrared thermography (IRT) is affected and its ability to diagnosis of fever and disease is reduced. The purpose of this paper is to explore the influence patterns of the coat on the skin temperature distribution and propose the thermal image processing method to eliminate the influence of the coat on temperature accuracy. The animals for experimental data were 12 sows in empty pregnant period with the average ambient temperature of 27.4 ℃ and humidity in the piggery of 80.3% respectively. The body surface temperature was measured by hand-held infrared thermal imager (Fluke, Ti 300) with a resolution of 240 pixels×180 pixels and sensitivity of 50 mK. And it also carried a laser distance measuring sensor with a resolution of 0.01 m to measure the distance between the measured object and the thermal imager. The statistics of the temperature distribution detected by IRT from the region of interest (ROI) under normal coat (NC) was compared to that under shed coat (SC) state. The statistical data indicated that the hair coat produced a large number of “canyon”-like low temperature noise in temperature distribution in NC state, which reduced the minimum temperature and average temperature of the ROI, but had no significant effect on the maximum temperature with diagnostic ability. According to the noise distribution characteristics and the influence pattern, an image noise filtering algorithm named the grid maximum value bicubic interpolation filter (GMBI) was proposed. The GMBI algorithm consisted of three steps including image mesh segmentation, filtering with maximum value and image bicubic interpolation. The key problem of GMBI was how to select the appropriate neighborhood size to ensure that each block contained at least one skin temperature value and the resolution was as high as possible. In this study, mathematical statistics was employed and it was found out that the optimal neighborhood size was 4.25 mm. In order to evaluate the validity of the algorithm quantitatively, the mean square error (MSE), peak signal-to-noise ratio (PSNR) and the difference of maximum, minimum and mean between the processed images by GMBI and the SC thermal images were calculated. The experimental data showed that the differences of minimum and average were greatly reduced from the original 1.59 and 0.47 to 0.13 and 0.07 ℃ (<0.01), which both were within the maximum allowable error range(±0.3 ℃) for disease diagnosis. Moreover, the MSE decreased from 0.38 to 0.05 (<0.01), while PSNR increased from 45.14 dB to 53.66 dB. In conclusion, the GMBI purposed in this study can filter the majority of noise caused by hair in temperature distribution and significantly improve skin temperature detection accuracy.
infrared imaging; temperature distribution; filter; pig; image interpolation; algorithms
贾桂锋,蒙俊宇,武 墩,王登辉,高 云,冯耀泽. 被毛对热成像检测生猪体表温度精度的影响及噪声滤除方法[J]. 农业工程学报,2019,35(4):162-167. doi:10.11975/j.issn.1002-6819.2019.04.020 http://www.tcsae.org
Jia Guifeng, Meng Junyu, Wu Dun, Wang Denghui, Gao Yun, Feng Yaoze. Effect of hair on thermometry of skin by infrared thermography and noise reduction method for live pigs[J]. Transactions of the Chinese Society of Agricultural Engineering (Transactions of the CSAE), 2019, 35(4): 162-167. (in Chinese with English abstract) doi:10.11975/j.issn.1002-6819.2019.04.020 http://www.tcsae.org
2018-10-12
2018-12-31
湖北省自然科学基金(2018CFB099);中央高校基本科研业务专项基金(2662016QD002);国家级大学生创新创业训练计划(201810504076)
贾桂锋,博士,讲师,主要从事生猪智能化检测技术与装备。 Email:guifeng@mail.hzau.edu.cn
冯耀泽,博士,副教授,主要从事智能化检测与控制技术。 Email:yaoze.feng@mail.hzau.edu.cn
10.11975/j.issn.1002-6819.2019.04.020
S818.2
A
1002-6819(2019)-04-0162-06
猜你喜欢
农业工程学报(2022年7期)2022-07-09
四川蚕业(2022年1期)2022-06-06
逻辑学研究(2021年3期)2021-09-29
语数外学习·高中版中旬(2021年12期)2021-03-09
健康大视野(2019年9期)2019-05-13
中国生殖健康(2019年11期)2019-01-07
计算机应用与软件(2018年12期)2018-12-13
青少年科技博览(中学版)(2017年5期)2018-02-28
中国科技纵横(2016年23期)2017-04-06
小火炬·阅读作文(2014年5期)2015-04-07
