
Leveraging Logical Anchor into Topology Optimization for Indoor Wireless Fingerprinting
2019-02-28 07:08LinWangHuixiangLiuWenyuanLiuNanJingAhmadAdnanandChenshuWu
Computers Materials&Continua 2019年2期
Lin Wang , Huixiang Liu Wenyuan Liu , Nan Jing Ahmad Adnan and Chenshu Wu
Abstract: The indoor subarea localization has wide application space in dynamic hot zone identification, indoor layout optimization, store dynamic pricing and crowd flow trend prediction. The ubiquitous mobile devices provide the opportunity for wireless fingerprinting-based indoor localization services. However, there are two short board where the existing methods have been criticized. One is that a tagging approach requires a large number of professional surveys for wireless fingerprint construction, which weakens the scalability of the methods. The other is that the crowdsourcing-based methods encounter the cold boot problem in the system initial stage. To address these issues, the paper proposes a topology optimization approach leveraging the dynamic logical anchor selection into a subarea localization system. First of all, a new annular-based radio map construction strategy with the feedback selection of logic anchor is designed to release the pressure of site survey. The implementation of this strategy harnesses the characteristics of the indoor building structure and inter subarea overlapping recognition, without the topology and distribution of physical anchor (e.g.,access points or POIs). Secondly, exploiting the probabilistic support vector machine algorithm, the target is localized in the corresponding subarea in a real-time pattern.Furthermore, the localization error is calibrated with an error recognition algorithm.Finally, massive experiments are implemented on a prototype system. The results show that the proposed method can decrease the overhead of the system initialization and achieve higher localization accuracy compared with the existing approaches.
Keywords: Received signal strength, fingerprint, logic anchor, subarea localization.
1 Introduction
In recent years, the location-based services (LBSs) have been extended from the Global Positioning system (GPS) dependent outdoor localization technology to the indoor localization technology since the widespread popularity of wireless networks and smart devices. The most popular localization technology is GPS. Unfortunately, the GPS signals are attenuated and blocked from traveling through the building walls, which is not suitable for indoor localization [El-Rabbany (2006)]. As an alternative, radio frequency(RF) signals are widely used to position estimation, including Wi-Fi, ZigBee and RFID.The RF-based localization methods can be divided into two families: range-based matter[Wu, Yang, Zhou et al. (2017)] and range-free matter [Xiong, Sundaresan and Jamieson(2015); Pang and Trujillo (2013); Hou, Xue, Chen et al. (2015); He, Hu and Chan (2015);Wang, Zhou, Liu et al. (2015)]. The former leverages the receive signal strength (RSS)[Liu, Yang, Sidhom et al. (2014)] to measure the time of arrival (TOA) [He, Hu and Chan(2015)], the time difference of arrival (TDOA) [Wu, Yang and Liu (2015)], and the angle of arrival (AOA) [Wang, Sen, Elgohary et al. (2012)]. To improve the measurement accuracy, it is necessary to design special modulation methods or increase the number of antennas. The latter uses the correspondence between the RF fingerprint and the position to establish the radio map, and then to match the ongoing fingerprint. However, the device diversity and the dynamic nature of indoor environment lead to the performance of the RF fingerprint localization system greatly compromised.
Researches on indoor positioning technology are mainly divided into two directions. On the one hand, both academia and industry are very concerned about the accuracy of indoor localization. On the other hand, many indoor location services are more interested in subarea and location semantics. In this paper, we try to answer the question, can we perform a lightweight and low-cost subarea localization method that overcomes the constraints of device diversity and environmental dynamics.
In the past decade, massive indoor subarea localization methods based on fingerprint were emerging. However, the wireless fingerprint has a time-varying difference in the same position, which raises the great challenge to the location estimate using the wireless fingerprint. The subarea localization problem is often mapped to fingerprint clustering problems. Many supervised and unsupervised clustering algorithms have been used to address this issue, including nearest neighbor (NN), k-nearest neighbor (KNN), support vector machine (SVM), artificial neural network (ANN), deep belief network (DBN), and so on [Sen, Lee, Kim et al. (2013)]. Wu et al. [Wu, Yang, Liu et al. (2013)] propose a novel indoor subarea localization algorithm that combines both the fingerprint-based method and the lateration method, and then uses the KNN algorithm to realize subarea localization. Although the method improves the accuracy of localization system, it is necessary to ensure the robustness and accuracy of the fitting function in the process of localization, which requires the increase the number of fingerprint samples. A graph-based method [He, Tan and Chan (2016)] is proposed for indoor subarea localization with zero-configuration, which can be directly employed without offline manually constructing fingerprint map or pre-installing additional infrastructure, and then uses the Bayesian-based approach to estimate the target subarea in online, which reduce the human cost and can automatically construct the fingerprint database. Utilizing the fingerprint map information to calculate the similarity and probability of each subarea to achieve localization, the approach presented in Wang et al. [Wang, Zhou, Liu et al.(2015)] can increase localization accuracy. In short, these fingerprint-based localization methods achieve higher localization accuracy depending on the density of reference points and physical anchors, the artificial cost and deployment cost of off-line fingerprint library construction are completely ignored during the site survey (a.k.a. calibration or war-driving) [Chen and Wang (2015)].
In this paper, we present a lightweight fingerprint-based method for the inexpensive and scalable indoor subarea localization. This method only needs in advance to set up a fixed logic anchor according to each subarea spatial structure and environment settings. By defining the logic anchor, the more convenient radio map construct is designed without the prior knowledge of the location of each AP. Not only can it reduce implementation costs of localization system, but can harness the deployed APs in indoor environments. In offline phase, we construct the radio map of all-region. First of all, the whole indoor environment is divided into several subareas. Furthermore, the corresponding annular fingerprinting scheme is used to construct the fingerprint database and train the localization model in each subarea. The annular fingerprinting is a tradeoff between the accuracy and the cost in site survey, which allows for lightweight implementation of radio map construction and model training. In online phase, we use the cosine similarity to calibrate the RSSI on devices, and then leverage the probabilistic SVM algorithm to estimate the target subarea. Finally, the localization error of the target is obtained by the location error recognition algorithm, and then the ID of a target area is pushed to a requested device.
Our contributions can be summarized as follows:
· We propose a logic anchor-based annular topology to refine fast construction of the radio map, and utilize the cosine similarity to calibrate the fingerprints, which improves the scalability of actual deployment and reduces the cost of site survey.
· We adopt the probabilistic SVM algorithm to realize a subarea that improves the localization accuracy and the convergence of fingerprint matching algorithm.
· We implement a prototype system on the mobile device and conduct massive experiments in a typical indoor multiple subarea environment using commodity devices for analysis and evaluate the proposed method. The experiment results indicate that our method can achieve better performance.
The rest of the paper is organized as follows. Section 2 presents the design of our localization system. The lightweight radio map construction is detailed in Section 3,followed by the online localization in Section 4. We evaluate the performance of the proposed method in Section 5 and conclude the paper in Section 6.
2 System overview
In this paper, our indoor subarea localization method can be widely used in the hotspot level indoor localization technology based on RF fingerprint, the system architecture is shown in Fig. 1. The proposed method includes two stages: site survey and localization. In the site survey phase, first of all, we need to conduct site exploration to see indoor environment and space structure, and the indoor region is divided into multiple subareas reasonably that according to the physical space structure and environment, logic anchors are selection in feedback pattern in subareas. The fingerprint of each RP is assigned with an area ID corroding to the subarea, and the fingerprint information (Area ID, RP coordinates,RSS from different APs) is saved in the fingerprint database; finally, we train classification models and store their model parameters in the fingerprint database to online localization.
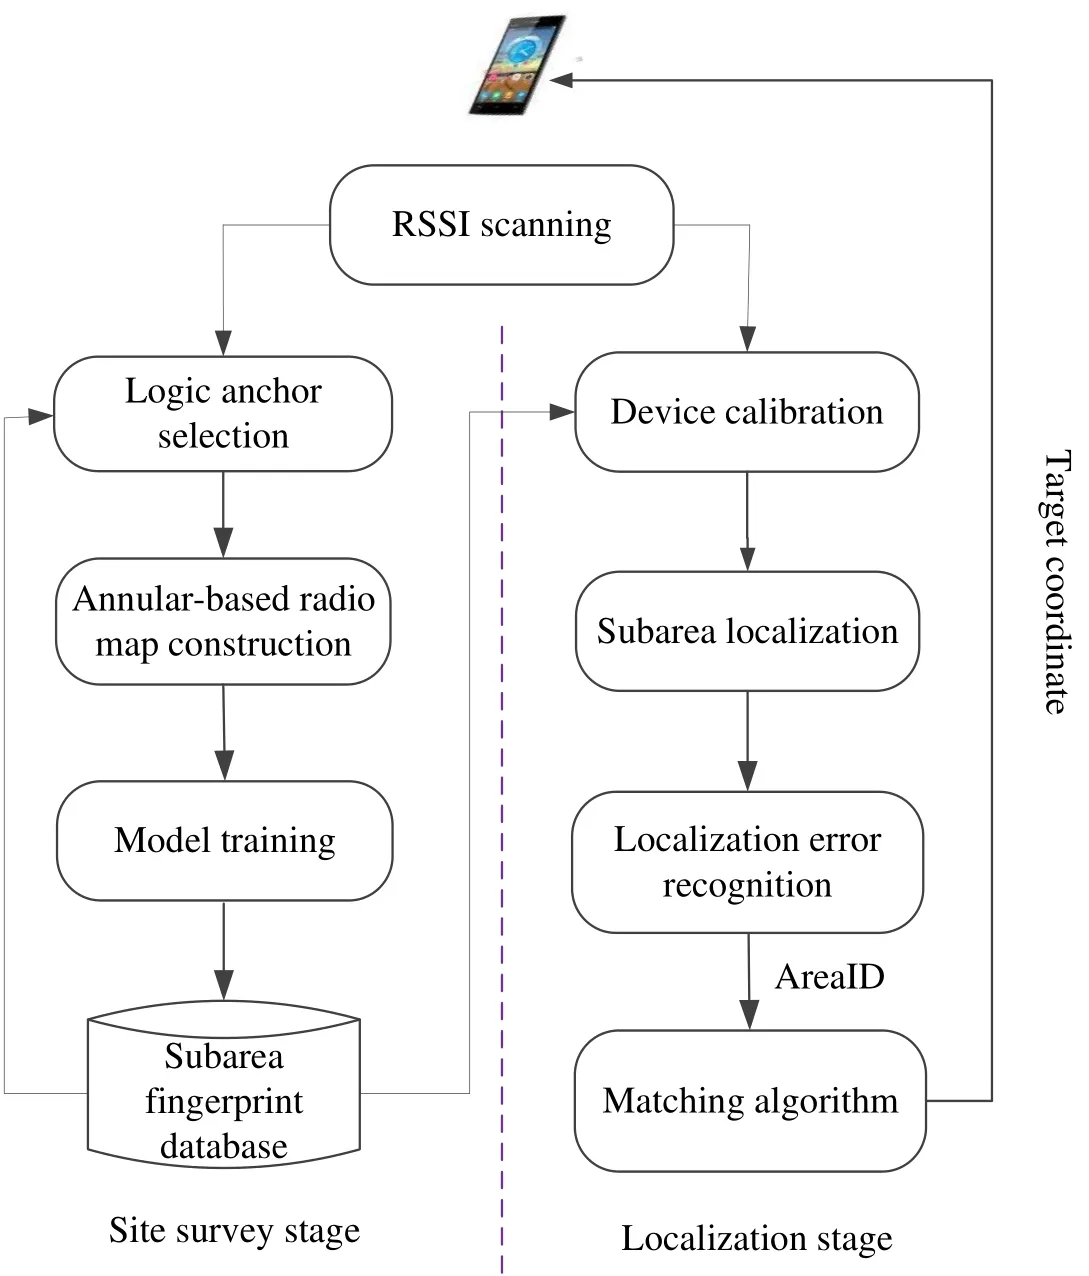
Figure 1: System architecture
In the online phase, the localization process can be divided into the following four steps.Firstly, we can access to real-time RSS of the current position by the user’s smartphone scanning. Secondly, determine whether the current users’ smartphones model for fingerprint collected in the model, if the next step, or for equipment, fingerprint calibration to improve the localization accuracy. Thirdly, the SVM algorithm is used to predict the subarea of the target location. Finally, the subarea localization result is determined and analyzed. If the area localization precision is highly uncertain, the system rejects this signal to obtain by location error recognition model, otherwise returns the area ID of target location to smartphones in fine-grained position estimation.
3 Radio map construction
3.1 Logic anchor selection
In this section, we briefly introduce the preliminaries of RSSI fingerprints for subarea classification. Fingerprints used for area classification can be the same as those provided for traditional fingerprinting systems, but most of the fingerprint localization systems use the grid-based fingerprint sampling strategy, this method holds big human cost and relatively weak real-time performance. In this paper, we adopt the annular fingerprint sampling strategy that can combine with ranging reduce the overhead of radio map construction, also can improve accuracy. In site survey stage, the fingerprints are assigned with an area ID corroding to the subarea, the ID of each subarea is given in the system initialization.
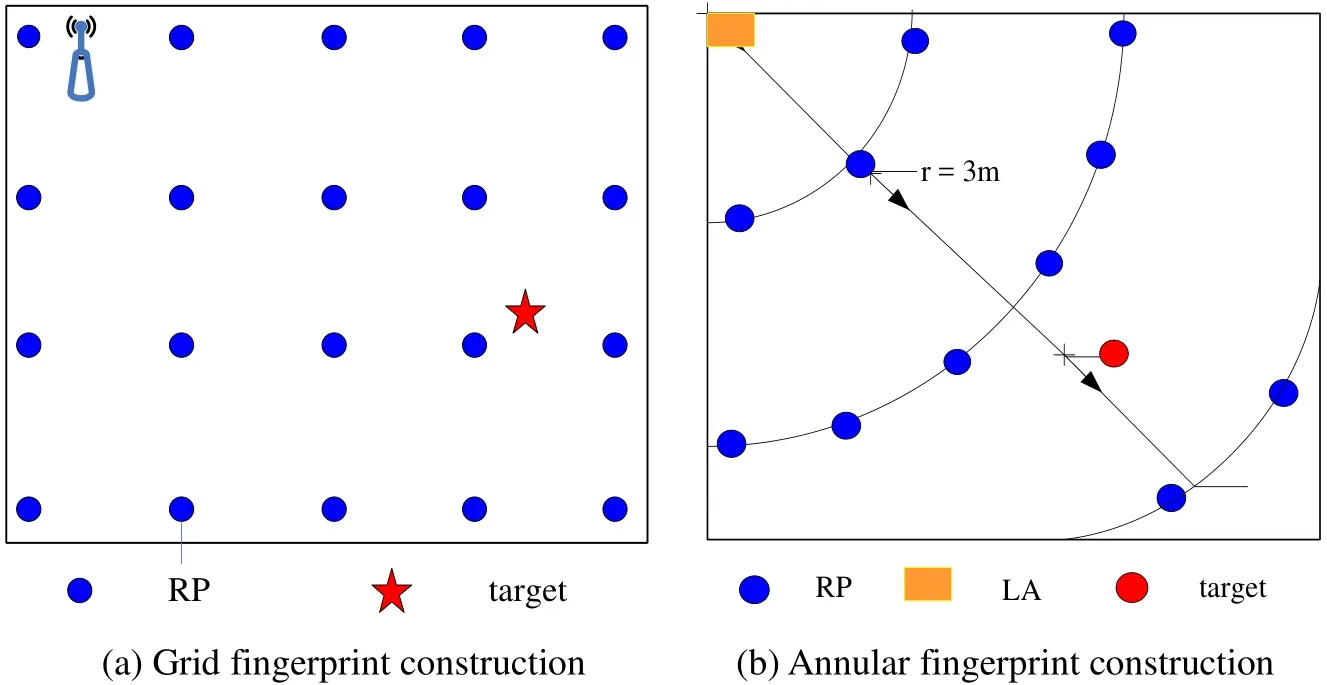
Figure 2: Radio fingerprint map construction
Let N be the number of RPs, and M be the number of APs. Let us consider a link from a predefined RP to a single AP. Recall thatis, RSSI from AP m to RP n, the mean RSSIat RP from AP m is given by


Let C be the set of subareas to be classified, and |C| is its cardinality. For each, we have a corresponding area ID An given the target measured fingerprint T from M APs, T can be denoted as:

3.2 Radio map generation
Existing fingerprint-based indoor localization methods usually divide the indoor environments into the equal grid width, as shown in Fig. 2(a). There are two problems on the grid-based methods. On the one hand, for each grid in artificial reconnaissance stage need to build the corresponding fingerprint data and deposit in the fingerprint database, in a relatively larger interior space, the sampling point number is more, human consumption is bigger, and deployment is more difficult. On the other hand, in the online localization stage, it needs to compare the data of current collecting with the data of fingerprint database, matching the degree of the corresponding peak position as the target position,with high time complexity and furthermore weakens the real-time performance of localization system.
We adopt a new type of fingerprint sampling scheme, namely the annular-based fingerprinting scheme [Liu, Liu, Wen et al. (2018)], as shown in Fig. 2(b). At LA (logic anchor) location, LA as the center of the annular, r is set to the radius of annular so that the entire indoor region divided into any annular. With the annular radius successive increase r and the sampling points on each annular, the distance between the sampling points is set to. Although the entire indoor environment is divided into multiple loops by combining range reduced the fingerprint matching more times, the scheme can lead to lower precision. The reason is that the number of sampling points on each loop is not enough. Therefore, the fingerprint sampling scheme proposed in this paper can not only reduces the cost of fingerprint construction, but also improves the localization accuracy.
4 Online localization
4.1 Fingerprint calibration
Due to the difference in the wireless network interface, the same signal received at the same location using different types of smartphones may have different measurements[Hossain, Jin, Soh et al. (2013)]. Fig. 3 shows the similarity of the signal trend between signal amplitude shifts of two smartphones. Taking advantage of the similarity, this paper puts forward an effective fingerprint calibration algorithm to adapt to device diversity. To reduce the manual cost, we consider the effectiveness and extensibility of online calibration. We need to calculate the correlation between the fingerprint of the target and each RP, and then utilize the RPs with the similar fingerprint to online fingerprint calibration. The cosine similarity between the fingerprint of the real-time target and each RP can be the between T andcan be denoted as:

After getting the signal amplitude shift, we can calibrate the fingerprint of RPs with the correlated which stored the fingerprint database.
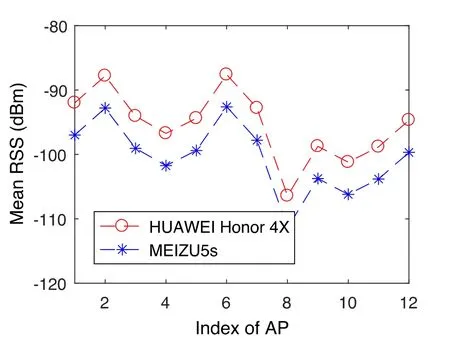
Figure 3: Signal similarity with device diversity
4.2 Subarea localization
In spacious and multi-area buildings, the fingerprint-based indoor localization technology usually conducts a wide range of location searches. Therefore, for complex locationbased services, specific subarea localization is particularly important. Regional mapping is designed to effectively reduce the impact of fine-grained localization. Currently, indoor subarea localization algorithms include k-nearest neighbor (KNN), artificial neural network (ANN), support vector machine (SVM), etc. [He, Tan and Chan (2016)]. KNN needs to compute the Euclidean distance between the target RSSI vector and all RPs fingerprint vectors, the calculation process is simple, but the localization accuracy is unacceptable. ANN utilizes the back propagation algorithm to train weights, in the stage of training need to be considered a hidden layer to avoid the error propagation, and data need to be marked for supervised learning, online calculation is fast, but the off-line training for a long time. SVM exploits the kernel functions to solve the randomness and incompleteness of RSS values with high computational complexity.
Comprehensive consideration, because the number of fingerprint sampling was reduced by the annular fingerprint sampling scheme proposed in this paper, and the complex pretreatment of RSSI was done at the construction stage of radio map, the computational complexity can reduce accordingly. Therefore, we adopt the SVM classification algorithm [Chang and Lin (2011)] to realize sub-area localization.
The basic idea of the subarea localization is that each subarea is viewed as a cluster. For each online target query, the system finds the probability that the target is in this area against others. In other words, there areclusters inareas. Fromprobability t subarea the corresponding subarea with the maximum probability, the localization system returns the area ID to the user’s smartphone.
In the indoor subarea localization, we need to do data normalization. The advantage of simple scaling of the data is that the property of the small value interval is overruled by the property of the large value interval and avoiding the numerical complexity in the calculation. Due to the data set in indoor localization are larger, the normalization of data set can reduce computational complexity. Furthermore, we select the kernel function in indoor scenarios, the RF signal is reduced in the form of exponential decay, the mapping of data is similar to the radial basis function (RBF). Therefore, the RBF is used in the implementation, which can be presented as the formula 6. Next, select the optimal parameter c and g. c is the punishment factor, g is the gamma function setting in the kernel function (the default is, k is the number of eigenvalues). Finally, we train the area localization model and evaluate the estimation precision.

4.3 Error position identification
The RSSI vectors of different subareas may be similar and lead to incorrect localization due to the measurement of noise or loss of AP signals (AP has no power or malfunction).To further improve the localization accuracy, we adopt a location error recognition algorithm. If the target localization error, the system returns this target signal, which can prevent the error classification and improve the user experience. RT indicates the number of target position signals returned, TT indicates the number of target position tests, and the return rate RR is calculated using formula 7.

If the target position probability in each subarea (all probability) satisfies one of the following two conditions, the target signal is returned to reposition. (1) All probability is less than the preset threshold. (2) The first two probabilities of descending order of all probability are less than, whereis the maximum probability, andis the grand probability. To determine the parameter, in actual deployment, we collected some test data to find the optimal parameters to reduce the return rate.
5 Evaluation
5.1 Experimental setup
In this paper, the experimental software platform realizes offline and online RSSI data collection based on Android self-developed mobile application software. The hardware platform uses three different models of mobile phones, namely Huawei honor 4X,Huawei honor 6, MEIZU 5 s. The experimental environment is the fourth floor in an office building, the area of entire indoor environment is about 92.4 m×34.8 m.
We divide the experimental environment into nine subareas and assign an area ID to each subarea (A1, A2, ..., A9). Moreover, a logic anchor is set in each subarea. Finally, the fingerprint sampling scheme is secleted according to the spatial size and environment of each subarea including 130 RPs, as shown in Fig. 4. The grid fingerprint sampling scheme for 1.5 m width of grid sampling, in the whole experiment environment need to set up 310 reference points, so this paper puts forward the circular fingerprint sampling scheme can greatly reduce the human cost. It does not rule out the noise in the Wi-Fi fingerprint database, Fig. 5 shows the cumulative probability of signal noise. We can observe that the number of AP detected and the signal noise can lead to different subarea classification results. The main reasons can be summarized as two sides. On the one hand,many people who move back and forth in the corridor, there are the larger noise in our experimental environment. On the other hand, the wall partition in different subareas is various, the number of AP detected in each RP is different.
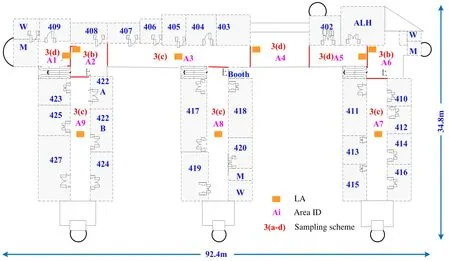
Figure 4: An floor plan of localization region
5.2 Performance evaluation
In this section, we evaluate the indoor subarea localization based on the following three performance metrics.
Localization accuracy characterizes the influence of indoor subarea localization accuracy under the selection of r value, different devices and the number of APs.
Return rate is used to describe the error target position return rate with different classification algorithms, and the optimal selection of different parameters for each algorithm.
Different classification algorithm are compared for the influence of subarea localization accuracy including KNN, ANN adopted by He et al. [He, Tan and Chan (2016)] with SVM in our method.
Influence of r value.Collecting the fingerprint of each subarea, r is set to 2 m, 3 m, 4 m in turn. The influence with the r value selection on localization accuracy is significant, as shown in Fig. 6. It can be seen that, when r is 2 m, the distance of RPs is about 1 m, the localization accuracy of two classification algorithms is more than 90%. However, if r is set to 3 m, the distance of RPs for 1.5 m, KNN can achieve 81% of the localization accuracy, as well as, the SVM can reach 86.6%. When r is set to 4m, the distance of RPs for 2 m, the accuracy is below 80%. It demonstrates the r value selection of the impact on the localization accuracy. In other words, the r value is smaller, the higher localization accuracy and the more the corresponding to the number of sampling points. However, the negative aspect is that the more the number of fingerprint matching, which leads to extent weaken the real-time performance of the localization system. Therefore, we need a tradeoff on the selection of r, which is set to 3 m in this paper.
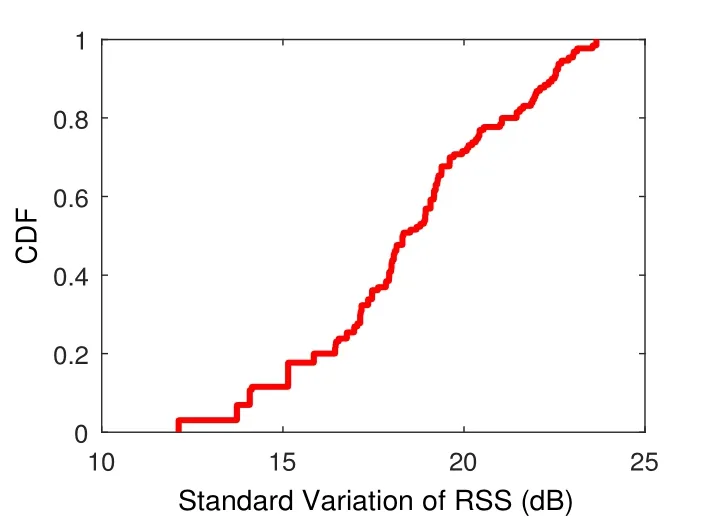
Figure 5: CDF of fingerprint signal noise
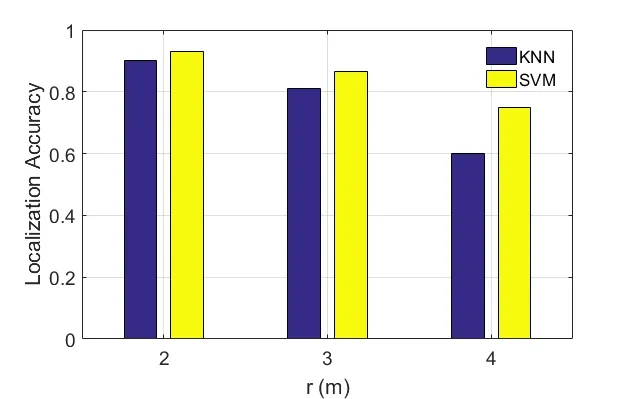
Figure 6: Influence of r
Target location Error return rate.We careful consider the optimal parameters of the KNN, SVM, and ANN in the experiment. In KNN, if the top K nearest neighbors are from different subareas, the system returns this target RSSI vector. In SVM, we use the function SVM to complete the choice of c and g. Since the output probability in the training of area localization model, the parameter b is set to 1. In location error recognition algorithm, λ and θ is set to 0.24 and 0.02 respectively. In ANN, study rate is set to 0.01, the maximum number of iterations is set to 500, according to the intermediate results cycle and the training error are set to 500 and 0.01, respectively.
Fig. 7 shows the wrong target position return rate of different classification algorithms in the laboratory environment. In this experiment, we use the smartphone model is HUAWEI honor 4x. Can be seen from the Fig. 7, KNN and SVM have lower return rate,and ANN has a higher return rate. Because there is a lot of wall in the laboratory building,the neural network is sensitive to noise data in the training process.
Influence of different devices.Due to the same signal may have different measurements in different types of smartphone, making the on-line device calibration is particularly important. Fig. 8 indicates the subarea localization accuracy of different models of smartphone in the device calibration before and after. It can be seen from the Fig. 8 that the device can obtain higher localization accuracy after calibration in two devices. The main reason is that the online calibration successfully adjusts the RSSI values of different equipment and improves the actual scalability deployment. Online device calibration not only improves the location accuracy, but also ameliorates the extensibility of actual deployment.
Influence of different classification algorithms.KNN in offline training stage needs to calculate Euclidean distance between target position vector and fingerprint vector of each RPs in the fingerprint database, and then find the K nearest neighbors, K nearest neighbors in the most times is the target area. ANN in the process of training data, set up two hidden layers, each of the input layer neurons corresponds to an AP, and each of the output layer neurons corresponds to a specific subarea, finally output layer return to localization accuracy in the test phase.
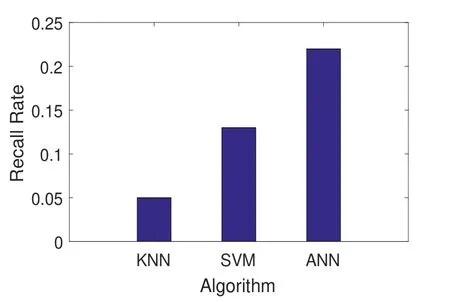
Figure 7: Error of target location
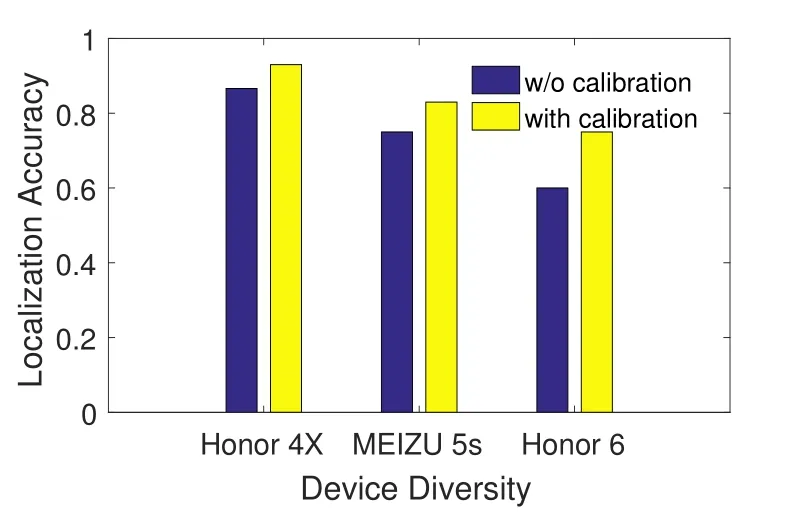
Figure 8: Device diversity
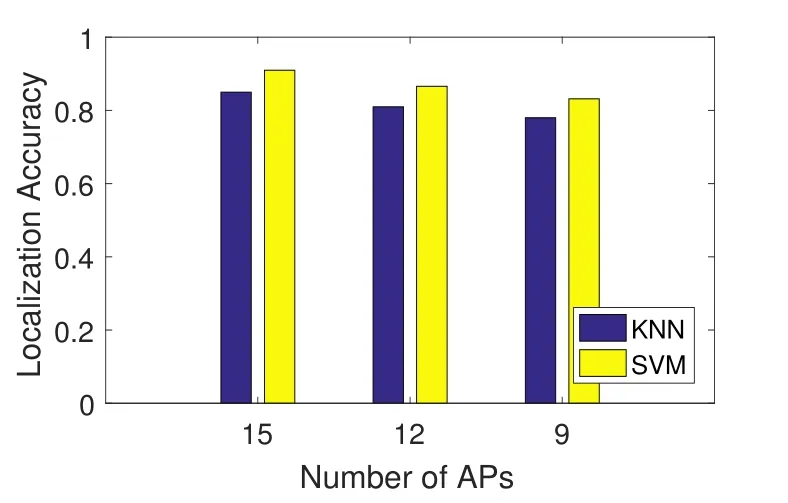
Figure 9: Number of Aps
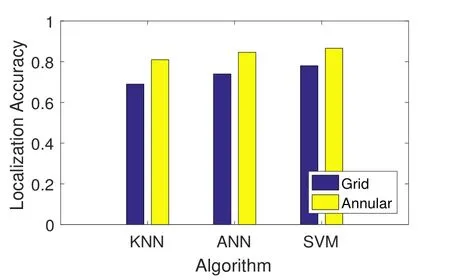
Figure 10: Different sampling scheme
Fig. 10 summarizes the influence of different classification algorithms using two kinds of fingerprint sampling scheme on the localization accuracy. Each method using annular fingerprint samples can obtain the higher localization accuracy than using grid fingerprint sampling scheme. The reason is that the RSSI between adjacent RPs is similar in the grid fingerprint sampling scheme. However, there are some difference between adjacent RPs in the annular fingerprint sampling scheme, which profits to effectively distinguish each RP. Furthermore, the SVM has more accurate than the other two algorithms because it can distinguish the RSSI vector in an experimental environment. ANN is sensitive to noise data, which leads to more accurate than KNN. We note that the fingerprints of each RPs in the annular fingerprint sampling scheme is closely relative to the change of time.The linear method increases the number of the fingerprints in the actual operation, which can obtain higher localization accuracy.
6 Conclusion
The proposed subarea localization method is an independent indoor localization system,which can also be used as a middleware to compress the search space in the process of fingerprint matching in the existing indoor localization system and enhance the position semantics. In this paper, we define the logic anchor to construct the annular delineation and the fingerprint collection in the indoor subarea. Moreover, the self-feedback mechanism is designed to eliminate the fingerprint drift caused by the device diversity. In future work, we will exploit computational geometry to receive the logical subarea, and construct a mapping method from the logical subarea to the related physical region.
Acknowledgement:This work is supported in part by the National Natural Science Foundation of China under grant No. 61772453, 61672448, 61303233, the Hebei Province Natural Science Fund Program under grant No. F2018203444, F2016203176,the Technology Foundation for Selected Overseas Chinese of Hebei Province under grant No. CL201625, and the Youth Foundation in Basic Research of YSU under grant No.16LGA009.
 Computers Materials&Continua2019年2期
- Computers Materials&Continua的其它文章
- Design of Feedback Shift Register of Against Power Analysis Attack
- An Improved Unsupervised Image Segmentation Method Based on Multi-Objective Particle Swarm Optimization Clustering Algorithm
- Forecasting Model Based on Information-Granulated GA-SVR and ARIMA for Producer Price Index
- Detecting Iris Liveness with Batch Normalized Convolutional Neural Network
- Social-Aware Based Secure Relay Selection in Relay-Assisted D2D Communications
- A Lightweight Three-Factor User Authentication Protocol for the Information Perception of IoT