Spatial Quantitative Analysis of Garlic Price Data Based on ArcGIS Technology
GuojingWu,ChaoZhang,,PingzengLiu,WanmingRen,YongZheng,FengGuo,XiaoweiChenandRussellHiggs
Abstract: In order to solve the hidden regional relationship among garlic prices, this paper carries out spatial quantitative analysis of garlic price data based on ArcGIS technology. The specific analysis process is to collect prices of garlic market from 2015 to 2017 in different regions of Shandong Province, using the Moran's Index to obtain monthly Moran indicators are positive, so as to analyze the overall positive relationship between garlic prices; then using the geostatistical analysis tool in ArcGIS to draw a spatial distribution Grid diagram, it was found that the price of garlic has a significant geographical agglomeration phenomenon and showed a multi-center distribution trend.The results showed that the agglomeration centers are Jining, Dongying, Qingdao, and Yantai. At the end of the article, according to the research results, constructive suggestions were made for the regulation of garlic price. Using Moran’s Index and geostatistical analysis tools to analyze the data of garlic price, which made up for the lack of position correlation in the traditional analysis methods and more intuitively and effectively reflected the trend of garlic price from low to high from west to east in Shandong Province and showed a pattern of circular distribution.
Keywords: Garlic price, data analysis, Moran’s Index, Kriging interpolation, spatial distribution.
1 Introduction
The fluctuation of agricultural product prices will cause price fluctuations of other related products in different degrees, which will affect the operation of the market economy. In the recent fluctuations of agricultural product prices, not only the prices of bulk agricultural products have overall fluctuations, but also the prices of small agricultural products such as garlic, mung beans, ginger and so on, have also fluctuated significantly,especially the fluctuation of garlic price is the most noticeable [Wang and Wei (2016)].The fluctuation of garlic price is affected by many factors such as planting area, planting cost, and market demand. There are also certain differences in garlic price between different regions.
Influenced by many factors, there are certain differences in garlic prices in different regions. Taking 5 market prices randomly selected in 2017 as an example, the comparative analysis found that the garlic price is basically the same in the overall trend,but within a certain period of price changes, the price differences between different regions are also obvious. With the convenience of transportation, the links between markets have become more and more close. As a small agricultural product, the price of garlic fluctuates frequently. What is the relationship between the regions? Making an indepth analysis of the garlic price data and digging out the relationships among the regions implicated in it have important theoretical and practical significance for price supervision and regulation of the garlic market. A lot of valuable results have been obtained by scholars on the study of garlic price. Most scholars believe that the change of supply and demand is the basic reason for the fluctuation of garlic price [Li (2011); Zhao, Jing and Yang (2013); Tu and Lan (2013); Xu (2008)].
By analyzing the trajectory of the garlic market in China for many years and the detailed analysis of the price of garlic in 2012, Chen [Chen (2012)] found that the garlic industry has not been out of the cobweb curse. The price of garlic skyrocketed, which stimulated garlic farmers to blindly expand the planting area. The price of garlic plummeted, and garlic farmers reduced planting area panic. The blind expansion or reduction of the planting area has become the main reason for the sharp rise and fall in garlic price. Yao et al. [Yao and Zhou (2012)] using garlic wholesale price as a sample based on the ARCH model, studied the fluctuation of garlic price and concluded that the fluctuation of price garlic is persistent, but it does not have high risk and high return, nor does it have low risk and low return. Qin [Qin (2013)] analyzed the garlic price data from all aspects and based on ARCH model, and finally concluded that the fluctuation of price garlic has a certain periodicity, regularity, and clustering, and it also contains human factors of hype.Jiang et al. [Jiang and Cha (2016)] analyzed the price of garlic for 106 months and concluded that the abnormal fluctuation of domestic garlic price is a manifestation of market failure and raised the importance of government regulation. Shao [Shao (2011)]used the cobweb theorem proposed to explained the instability of prices of farm products such as garlic based on divergent cobweb model.
Price is usually an indicator that whether industrial development is stable. Some scholars have analyzed the relevant factors that affect the price fluctuation of agricultural products from the perspective of spatial linkage. With the support of GIS and VB.NET, Feng et al.[Feng and Zhang (2009)] use the spatial partition model based on the grey evaluation to evaluate the prices of agricultural products in different parts of China in the four seasons of spring, summer, autumn and winter. The regional differences and spatial distribution of agricultural products in the four seasons were analyzed. It is concluded that there are significant spatial gradients in the prices of agricultural products. Chai et al. [Chai and Wang (2009)] took the pork prices of all provinces in April 2008 as an example and used GIS to analyze the price data of agricultural products in spatial interpolation. The data obtained from the interpolation are clustered and the results are displayed on the map to visualize the regional characteristics of the price. Hu et al. [Hu and Zhao (2016)] used spatial correlation analysis to analyze the spatial characteristics of price fluctuations of agricultural products in China. It is found that the price of agricultural products has a significant agglomeration effect in space, and there are differences in the spatial correlation characteristics of agricultural products prices between regions. By setting up the econometric model, they studied the provincial panel data from 2002 to 2013, and analyzed the main influencing factors of the agricultural products price. Hu et al. [Hu and Qi (2013)] took apples, citrus, and bananas, for example, to measure the apparent spatial correlation of the prices of three types of fruit and analyzed the important factors of price formation and price space transmission by using Moran’s Index. Ma [Ma (2016)] used the spatial correlation analysis method of provincial panel data in the past ten years to study the trend of price fluctuations of agricultural product in China, and calculated Moran’s Index of production prices of provincial agricultural products to conclude the spatial distribution characteristics of prices, and through the spatial measurement model summed up the factors affecting the price of agricultural products. Huang et al. [Huang,Zhao and Peng (2016)] used GIS technology and spatial statistical analysis methods to analyze the garlic prices in wholesale markets in Beijing and neighboring provinces, and concluded that in the period of garlic price stability, the prices showed a global autocorrelation on the whole, but during the period of large fluctuations in price, there was no obvious correlation between garlic price, which provided relevant basis for stabilizing the market conditions.
The prices of garlic are numerous and varied and most scholars have neglected the research on spatial information of garlic prices. In view of the above, based on the big data platform of the garlic industry chain jointly established by Shandong Provincial Department of Agriculture and Shandong Agricultural University, this article uses geographic data and spatial statistical analysis methods through data analysis tools in ArcGIS to analyze the spatial correlation and spatial distribution pattern of garlic price from the perspective of space, and more clearly determines the relationship between garlic price in different regions, and makes a large number of garlic price data more widely and deeply applied. It will play a supporting role in the supervision and management of the government, and also provides corresponding theoretical support for the regulation of garlic price. Established on this basis, the big data platform of the garlic industry chain integrates with various theoretical analysis results and plays a good role in promoting the smooth operation of the garlic industry in Shandong Province.
2 Data and methods
2.1 Material
Shandong is the main producing area of garlic and it is the main trading area and trade distribution center of garlic in China. The transaction price of garlic in Jining Jinxiang is the wind vane of garlic price in Shandong Province, which represents the trend of garlic price in the whole country. However, the fluctuation of garlic price in Shandong province often exceeds the normal range, which has a great impact on the development of the garlic industry in China and can easily cause a chain effect [Li, Qin and Zhou (2017)]. In order to analyze the relationship between garlic price in different regions of Shandong Province and further explore the internal law of the distribution of garlic price between regions to prevent the price of garlic from rising and falling, this paper chooses the wholesale price of garlic market from 2015 to 2017 of Shandong Province as the research object, and due to the lack of garlic price data for individual months, January and February of 2015, March, May, and June of 2016, and August of 2017 were excluded from the study to ensure the authenticity of the data. The following research data of this paper all comes from garlic wholesale markets in Shandong Province.
2.2 Methods
This paper uses Moran’s Index to analyze the spatial distribution characteristics of garlic price. The Moran’s Index was used to test whether there was spatial autocorrelation between garlic price in different regions, and to test whether garlic price showed agglomeration characteristics. After determining the correlation between garlic prices, we use the geostatistical analysis module in ArcGIS to continue the next analysis, so that we can more directly analyze the distribution of garlic price. This paper selected the Kriging interpolation method under the geostatistical analysis module.
2.1.1 Cluster analysis: Moran’s Index
Spatial autocorrelation refers to the potential interdependence of some variables in the same distribution area. Spatial autocorrelation statistics are used to measure the basic nature of geographic data: The degree of interdependence between data in a certain location and the data in other locations. This dependency is usually called spatial dependence. Because of the influence of spatial interaction and spatial diffusion,geographic data may not be independent of each other, but they are related. For example,many markets, which separate from each other in space, are a collection, for example, the distance between the markets is close to the exchange and flow of goods, and the price and supply of the goods may be related in space, but no longer independent. In fact, the closer the market is, the closer and closer the commodity price will be. Statistically,correlation analysis can be used to detect the correlation between the two phenomena(Statistics). For example, the yield of rice is often related to its soil fertility. If the analysis statistic is the same attribute variable of different observation objects, it is called“autocorrelation”.
There are many applications in the discipline of geostatistics. Now there are many indexes available, but there are two main indexes, namely the Index of Moran and the C index of Geary. The ability of G coefficient to detect high value aggregation is stronger than low value aggregation. When there is a high and low value aggregation in the range of research, the G coefficient is affected by the size of the aggregation region. When the size of the high aggregation region and the low value aggregation region are equal, the G coefficient is often positive, indicating that the G coefficient is sensitive to the high value;the Moran’s Index is mainly affected by the size of the aggregated area. With the expansion of spatial aggregation, the Moran exponent will increase significantly [Zhang and Zhang (2007)]. The Moran’s Index can better reflect the expansion of the aggregation area. In this paper, the Moran index is used to analyze the spatial autocorrelation.
Moran’s Index-a comprehensive measure of spatial autocorrelation. The global Moran’s Index is called “Spatial Autocorrelation (Global Moran’s I)” in the ArcGIS toolset.Spatial autocorrelation tools measure spatial autocorrelation based on feature locations and feature values. Given a set of features and related attributes, the tool evaluates whether the expressed model is a clustering model, a discrete mode, or a random mode.The tool evaluates the significance of the index by calculating Moran’s Index value,Zscore, andPvalue.
Spatial autocorrelation statistics are a basic property used to measure geographic data:The degree of interdependence between data at one location and data at other locations.The calculation formula of the global Moran I index is:

In the above formula, xiis the value of the unit j, and xmis the average of the grid unit value; Wijis the coefficient, and n is the total number of the grid units. If j is one of four units that are directly adjacent to i, the coefficient Wijis 1, if the other units or units are no data (No Date), the coefficient Wijis 0, the Moran’s Index ranged from [-1, 1]. The significant Moran’s Index value indicates that the garlic price exhibited a positive spatial autocorrelation. The regions with high prices neighbor each other or the regions with high prices neighbor each other. On the contrary, it means that garlic prices show a negative spatial autocorrelation, that is, garlic prices are distributed. Moran’s Index value is close to 0, which means garlic price is distributed randomly [Mei and Xia (2008)].
2.1.2 Geostatistical analysis: spatial autocovariance best interpolation
With the rapid development of geographic information technology and the high quality of spatial data, spatial data interpolation method and its application have been paid more and more attention. Geostatistics is a cross-discipline arising from the development of mining industry in the 60s and 70s twentieth Century. It belongs to the branch of mathematical address science. Professor G.Matheron, a famous French scholar, elevated professor J.Krige’s experience value and method to theory and created geostatistics. Geostatistics is used to analyze and predict values associated with spatial or temporal phenomena.Traditional statistics usually assumes that the samples collected by a random variable are completely random, or completely independent in space (or time), without considering the location of samples. Geostatistics is a further development of statistics, and its variables are not necessarily completely random or completely independent in space or time. For the sample data, in addition to calculate the mean and variance statistics, also need to calculate spatial variability structure variables, geostatistics is based on the theory of regionalized variable, the variation function as a tool, the research on the spatial distribution is random and structured, or spatial correlation and dependence of the natural phenomena of science. ArcGIS’s Geostatistical Analysis tool is a powerful, simple and easy to operate data analysis and surface modeling tool. It uses deterministic interpolation and geostatistics to model the surface.
In ArcGIS software, exploratory data analysis is a series of graphical tools provided by the software and interpolation methods applied to data, to understand the data in depth and to understand the research object, so as to make a better analysis of the problems related to the data. Using Kriging interpolation method in this paper, the Kriging interpolation method is also called the optimal interpolation method of spatial autocovariance, based on the theory of variance function and structure analysis, a method for unbiased optimal estimation of regionalized variables in a limited area is proposed[Tang and Yang (2006)]. It has a more user-friendly interface style, which realizes the combination of positioning of text, image and graphics information, query, retrieval mode,visualization of information expression, visualization, and simple operation [Zheng, Gang,Ju et al. (2005)]. When the data is normally distributed, the garlic price is generated by the interpolation method to simulate the surface effect best, before using the interpolation method, using exploratory spatial data analysis tool for browsing data, evaluation data statistical properties of spatial data, spatial variability, data correlation and global trends,in-depth understanding of the data and selection method and the most suitable parameters for difference model. In this paper, the histogram and the normal QQ distribution are used to verify whether the data is normally distributed. In the histogram, if the data follows a normal distribution, the mean is similar to the median, the skewness is close to zero, and the kurtosis should be close to 3. The point on the normal QQ plot indicates the normality of the univariate distribution of the data set. If the data is normally distributed,the point will fall on the 450 reference line [Mu, Liu and Wang (2006)]. The estimated value of any point to be estimated can be obtained by the linear combination of the n observation sample values within the range of the point to be estimated. The algorithm of the point Kriging interpolation method at any estimated point X0is as follows:

Z (Xi) is the garlic price at point Xi; λiis the weight coefficient, which is the coefficient that affects the size of each known garlic price Z (Xi) when estimating Z (Xi). It is based on the variation function, and the semivariance is substituted into the Kriging equation group, and the sum is equal to 1. The Kriging interpolation method uses the statistical law of the sample to quantify the spatial autocorrelation between samples to generate a simulation surface of garlic prices, thereby obtaining the distribution of garlic prices in the region.
3 Spatial characteristics analysis of garlic price
3.1 Autocorrelation analysis
Using ArcGIS spatial autocorrelation (Moran I) in the tools of garlic prices in 2015-2017 in Shandong province are analyzed, the results of spatial correlation analysis were got in Tab. 1, according to Tab. 1 of Moran’s Index value to map the Moran’s Index change trend (Fig. 1).
The results showed that the “I” values of the research data were all positive, which showed that there was a positive correlation between the price of garlic and the region as a whole. Moran’s Index has a significant change In April 2015 and December 2016, the Moran’s Index was very small but still greater than 0, so the spatial distribution pattern of garlic was aggregated on the whole when the price of garlic was relatively stable.
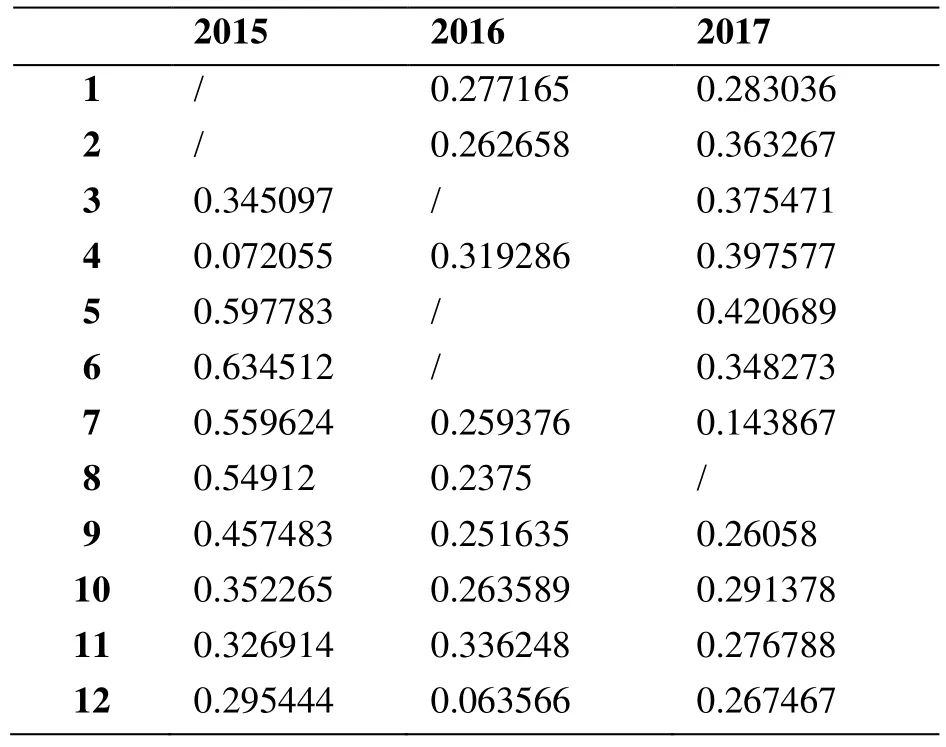
Table 1: Spatial correlation analysis of garlic price
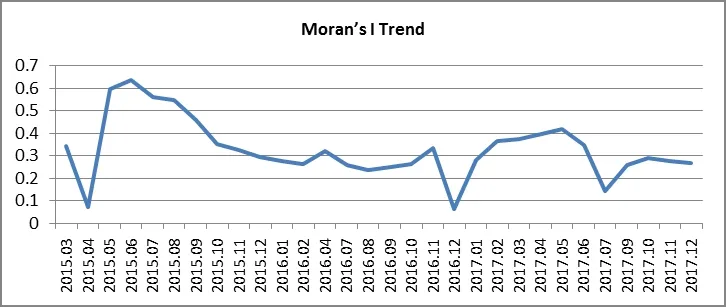
Figure 1: Change trend of Moran’s index of garlic price
From the Moran’s Index variation curve, it can be seen that the garlic price in Shandong province has always been a spatial agglomeration during the study period, but the degree of concentration is slightly different. Specifically, the I value of Moran’s index began to rise in April 2015 and reached the highest level in one year in June. In 2016, the data of May and June were deleted because of missing data. The trend of Moran’s Index was relatively mild in general. The I value of May 2017 is the highest. The regional correlation concentration of garlic prices in the season is the highest each year, indicating that the main garlic production area will greatly affect the prices of garlic in the surrounding areas, thus further spreading to the wider periphery.
3.2 Geostatistical analysis
3.2.1 Normal distribution of garlic price
As mentioned above, the second phase of data exploration using Exploratory Spatial Data Analysis (ESDA) tools is needed to test whether the data obey the normal distribution before using Kriging interpolation. Taking the data in January 2017 as an example, the experimental results, as shown in Fig. 2, show that the average =8.7937 is similar to the median =8.83, the skewness =-0.085668 is close to 0, and the kurtosis =2.3622 is close to 3, which indicates that the garlic price in January 2017 is a normal distribution.
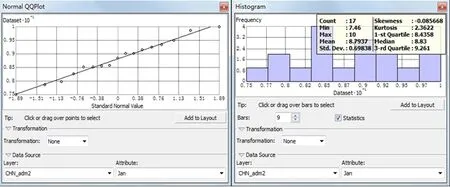
Figure 2: January price value and standard normal value diagram
The results of the other months of 2015-2017 are calculated by the same reason, take the data of 2017 as an example, such as Fig. 3 and Tab. 2. The results of the data and chart can be basically determined, and the price of garlic generally obeys the normal distribution.
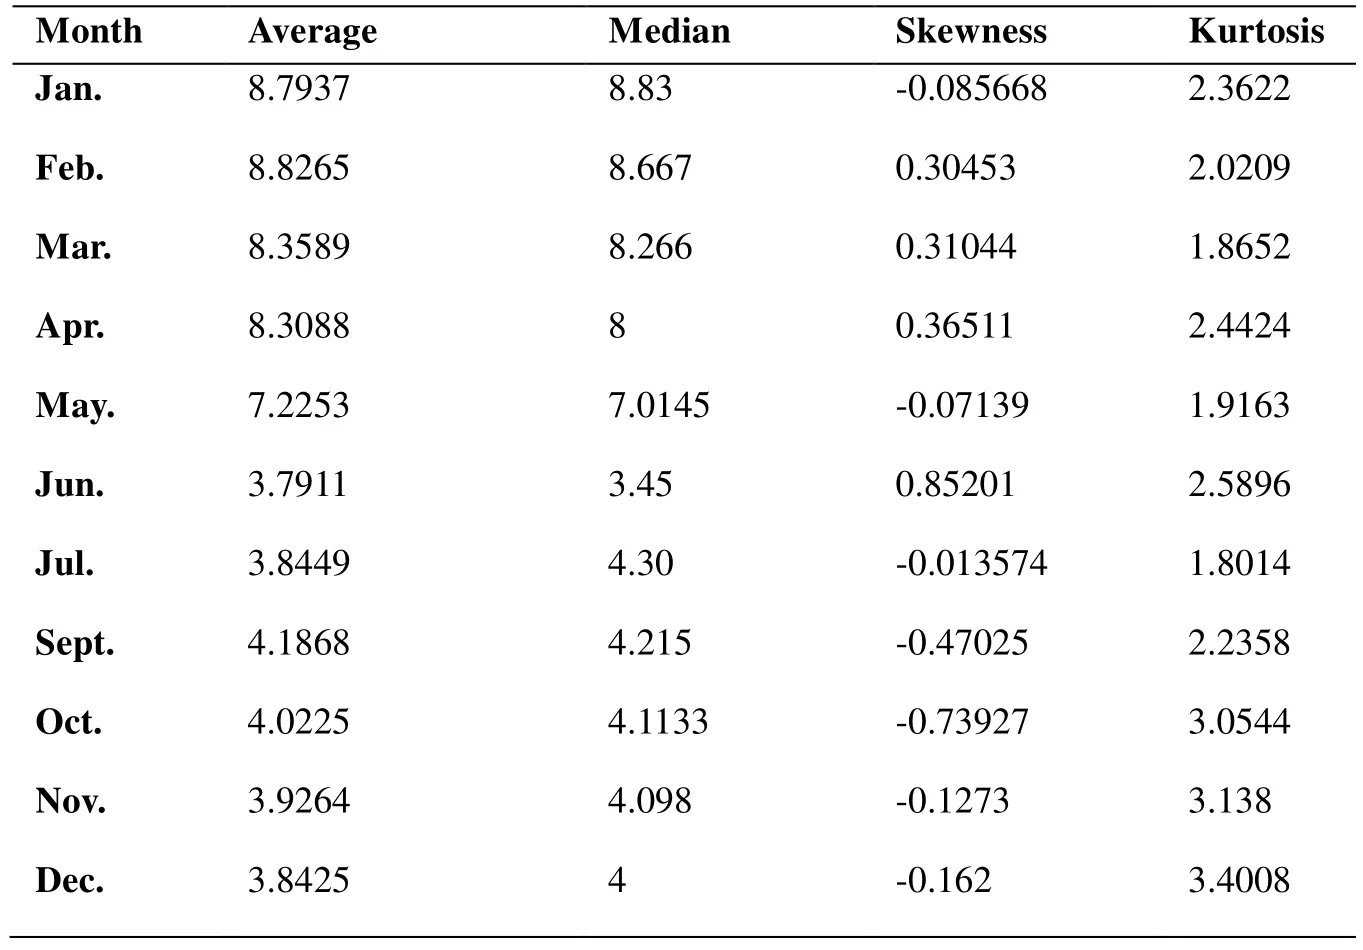
Table 2: The price of garlic in Shandong Province
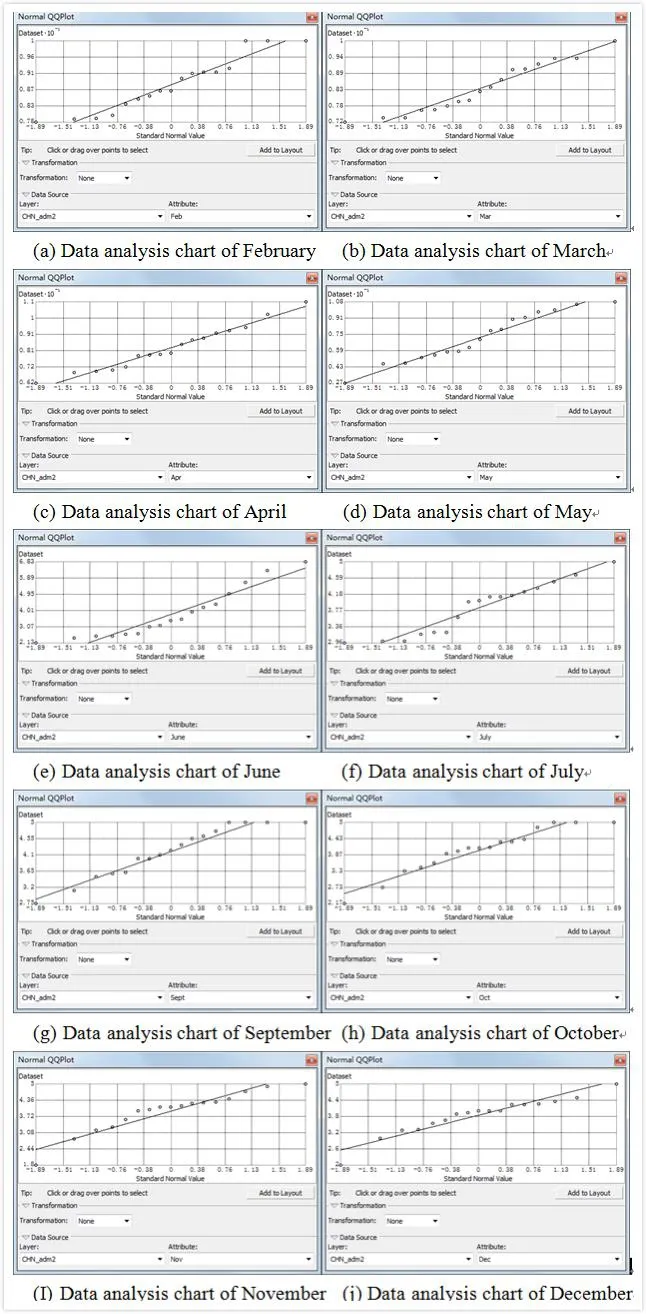
Figure 3: The normal distribution QQ of garlic price in 2017
3.2.2 The spatial distribution of garlic price
According to formula (2), we use ordinary Kriging method to interpolate the sample data and classify the price area of garlic on the map. We get the spatial distribution of garlic prices in Shandong province in 2017, Grid chart (Fig. 4). The analysis can be obtained:
(1) The price of garlic in Shandong is generally low in the West and high in the East, and the price of garlic from inland to coastal is getting higher and higher. In the picture, the color of the western region is light, and the eastern part is deep. Especially in Southwest region, the color is the lightest, while the northeast coast is the deepest.
(2) The price of garlic in Shandong is decreasing around the Rizhao, Binzhou, Yantai,and Qingdao. The price is increasing at the center of Jining.
(3) The high price of garlic is mainly concentrated in Yantai and Qingdao, with extremely low values concentrated in Jining and its surrounding areas.
(4) The variation trend of garlic price was distinct. The increase of garlic prices in the surrounding areas of Jining is slow, and the trend of garlic prices in southeastern Dezhou,Western Binzhou, Western Zibo and Western Rizhao is obvious. The garlic price change trend is obvious from the main production area to the nonmain producing area.
The transmission of price fluctuation exists in the market region. The price of garlic in the neighborhood has a driving effect. The rise or fall of garlic prices in the neighborhood will lead to the change of garlic prices in the surrounding area, and thus the above spatial agglomeration effect. Spatial statistical analysis tools in ArcGIS provide stronger support for data analysis of garlic price and can be widely applied to more extensive fields in the future research.

Figure 4: The spatial distribution Grid of garlic price in Shandong Province in 2015-2017
4 Conclusions and prospect
4.1 Summary
This paper analyzes the spatial distribution of garlic prices from the perspective of spatial geography, applying GIS technology to the spatial partition of garlic price; we explored the spatial correlation of garlic prices, and made innovations in the methods and ideas.Using the method of spatial analysis to make up the deficiency of the traditional statistic method ignoring the spatial attribute, the paper gives the spatial autocorrelation analysis of the price of garlic in Shandong Province, calculates the Moran’s Index and draws the following conclusion:
(1) When the price of garlic is relatively stable, the spatial distribution pattern is the aggregation rule in the whole, which indicates that the price is transmitted quickly between the markets. Studying and understanding the regional differences and spatial distribution rules of garlic prices in different regions will help to guide the development of garlic industry and realize the balance of supply and demand in garlic regions.
(2) The spatial distribution of garlic price is analyzed by using the statistical analysis tool in ArcGIS, which makes the result of the analysis of garlic price data more intuitive and compensates for the lack of position relativity of traditional analysis method. Using the locale statistical analysis tool in ArcGIS, we can explain the regional difference of price more clearly, and find the hot and cold spot of the price distribution. Helps related departments adjust garlic structure.
4.2 Prospect
In this paper, when studying the interrelationships between garlic price regions in Shandong Province, the wholesale price of garlic was used. The sales price of garlic farmers and the purchase price of ordinary consumers were not taken into account. There were deficiencies in price control factors and garlic prices. There are many factors that affect the price of garlic, including garlic planting area, market demand, seasonal and weather changes, planting and transportation costs, etc. In the future research process, we will try to consider comprehensively and integrate these factors. Analyze the geographical distribution of garlic prices and work hard to make a more in-depth study of garlic prices.
Acknowledgements:This work was financially supported by the following project:
(1) Shandong independent innovation and achievements transformation project(2014ZZCX07106).
(2) The research project “Intelligent agricultural system research and development of facility vegetable industry chain” of Shan-dong Province Major Agricultural Technological Innovation Project in 2017.
(3) Monitoring and statistics project of agricultural and rural resources of the Ministry of Agriculture.
 Computers Materials&Continua2019年1期
- Computers Materials&Continua的其它文章
- Development and Application of Big Data Platform for Garlic Industry Chain
- GFCache: A Greedy Failure Cache Considering Failure Recency and Failure Frequency for an Erasure-Coded Storage System
- ia-PNCC: Noise Processing Method for Underwater Target Recognition Convolutional Neural Network
- Estimating the Number of Posts in Sina Weibo
- GA-BP Air Quality Evaluation Method Based on Fuzzy Theory
- A Robust Image Watermarking Scheme Using Z-Transform,Discrete Wavelet Transform and Bidiagonal Singular Value Decomposition
