Numerical study of hydrodynamic mechanism of dynamic tidal power
Png Dai,Ji-shng Zhang,Jin-hai Zhng,*,Ks Hulsbrgn,Gijs van Banning,Jron Ama,Zi-xuan Tang
aState Key Laboratory of Hydrology-Water Resources and Hydraulic Engineering,Hohai University,Nanjing 210098,China
bState Key Laboratory of Hydrology-Water Resources and Hydraulic Engineering,Nanjing Hydraulic Research Institute,Nanjing 210029,China
cCollege of Harbor,Coastal and Offshore Engineering,Hohai University,Nanjing 210098,China
dHulsbergen Hydraulic Innovation&Design H2iD,Dieren,6953 CR,The Netherlands
eARCADIS Nederland BV,Zwolle,8017 JS,The Netherlands
Abstract Dynamic tidal power is a new way of capturing tidal energy by building a water head using a dike perpendicular to the coast.This study explored the hydrodynamic mechanism of the water head across an intended dynamic tidal power dike system using the Delft3D-FLOW software module.The propagating wave was simulated in a rectangular domain with a horizontal sea bottom at a 30-m depth.A significant water head was created across the dike by blocking the water.The water head increased with increasing dike length and increasing undisturbed tidal current acceleration.The maximum water head for the dike with a length of 50 km,located 900 km from the western boundary,was 2.15 m,which exceeded the undisturbed tidal range.The time series of the water head behaved in a manner identical to the undisturbed tidal current acceleration.The distribution of the water head over the dike assumed an elliptical shape.A parasitic wave was generated at the attachment and scattered outward.The phase lag across the dike did not behave as a linear function of the detour distance.
©2018 Hohai University.Production and hosting by Elsevier B.V.This is an open access article under the CC BY-NC-ND license(http://creativecommons.org/licenses/by-nc-nd/4.0/).
Keywords:Dynamic tidal power;Marine renewable energy;Added mass;Phase-shift;Coastal engineering;Delft3D
1.Introduction
Most exploitations of tidal potential energy consider placing a barrage at the mouth of a river or a bay to enclose a tidal basin.As the tide recedes seaward,a gradually increasing water head difference is created between the falling water level on the ocean side and the water level on the basin side(Clark,2007;Xia et al.,2012).The principle of a tidal barrage system is simple,and similar to that of a hydropower plant(Rourke et al.,2009).The most successful tidal barrage system,the Rance Tidal Power Station,is situated at the mouth of the Rance River in France and has a generating capacity of 240 MW(Etemadi et al.,2011).The Rance Power Plant had long been the world's largest tidal power plant,and was only recently exceeded by the Shihwa Tidal Power Plant in Korea,which has a capacity of 254 MW.
Although tidal potential energy is easy to harness and is regarded as clean and renewable,the development of tidal barrage systems has been relatively slow owing to strict requirements relating to natural tidal conditions and concern over the environmental impact caused by the enclosure of a basin.Recently,Hulsbergen et al.(2005,2008)proposed a new way of extracting potential energy from tides by constructing a dike with lengths of 30-50 km with one tip attached to the coast and the other situated in the open ocean.The body of the dike was orthogonal to the shoreline(Fig.1(a)).A difference in water levels on opposite sides of the dike was created across the dike.This water level difference,i.e.,the water head,was used to drive turbine(s)installed inside the dike.This method was referred to as dynamic tidal power(DTP)by Hulsbergen.DTP did not involve a basin and did not require a large tidal range,but utilized a considerable amount of tidal potential energy.This new concept contributed to advancing technology in harnessing clean,renewable energy,and worked according to a completely different principle compared to the traditional tidal barrage system(Fig.1(b)).
The concept of the DTP was first presented by Hulsbergen et al.(2005).He briefly introduced an analytical model,i.e.,Kolkman's model,to explain the physics of the DTP phenomenon.Kolkman's model assumed a plate oscillating harmonically in an infinite water tank,which was a reversed image of a DTP dike but retained the same Keulegan-Carpenter(KC)number.This ensured that the inertial force was dominant in both cases.Kolkman indicated that the water level difference was dependent on the length of the dike and the tidal current velocity,and his model roughly estimated the DTP water head.The practical effects of DTP dikes were tested by numerical models representing the IJmuiden waters of the Netherlands,and the Yellow Sea of China(Hulsbergen et al.,2005,2008).The results from the model for the IJmuiden waters indicated that a factor of 1.7 was needed to transform the analytical head to a numerical head.The factor was case-dependent.The model for the Yellow Sea exhibited a maximum water head of 3.93 m with a maximum power of 44.6 GW.The possibility of a twin-dike mode was also tested in the Yellow Sea model.The mutual effect of the twin dikes yielded more constant power,which was favored by the grid manipulation.Mei(2012)discussed the interaction of a harmonic tidal wave with a long coast-perpendicular dike and obtained the same result as Hulsbergen et al.(2005,2008).Mei(2012)also predicted that there would be a wave doublet around the dike,but did not consider the asymmetry of the tidal wave.Liu and Zhang(2014)regarded this type of power as tidal wave phase-shift energy,and analyzed the water head for a Y-shaped DTP dike in the Taiwan Strait using a twodimensional(2D)numerical model that represented the entire Chinese coast.The results showed that when the angle between the main dike extension line and the branch dike reached 40°,the water levels on both sides of the dike were mutually out of phase,and the water head exhibited a maximum value.The water head also increased as the length of the branch dike increased.The results also showed that the Y-shaped dike created a larger water head than the T-shaped dike.
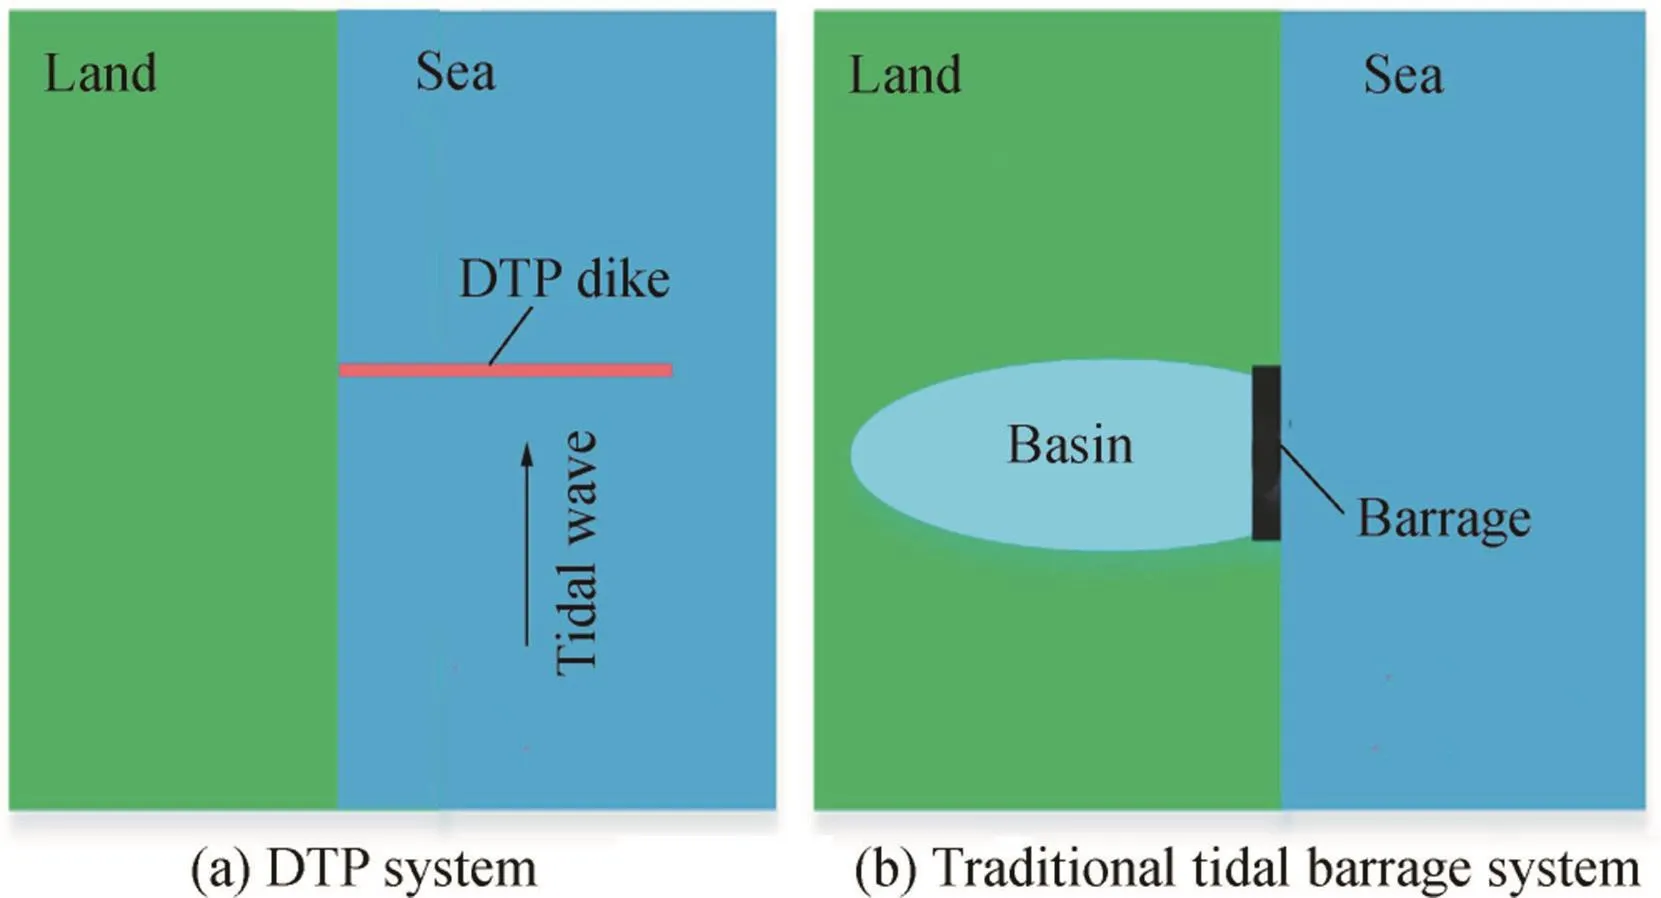
Fig.1.Comparison of DTP system to traditional tidal barrage system.
Although many efforts have been made to investigate the DTP phenomenon(Dai et al.,2017a,2017b;Zhang et al.,2012;Zheng et al.,2012),the hydrodynamic mechanism remains unclear.Hulsbergen et al.(2005,2008)assumed a plate submerged in an infinite water tank.However,the DTP dike interacted with free surface tidal wave movements.The actual tidal wave was comprised of many constituents.
Numerical tools have been successfully used to study a lot of hydrodynamic phenomena(Robins et al.,2015;Zheng et al.,2017).In order to better understand the water head mechanism,a series of numerical experiments based on the Delft3D module were conducted to study the relation between the water head and the near-dike hydrodynamics.The numerical methods are presented in Section 2,followed by the results and discussion in Section 3.Finally,conclusions are provided.
2.Methods
2.1.Governing equations
The Delft3D model suite,developed by WL Delft Hydraulics(now Deltares),has been widely used to simulate 2D and three-dimensional(3D)flow,transport,and biogeochemical processes in surface water systems,including rivers,lakes,estuaries,reservoirs,wetlands,and nearshore to shelf-scale coastal regions(Harcourt-Baldwin and Diedericks,2006;van Maren,2007;Allard et al.,2008;Zhang et al.,2013).The Delft3D model can predict water level and velocity,salinity and temperature distributions,and sediment transport.The main part is the FLOW module,which solves the Navier-Stokes equation for an incompressible fluid in shallow water under the Boussinesq assumptions.In this study,the Delft3DFLOW model was used in 2D mode.The continuity and momentum equations are written as follows(Deltares,2011):where ζ is the water level;t is time;d is the water depth;U and V are the depth-averaged velocities in the x and y directions,respectively;Q is the intensity of mass sources per unit area;g is the acceleration of gravity;τbxand τbyare bottom frictions in the x and y directions,respectively;f is the Coriolis force parameter and f=2ΩsinΦ,where Ω is the angular speed of the earth's rotation and Φ is the latitude; υhis the horizontal turbulent eddy viscosity;and ρ0is the water density.

The continuity and horizontal momentum equations are solved with an alternating direction implicit(ADI)finite difference method on a staggered(spherical or orthogonal curvilinear)grid.
2.2.Boundary conditions and numerical parameters
The wind,bathymetry,and Coriolis force must be taken into account in reality.However,to understand the mechanism of the water head at the current stage,all of these effects are ignored in the model.In this study,numerical experiments were conducted within a domain of a 1200 km×900 km rectangle(Fig.2),bounded by two coasts to the north and south.The thin blue lines to the west and east are two open boundaries for which the Riemann boundary condition applies.The Riemann boundary condition is an absorbing-generating boundary condition that allows the outgoing long waves to leave the computational domain(van Dongeren and Svendson,1997;Verboom and Slob,1984).According to Zhang(2005),the amplitude of the M2tidal component along the Chinese coast is in the range of 0.2-2 m.Therefore,the M2tidal component with an amplitude of 1.5 m and a period of 12.4 h was used to drive the model,traveling from west to east.
The Coriolis force was set to 0 in the domain.The sea bottom was uniform over the entire domain at a depth of 30 m.The duration of the simulation was 96 h,or approximately eight tidal cycles.The homogeneous ocean was initially motionless(a so-called cold start).A high Chezy number of 130 was employed to avoid significant wave damping.The influences of grid size and υhon numerical solutions were tested,and a 1 km×1 km orthogonal grid was finally used.The numerical result was not sensitive to υh.Avalue of 1 m/s2was adopted for the final simulation.For the grid manipulation,the dike was represented as a straight line following the computational grid.Based on a sensitivity analysis of this model for different time steps,a time step of 5 min was chosen for the simulations.
后经系统水泥化学复合灌浆后30多个测点的岩体变形模量在1.4 GPa~9.8 GPa之间,均值为5.3 GPa,灌浆后岩体变形模量略有提高,但提高不明显。一是复合灌浆仅进行了少量水泥灌浆,总体上为化学灌浆,环氧灌浆材料是一种高强度低模量材料,对于这种地质条件和水泥灌浆效果相对好的情况,化学灌浆仅起补强和加强防渗作用。因此,化学灌浆后变形模量提高较小约6%,但防渗性能大大提高,灌后围岩透水率在高压压水条件下均小于0.5 Lu。

Fig.2.Model overview.
3.Results and discussion
This section is structured as follows:the undisturbed tidal characteristics are first examined as the baseline;the changes introduced by the 50-km dike are then presented,followed by an analysis of the influence of the length of the dike on the water head;and the dike is then theoretically moved to different locations to study the effect of tidal current acceleration on the resulting water head.
3.1.Model validation
Before studying the effects o f the 50-km dike on the local tides in perspective,the general undisturbed local tidal characteristics,i.e.,the situation without a dike,was used for validation and also as a reference in the analysis of the dike scenarios.The analytical model by Chen(1980)was selected for comparison with the simulated results.The governing equations of Chen's model(1980)are given as Eq.(4)through Eq.(6).The convective terms are ignored and the bottom friction is assumed to be linearly dependent on velocity.
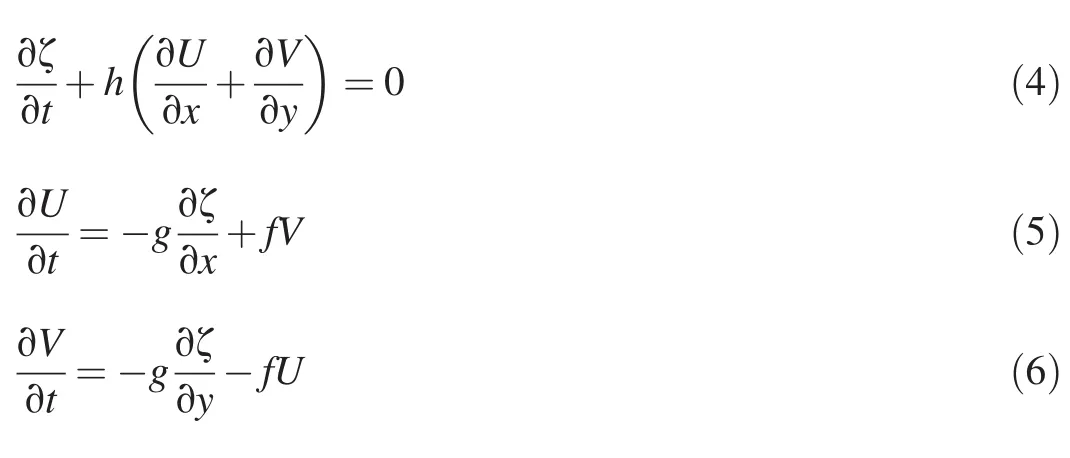
where h is the total water depth.Figs.3 and 4 respectively show comparisons of simulated water levels and velocity time series with the analytical results at three monitoring points:A,B,and C.The analytical results were obtained using a separate variable method.The water level and velocity at point A agreed with analytical results.The simulated water levels and velocities at points B and C showed a slight deviation from the analytical results,because B and C were located in the middle and eastern parts of the model domain.The tide became distorted and asymmetric because the tidal crest traveled faster than the trough.However,the analytical model did not account for the phase velocity variations of high tide and low tide.Another reason was the linear assumption of friction in the analytical model.For numerical modeling,the bottom friction force was assumed to be a quadratic term of the velocity.Although some deviation occurred in the validation due to some assumption differences between the numerical model and analytical model,the simulated results can be regarded as acceptable.

Fig.3.Comparison of simulated water levels with analytical results at three monitoring points.

Fig.4.Comparison of simulated velocities with analytical results at three monitoring points.
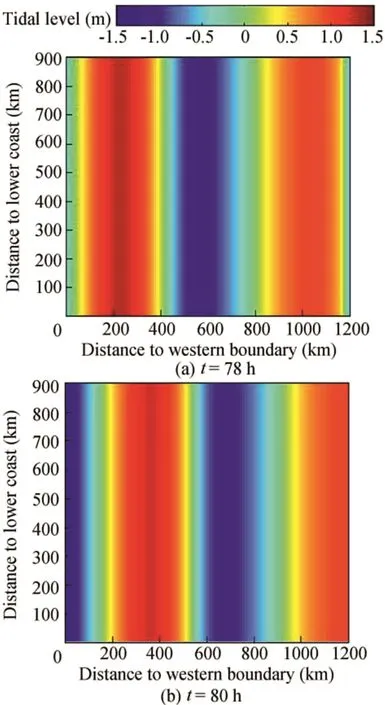
Fig.5.Progressive tidal wave in model domain.
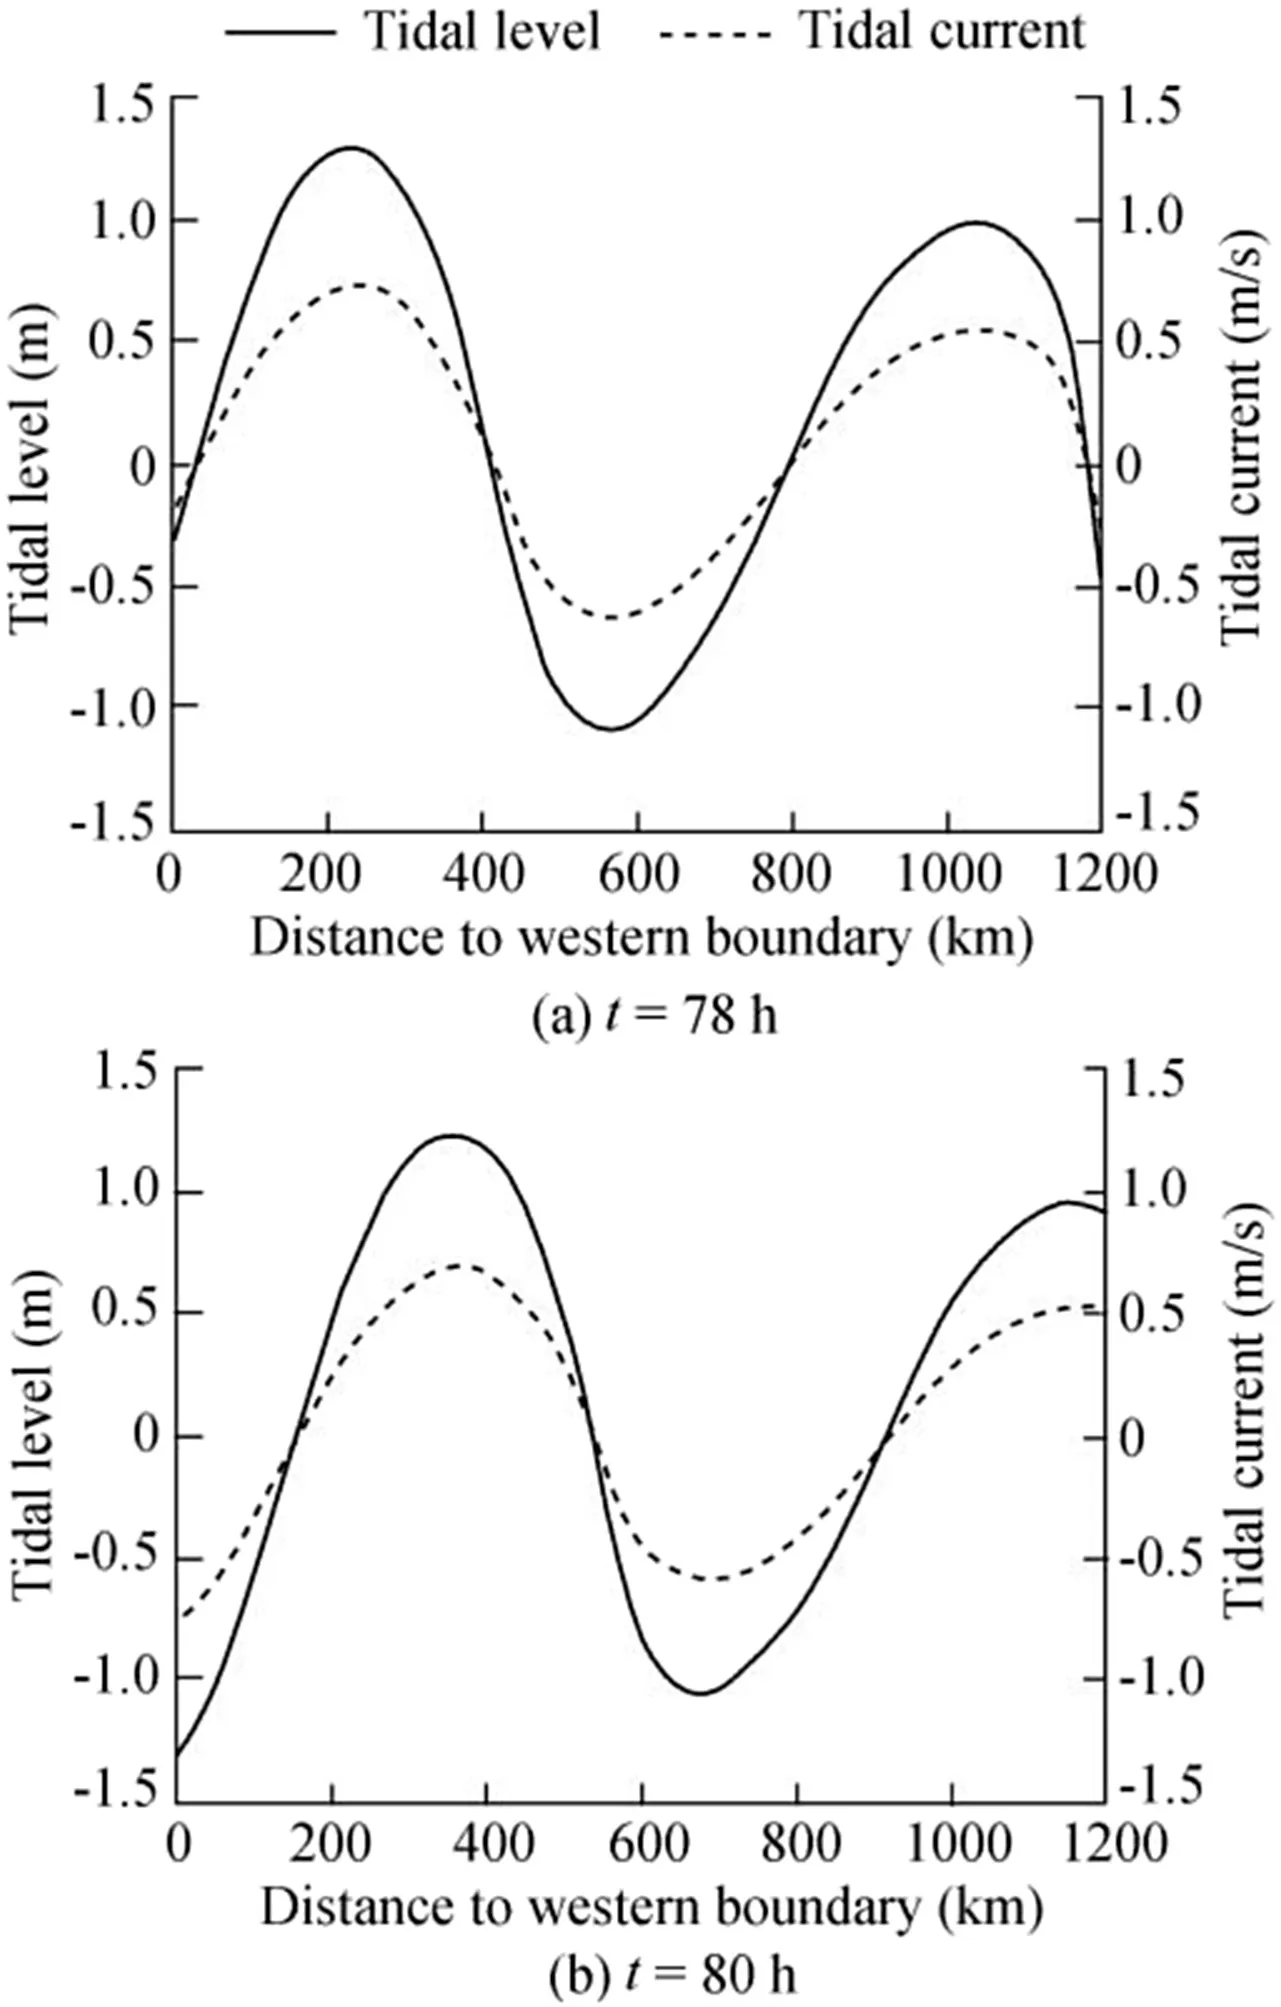
Fig.6.Progressive tidal wave in model domain(longshore section view).
The undisturbed tide is a progressive tidal wave. Figs. 5 and 6 respectively provide snapshots of tidal level over the domain and the longshore tidal level along the centerline.In Fig.5,the red reads as the high tidal level,and the blue reads as the low tidal level.Darker red and blue were observed on the western side,and lighter red and blue were observed on the eastern side.The front of the wave became much steeper,and the back be came flatter from the west to the east.The velocity v was zero,and the cross-shore tidal level was horizontal.Therefore,the tidal wave traveled with its crest orthogonal to the coast and gradually attenuated and deformed(Fig.6).
The phase speed for a propagating wave wasTherefore,the wave crest traveled a little faster than the wave trough due to the larger depth at the crest,which led to deformation and asymmetry.The tidal spatial variation of asymmetry intensity,the M4/M2ratios for distances to the western boundary of 200,300,400,500,600,700,800,900,and 1000 were 0.051,0.072,0.093,0.110,0.128,0.139,0.157,0.171,and 0.183,respectively.This parameter was also adopted by Suh et al.(2014)to study the local and far-field effect of multiple coastal constructions along the west coast of Korea.The M4/M2ratio increased from the west of the domain to the east,which indicated that the asymmetry of the tide was intensified.
3.2.Effect of 50-km dike on local tide

Fig.7.Tidal level distribution.
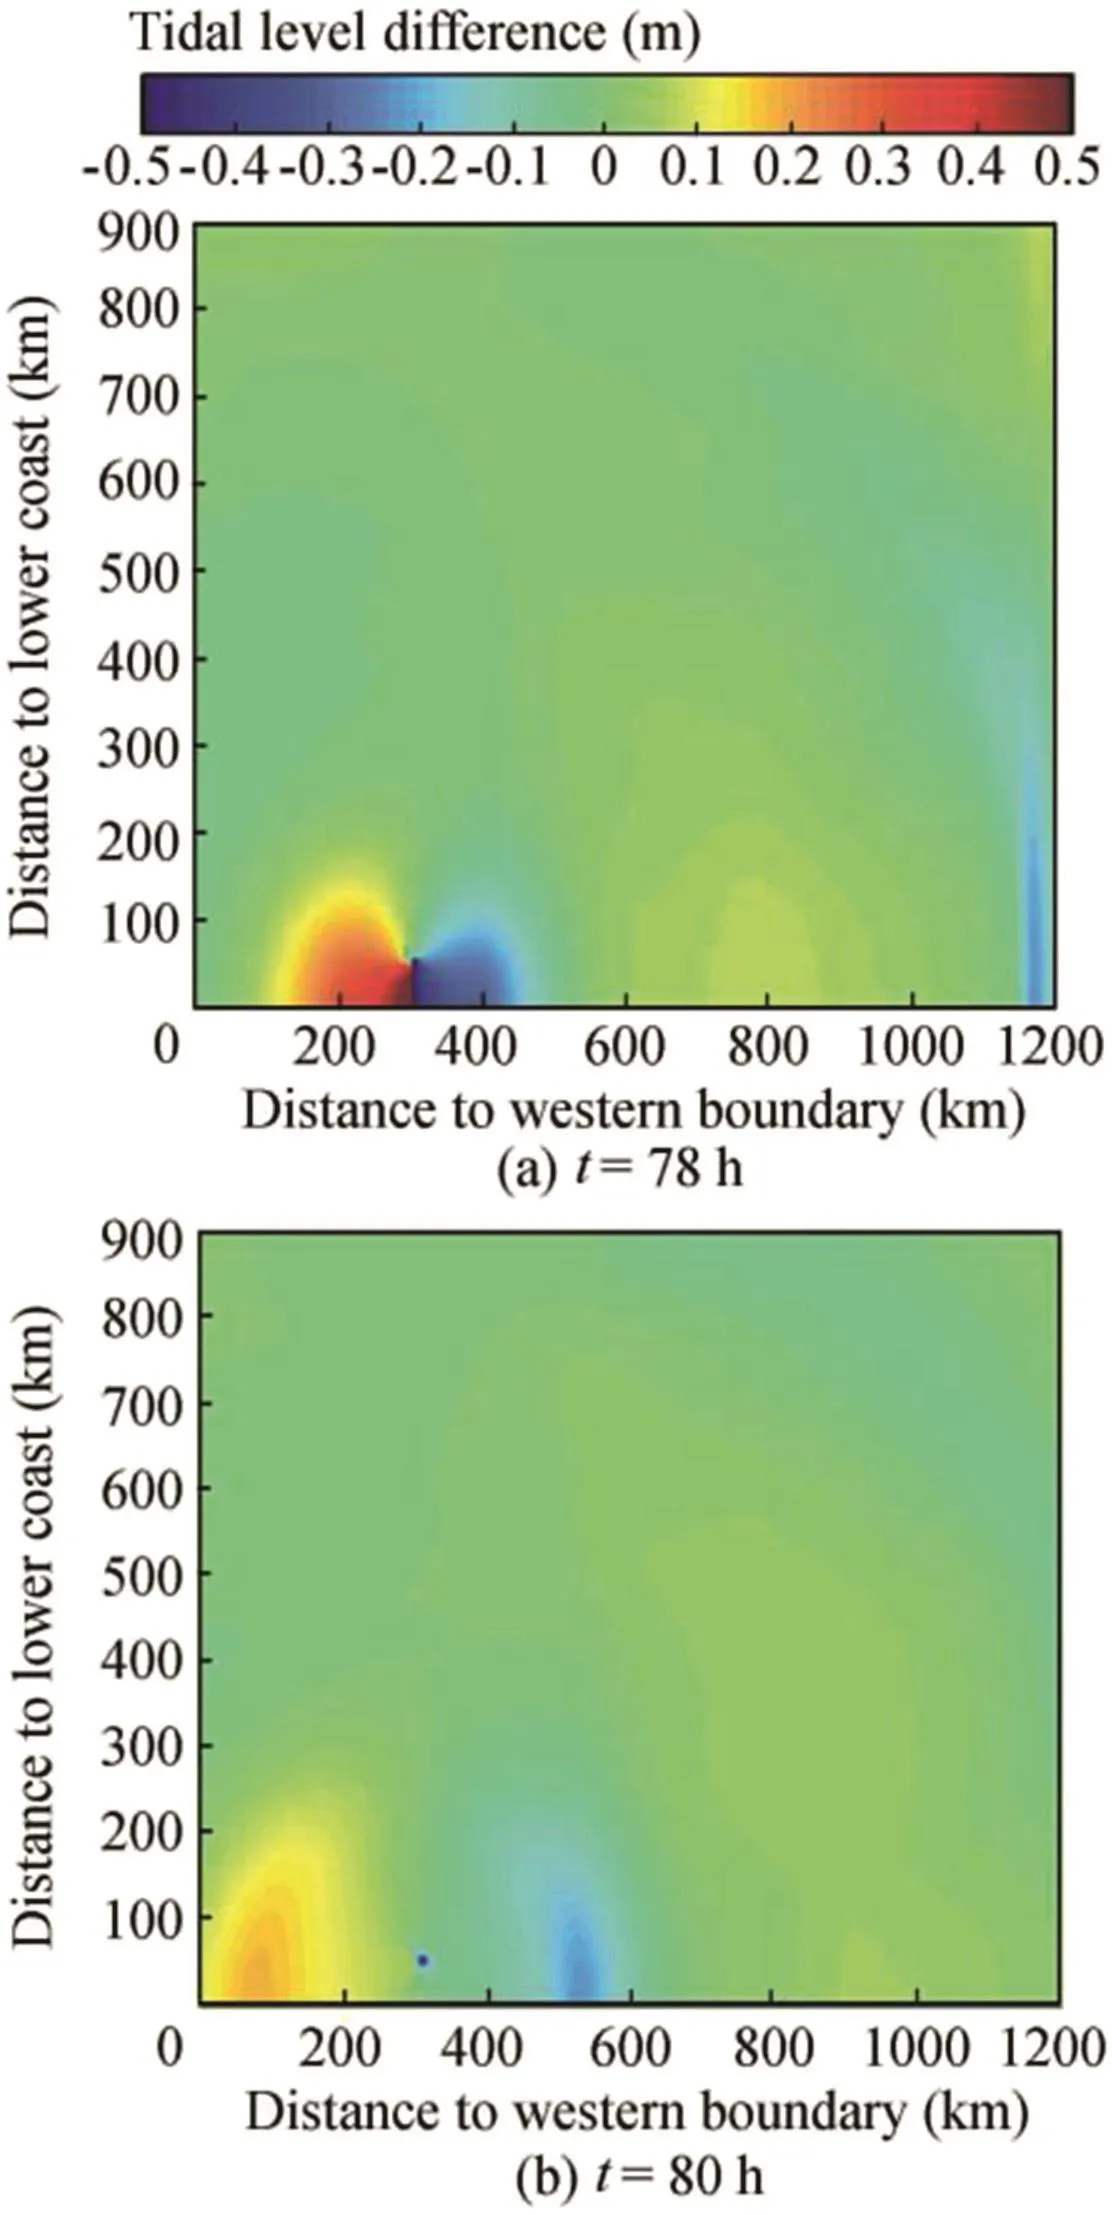
Fig.8.Tidal level differences between 50-km dike and baseline case(parasitic wave).
A 50-km dike was located 300 km from the western boundary,attached and orthogonal to the lower coast extending 50 km seaward(Fig.7).The dike created a parasitic wave that scattered away from the dike's attachment(the joint connecting the dike to the shore).Fig.7 illustrates the tidal level distribution over the domain.Fig.8 presents the tidal level differences between the 50-km dike and the baseline case.The attachment looked like a source point generating a parasitic wave crest traveling in the northwest direction.Simultaneously,a symmetric wave trough was created on the other side of the dike and scattered in the northeast direction.These two waves formed a circle pattern,with a symmetric line at the centerline of the dike(and its extension),where the two contra-phase waves almost compensated for each other.The wave height gradually diminished as a result of radial dispersion.
The dike created a water head,which varied with space and time.Fig.9 shows a sequence of illustrations of the water head distribution along the dike.For convenience,the water head was defined as the water level on the eastern side of the dike subtracted from the water level on the western side.Therefore,a positive water head indicated that the water level on the western side was higher than that on the eastern side,and a negative water head indicated that the water level on the eastern side was higher than that on the western side.Going from the attachment to the tip,the water head first showed no decrease or a slight decrease toward the tip.At the tip,the water head suddenly dropped to zero.The distribution of the water head along the dike looked like a quarter of an ellipse with its major axis positioned to coincide with the dike's centerline.The ellipse was in a filled pattern over the seaward half.

Fig.9.Water head distribution along dike.
In general,the water head at the attachment was equal to or larger than that of the other parts of the dike.Therefore,the attachment water head was selected as a representation.The tidal range on the western side of the dike was approximately 3.6 m,whereas it was just 2.4 m in the undisturbed circumstances.The tidal range on the eastern side retained its range from the original tide,but it underwent a time lag,which was favorable for the resulting water head.Fig.10 illustrates the undisturbed tidal current acceleration and the water head.Some remarkable changes occurred after the dike was inserted.The maximum positive water head was approximately 1.8 m.In addition,the maximum water head occurred close to the high water,at exactly the same moment when the parasitic waves were generated.Thus,the parasitic wave is responsible for the maximum water head.
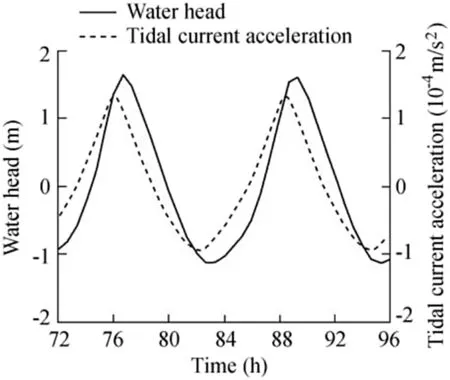
Fig.10.Attachment water head.
In the model,the phase lag(p)across the dike within one tidal cycle was defined as follows:

where twis the high water time on the western side of the dike and tEis the high water time on the eastern side of the dike.The phase lag over the entire dike is illustrated in Fig.11(see also Table 1).If the tidal wave made a trip all the way from the coastline around the dike's tip and back,thereby changing the phase corresponding to the length of the detour,the phase lag across the attachment would read 46.8°.The numerical result of the phase lag was approximately 53°.The tip was only the folding line of the tide as it made a detour.Therefore,the phase lag at the tip should read 0.However,the numerical result was approximately 25°.

Fig.11.Phase lag over dike.
3.3.Influence of dike length
The water head distribution for 20 km-,30 km-,and 40 kmdike cases followed the filled ellipse shape.The spatial maximum water head generally occurred at the attachment.Table 1 gives the maximum water head at the attachment for each dike,as well as Kolkman's head calculated by Kolkman's equation(Hulsbergen et al.,2005,2008,2012).The maximum water head increased with increasing dike length.However,the numerical heads deviated from the theoretical ones.Kolkman only considered a submerged plate oscillating in an infinite water tank.Therefore,the deviation may be explained by the free surface wave effect.Additionally,if the tide makes a detour path around the dike,the phase lag should change with the dike length because the tide must make a longer detour around a 50 km-dike than a 20 km-dike.However,the numerical simulation yielded more or less identical values in different scenarios.This means that the head created across the dike cannot be explained by the tidal wave making a detour from its path parallel to the coast.Instead,the tidal wave maintained a straight course along the coast,creating a head across the dike as a result of the dike-tide interactions.
Each individual dike created a parasitic wave,with a crest in the front and a trough at the back.The wave formed a radiating pattern that traveled in all directions.The 20-km dike created the weakest parasitic wave.With increasing dike length,the parasitic wave became stronger.According to Mei(2012),a set of two waves formed on both sides of the dike,which were in precise contra-phase(a doublet)and resembled each other.The monitoring point was positioned at the attachment on the western side of the dike.The hourly observed water level data from 0 h on the second day to 0 h on the 32nd day(one day for spin-up,30 days for simulation)were used to perform tidal analysis(an extended simulation specifically for tidal analysis)using a Matlab tool(Pawlowicz et al.,2002).The tidal analysis was based on the differential water levels,which were determined by subtraction of the original water level from the disturbed water level,i.e.,the parasitic wave.The M2,and M2-induced higher components were the dominant components in the parasitic wave.Thus,the effect of dike length on the parasitic wave was evaluated by checking the variance of the M2,M4,M6,and M8tidal components(Fig.12).The time series of the water level 500 m off the dike(due to the grid manipulation)at the attachment on the western side was selected to perform the tidal analysis.As shown in Fig.12,M2was the most significant component in the parasitic wave.The parasitic wave was only generatedwhen high water reached the dike;it had the same period as the original tide,i.e.,the M2tidal wave.Fig.12 also shows that each component became more significant with the increase in dike length.M2was affected more significantly than the other components.The amplitude of M2increased from 0.28 m for the 20 km-dike to 0.63 m for the 50 km-dike in an approximately linear manner.The amplitudes of M4,M6,and M8were smaller than that of M2.Their increase as a function of dike length also reflected a linear shape,but the increasing ratio was smaller than that for M2.

Table 1 Comparison between numerical water head and analytical water head.

Fig.12.Amplitudes of M2,M4,M6,and M8tidal components.
3.4.Influence of tidal current acceleration
The phase velocity difference between the wave crest and the trough induced non-symmetrical behavior in the tidal wave.The crest moved faster than the trough.The wave front became steeper,and the wave back became flatter,which meant that the flood duration was shortened and the ebb duration was extended.Thus,the flood current acceleration increased,and the ebb current acceleration decreased.Kolkman would expect that the water head would increase if the dike were moved farther east.Additionally,the asymmetry of the flood current acceleration and ebb current acceleration would result in an asymmetry of the water head.On the other hand,the tidal range decreased along the tidal path as a result of bottom friction.The phase-shift theory would predict a decreased water head if the dike were relocated from the western side of the domain to the eastern side.Therefore,it was interesting to see the performance of the dike at different locations along the shore.

Fig.13.Current acceleration and water head variations in domain.
Fig.13 provides the space-dependent maximum flood current acceleration and water head variation.The maximum refers to the absolute value.The maximum flood current acceleration shows a strong increasing trend of 1.34×10⁻⁴m/s2at 200 km,and 2.27×10⁻⁴m/s2at 1000 km.The dike was relocated from a 300-km distance from the western boundary to a 900-km distance at intervals of 50 km.Each dike was simulated separately.As presented by Fig.13,when the dike was moved eastward,the positive water head increased,along with the flood acceleration.Similarly,the negative water head decreased,along with the ebb acceleration.The negative sign indicates the negative x direction,which moved from the east of the domain to the west.However,as presented in Fig.6,the tidal range decreased from the west to the east of the computational domain,which is the reverse of the positive water head trend.This evidence accorded with Kolkman's theory.The increasing acceleration was responsible for the increasing water head.The asymmetry of the water head(positive water head/negative water head)was also reflected by the asymmetry of the current acceleration.Table 2 shows that the ratio of positive water head to negative water head increases for an increasing ratio of flood acceleration to ebb acceleration.Conversely,if the tidal wave made a detour trip around the dike,the water level difference across the dike would be created only as a result of the phase difference across the dike.For a dike of fixed length,irrespective of location,the detour distance was identical,i.e.,the phase difference across the dike was constant.Therefore,the undisturbed tidal range determined the water head.The water head increased with tidal range.However,the model gave an increasing water head for a decreasing tidal range.
In order to study the impact of current acceleration on parasitic waves,five dikes were selected for which the distance to the western boundary was 300 km,450 km,600 km,750 km,and 900 km,respectively.One monitoring point was located 100 km off the attachment on the western side.Table 3 lists the parasitic wave heights for various dike locations.The parasitic wave height was determined by subtracting the original tide level from the disturbed one.From Table 3,we see that theparasitic wave height increases as the dike moves east,i.e.,the parasitic wave height increases with current acceleration.

Table 2 Asymmetry of water head and acceleration.

Table 3 Parasitic wave heights for dikes at different locations.
3.5.Power output
Hulsbergen et al.(2005)proposed a simple formula to give a rough estimation of the power output for an idealized DTP system:

where Pmaxis the maximum power output(W);ρis the ensity of the water(103kg/m3);g is 9.81 m/s2;Δhmaxis the maximum water head for the closed dike(m);Ffis a factor reflecting the relation between the water head distribution and the maximum water head;Aturbis the flow area for turbines(m2);Lfis the leak factor,which describes the effect of the turbine openings on the closed water head;Vturbis the axial flow velocity through the turbines(m/s);and η is the overall efficiency factor,which includes mechanical and PTO system losses,etc.
For the modeled dike with a length of 50 km positioned 900km off the western boundary,Δhmaxwas2.15m,the modeled water depth was taken to be a constant of 30 m assuming a 10%opening for a dike,Aturb=50×1000×30×10%=150000m2,andFollowing Huls bergen et al.(2005),Lf=0.64 for a 10%opening,Ff=1,and η=0.85.Therefore,the power was 8950 MW.
4.Conclusions
The tidal wave,primarily M2,propagated within a rectangular domain with a depth of 30 m.The tidal wave moved completely parallel to the coast from the west to the east of the domain.The wave attenuated and deformed as a result of bottom friction and the speed difference between the crest and trough.The average tidal range was 2 m,and the maximum velocity was approximately 0.7 m/s.In this set of tidal wave environments,the dike created some particular phenomena that showed,to some extent,the mechanism behind the DTP water head.The dike created the water head.The spatial distribution of the water head followed the added masspressure distribution curve.The spatial maximum value occurred at the attachment.For a dike 50 km in length and positioned 900 km from the western boundary,the attachment water head was 2.15 m.The water head increased with the length of the dike.For a dike positioned 300 km from the western boundary,the water head was 1.64 m for a dike 50 km in length,but 0.69 m when the dike length was decreased to 20 km.The water head and the undisturbed tidal current acceleration were highly correlated.The phase lag along the dike did not behave as a linear function of the detour distance.The dike created parasitic waves that radiated away from the source-point-like attachment.The parasitic wave became more significant with the increase of dike length and the augmented flood current acceleration.The parasitic wave height was 0.31 m when the dike was located 300 km from the western boundary,but increased to 0.45 m when the dike was relocated to 900 km from the western boundary.
 Water Science and Engineering2018年3期
- Water Science and Engineering的其它文章
- Experimental study on discharge coefficient of a gear-shaped weir
- Seepage simulation of high concrete-faced rockfill dams based on generalized equivalent continuum model
- Statistical description of depth-dependent turbulent velocity measured in Taihu Lake,China
- A one-dimensional transport model for multi-component solute in saturated soil
- Evaluation of numerical wave model for typhoon wave simulation in South China Sea
- Disinfection of dairy wastewater effluent through solar photocatalysis processes
