Upper trophic structure in the Atlantic Patagonian shelf break as inferred from stable isotope analysis*
ZHU Guoping (朱国平) 2 ZHANG Haiting (张海亭) YANG Yang (杨洋) WANG Shaoqin (王少琴) WEI Lian (魏联) YANG Qingyuan (杨清源)
1College of Marine Sciences,Shanghai Ocean University,Shanghai 201306,China
2National Engineering Research Center for Oceanic Fisheries,Shanghai 201306,China
3Polar Marine Ecosystem Group,Key Laboratory of Sustainable Exploitation of Oceanic Fisheries Resources,Shanghai Ocean University,Ministry of Education,Shanghai 201306,China
AbstractThe Patagonian Shelfis a very productive region with different ecosystem structures. A long history of fi shing in the Southwestern Atlantic Ocean combined with a complex hydrographic structure,with a permanent front over the shelf-break and different coastal frontal regions, and a wide non-frontal area in between have made the food web in this area more complex and have resulted in changes to the spatialtemporal scale. Stable isotopes of carbon and nitrogen were used to determine the trophic structure of the Patagonian shelf break which was previously poorly understood. The results indicated that the average δ15N value of pelagic guild (Illex argentinus) was remarkable lower than those of the other guilds. The δ13C values of almost all species ranged from -17‰ to -18‰, butStromateus brasiliensishad a significant lower δ13C value. Compared with the southern Patagonian shelf, short food chain length also occurred. The impact of complex oceanographic structures has resulted in food web structure change to the temporal-spatial scale on the Patagonian shelf. The Patagonian shelf break can be considered as a separated ecosystem structure with lower δ15N values.
Keyword: 13C;15N; trophic structure; Patagonian shelf break
1 INTRODUCTION
The Patagonian Shelf and Slope is among the most productive areas in the Southwest Atlantic. There are two marine ecosystems, the southern temperate ecosystem and the sub-Antarctic ecosystem which run from the south-western part to the north-eastern part of the Patagonian Shelf through the Falkland(Malvinas) Islands archipelago (Boltovskoy, 2000). A complex hydrographic structure, with a permanent front (the Eastern Falkland Current) over the shelfbreak and three coastal frontal regions (the temperate estuarine zone, the Patagonian tidal zone and the Patagonian cold estuarine zone) and a wide nonfrontal area in between, occurs on the Patagonian shelf (Acha et al., 2004).
In the past several decades, the Patagonian shelf has been a region with a major bottom-trawl fishery for the longfi n squid,Loligogahi(Patterson, 1988),Argentine shortfi n squid,Illexargentinus(Laptikhovsky et al., 2013), fi nfish fishery (Nakamura et al., 1986; Haimovici, 1998) and squid jigging fishery. This has become an important squid fi shing ground for the Chinese squid fishery (Chen et al.,2008). Fishery discards include damaged squid, the remains of processed commercial fi sh and by-catch species, sea urchins and scallops, and other benthos(Laptikhovsky et al., 2013). Those non-natural food sources result in a change in the feeding ecology of fishes and squids in the spatial-temporal scales(Laptikhovsky, 2004). The climate change exacerbates the complex of trophic relationships of fishes and squid in this region. The trophic level of marine fauna on the upper Patagonian shelf, particularly the Río de la Plata estuary (Botto et al., 2011) and lower Patagonian shelf (Ciancio et al., 2008), especially the waters around the Falkland Islands (Quillfeldt et al.,2015) were examined using stable isotope analysis(SIA). This analysis has proved to a powerful and reliable technique to characterize trophic relationships within the Southern Patagonian shelf region (Ciancio et al., 2008; Saporiti et al., 2015). Saporiti et al. (2015)explore the latitudinal variations in the 3 different coastal ecosystems along the Patagonian shelf using SIA. However, the food web of the Patagonian shelf break, particularly the area around the important fi shing ground of the squid fishery has not been examined and is poorly understood. Therefore, the aim of this study was to determine the trophic structure of fishes and squid in the productive Patagonian shelf break.
2 MATERIAL AND METHOD
2.1 Sample collection
Samples were collected from the large-scale midwater trawlerLongfabetween December 2014 to April 2015 in the fi shing grounds around the central Patagonian shelf break (Fig.1). All samples were collected randomly from the fi shing locations and stored in a freezer at -20°C for later analysis in a landbased laboratory.
2.2 Stable isotope analysis
Once in the laboratory, samples were unfrozen.The length (total length for skates, standard length for fi sh and mantle length for squid, in centimeters) and wet weight (in grams) of the samples were measured.The mantle or white dorsal muscle was extracted and analyzed for the cephalopods, skates and fishes,respectively. The muscle samples were thawed, dried in an oven at 60°C for 36-48 h, and ground to a fi ne powder with a mortar and pestle. Lipids were extracted from fi sh and invertebrate samples with a chloroform/methanol (2:1) solution (Bligh and Dyer,1959). This is because lipids are depleted in13C compared with other molecules (DeNiro and Epstein,1977) and lipid concentration in tissues may vary between and within species. This variation results in an artifactual variation of the overall tissue δ13C value.This powder was used directly for carbon and nitrogen analysis.

Fig.1 Study area and sampling location
Stable isotope abundance is expressed in standard δ notation relative to carbonate Pee Dee Belemnite and atmospheric nitrogen. International secondary isotope standards of knownandratios,as given by the International Atomic Energy Agency(IAEA)—namely: polyethylene (IAEA CH7,C=-31.8‰), sucrose (IAEA CH6,C=-10.4‰),ammonium sulphate (IAEA N1;N=+0.4% and IAEA N2;N=+20.3%), potassium nitrate (USGS 34;N=21.7%), L-glutamic acid (USGS 40;N=24.6%;C=22.6, 2%), and caffeine (IAEA 600; δ15N=1.0%;=27.7%)—were used for calibration ofand δ15N. The precision for nitrogen was 0.2‰ and for carbon was 0.3‰. Mean C- and N- isotope values were presented for each species.Analyses was performed at the College of Marine Sciences of Shanghai Ocean University (SHOU).
2.3 Food web analysis
Limited availability of baseline data impeded the estimation of the trophic level (TL) of these species directly. However, the samples from Ciancio et al.(2008) were almost all collected from the shelf break(Ciancio et al., 2008; Saporiti et al., 2015), so in order to assign a trophic level to all species, euphausids, a herbivores, were introduced as the lowest trophic level of all species and assigned a value of 2.0 to this species (Ciancio et al., 2008). Using the mean trophic fractionation (TF) factor for15N for marine herbivores(2.52‰; Van Der Zanden and Rasmussen 2001),trophic level was calculated by:


Table 1 The mean C- and N-isotope values and length of fi sh, skate and squid in the Patagonian shelf break

Fig.2 Stable carbon and nitrogen isotopes in the food web of the Patagonian shelf break (±SD)The δ13C values on the x-axis reflect potential carbon sources (more depleted in more offshore-pelagic waters), whereas δ15N on the y axis generally can be interpreted as proportional to the trophic level.
2.4 Data analysis
Twelve species were analyzed for carbon and nitrogen isotope composition. Species were grouped into functional guilds, i.e., demersal (Cottoperca gobio,Congiopodusperuvianus,Congerorbignyanus,Rajacyclophora), benthopelagic (Stromateus brasiliensis,Patagonotothenramsayi,Macruronus magellanicus), bathydemersal (Genypterusblacodes,Merlucciusalbidus,Brevirajaspinosa,Rajabullisi)and pelagic (Illexargentines) guilds according to their biological and ecological features (Sielfeld and Vargas, 1999; Froese and Pauly, 2011; WoRMS Editorial Board, 2014). Kruskal-Wallis test was used to examine the difference in stable C- and N-isotope signatures of guilds.
nMDS Variation in fi sh species and squid was visualized using non-metric multidimensional scaling(nMDS) on the Bray-Curtis distances with mean C-and N-isotope values. According to Clarke (1993) a stress value below 0.2 indicates that an nMDS plot is useful for interpreting differences between communities.
3 RESULT
The general picture of C- and N-stable-isotope data showed a food web with a narrow range of C-isotope values (between -18.08‰ and -17.04‰), except forS.brasiliensis(-20.75‰) (Table 1, Fig.2). δ13C values for fishes, skates and squid analyzed ranged from-22.01‰ to -16.56‰, -17.53‰ to -16.56‰ and-19.06‰ to -16.52‰, respectively. The δ15N values for fishes, skates and squid analyzed ranged from 12.86‰ to 17.63‰, 12.64‰ to 14.44‰ and 8.58‰to 12.61‰, respectively. The lowest and highest δ13C values wereS.brasiliensis(-22.01‰) andG.blacodes(-16.56‰) for fishes,R.cyclophora(-17.53‰ and-16.57‰) for skates andI.argenitna(-19.06‰ and-16.52‰) for squid. The lowest and highest δ15N values wereP.ramsayi(12.86‰) andG.blacodes(17.63‰) for fishes,R.bullisi(12.64‰ and 14.44‰)for skates andI.argenitna(8.58‰ and 12.61‰).
Except forS.brasiliensis(ANOVA,F=8.416,P=0.020<0.05), there were no significant linearrelationships between δ13C value and the length of fi sh and squid species (Table 2). However, more linear relationships can be found on δ15N and the length of fi sh species, includingC.peruvianusand two skates(R.cyclophoraandR.bullisi) (Table 3).
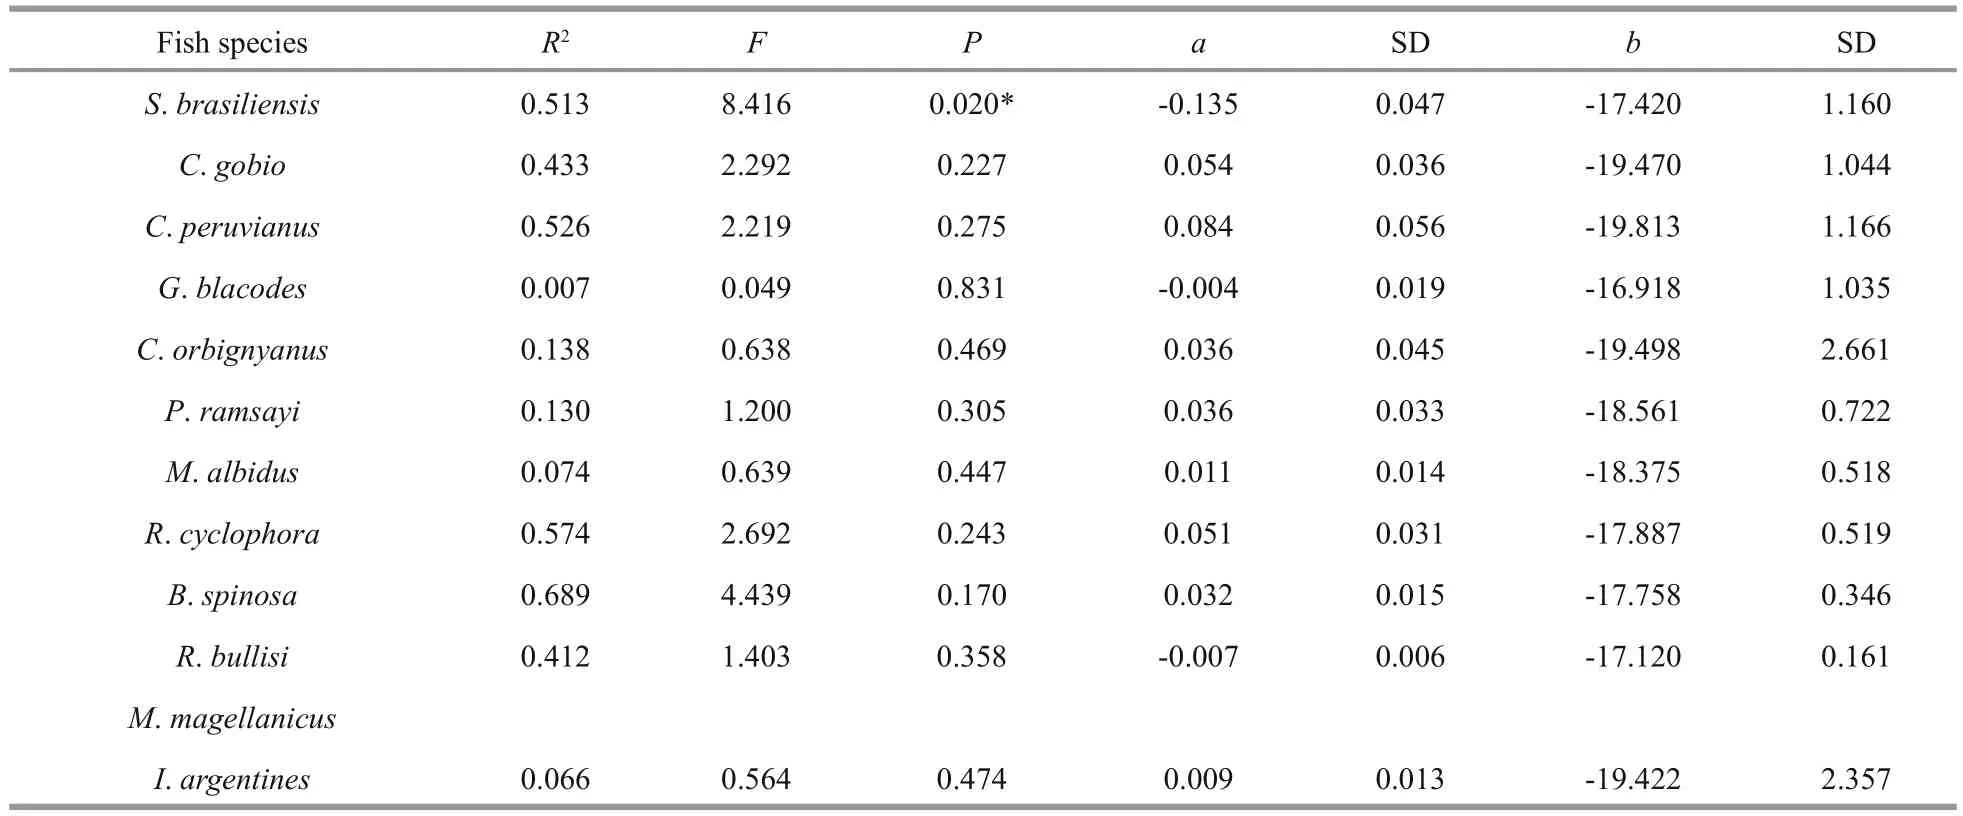
Table 2 The linear relationship between δ13C and length of fi sh and squid species
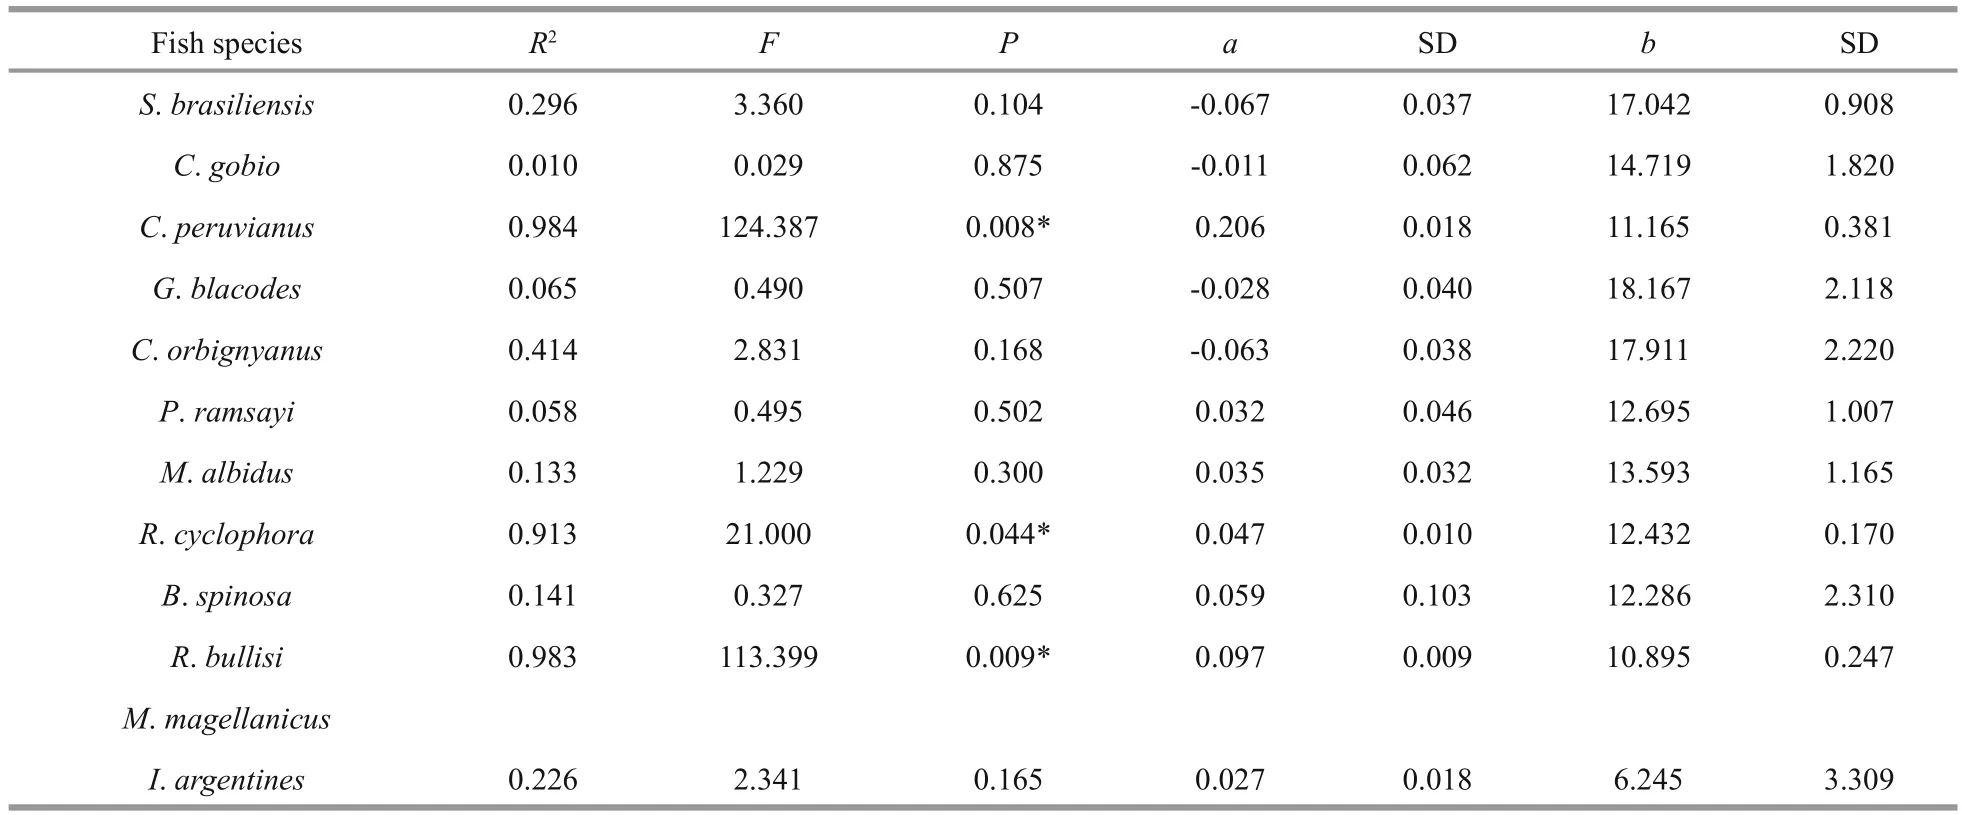
Table 3 The linear relationship between δ15N and length of fi sh species
The stress value for this nMDS plot is 0.01,meaning that the plot provides a useful representation of the variation in fi sh species and squid (Fig.3).P.ramsayi,M.magellanicusand skates (R.cyclophora,B.spinosaandR.bullisi) can be divided into a group.C.gobio,C.peruvianus,C.orbignyanusandM.albiduswas categorized as another group.S.brasiliensis,G.blacodesandI.argentinuswere significantly different from other species and separated from each other.
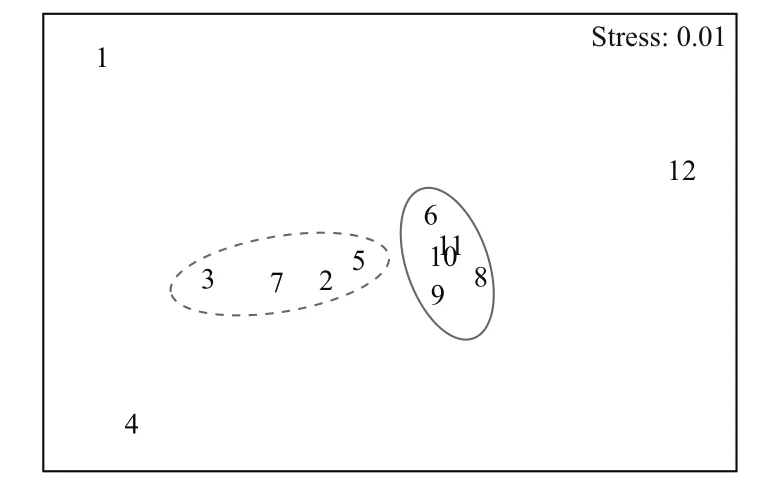
Fig.3 The non-metric multidimensional scaling ordination of marine fauna on the Patagonian shelf breakThe circles denote groups of statistically different marine fauna.1:Stromateus brasiliensis; 2:Cottoperca gobio; 3:Congiopodusperuvianus; 4:Genypterus blacodes; 5:Conger orbignyanus;6:Patagonotothen ramsayi; 7:Merluccius albidus; 8:Rajacyclophora; 9:Breviraja spinosa; 10:Raja bullisi; 11:Macruronusmagellanicus; 12:Illex argentines.

Fig.4 Mean values of δ13C value and δ15N values (±SD) for fi sh and squid fauna on the Patagonian shelf break
The mean C-isotope signatures varied (Kruskal-WallisH3,78=17.63,P=0.001<0.05) for the four trophic guilds. The guild-average δ13C value was less enriched for the benthopelagic guild than for other three guilds, which presented very similar average δ13C values (Fig.4). For the benthopelagic guild,P.ramsayiandM.magellanicusshared similar δ13C values, butS.brasiliensishad a significant lower δ13C value and lowered the average δ13C value of this guild.
A similar significant difference was also found for the stable N-isotope signatures of the four guilds(Kruskal-WallisH3,78=28.95,P<0.001). The average δ15N value of the pelagic guild (I.argentinus) was remarkable lower than those of the other guilds,which showed very similar and more enriched δ15N values (Kruskal-WallisH2,68=4.10,P=0.13>0.05).The bathydemersal guild (G.blacodes,M.albidus,B.spinosa, andR.bullisi) had more enriched δ13C and δ15N values than those of the other guilds. Generally,δ15N values increased with the depth of the fi sh habitat from the surface (pelagic) to the bottom(bathydemersal).
4 DISCUSSION
Stable isotopic analysis was widely used to indicate the feeding habitat of aquatic animals (Fisk et al.,2002; Jackson et al., 2007; Park et al., 2011; Agersted et al., 2014) and has become a common approach to understand the food web structure and the trophic dynamics of different ecosystems (Post, 2002).However, information on diet composition or feeding habits of some fi sh species in the Atlantic Patagonian shelf region were still derived from gut content analysis (Santos and Haimovici, 1997; Mouat et al.,2001; Nyegaard et al., 2004). Diet composition ofI.argentinusandG.blacodespresented an ontogenetic variation (Mouat et al., 2001). RockcodPatagonotothenspp. andM.magellanicuswere key prey species ofG.blacodesaround the Falkland Islands, but spatial variability in the diet was found inG.blacodesbetween temperate and sub-Antarctic waters (Nyegaard et al., 2004). However, the stable isotope analysis did not support the ontogenetic diet shift in the above fi sh species, based on the relation between both isotopes and size. The spatial-temporal heterogeneity of diet composition and limited sample size may contribute to the difference.
The food web structure on the Patagonian shelf were examined by several studies. Because of the introduction of salmonids on the tip of South America in the past decades, Ciancio et al. (2008) examined the trophic relationships of exotic anadromous salmonids on the southern Patagonian shelfinferred from stable isotopes. Drago et al. (2009) revealed the stable isotope values of the food items from South American sea lion in Patagonia. Based on stable isotope analysis, Saporiti et al. (2015) compared the latitudinal changes (the temperature estuarine zone associated with the Río de la Plata plume, the tidal zone off northern and central Patagonia and the cold estuarine zone off southern Patagonia) in the marine food web structures in this region and found the food chain length (FCL) decreases and the trophic redundancy increases as latitude increases in all of the above three regions. The tidal zone off northern and central Patagonia (northern Patagonian region in Fig.5) has similar latitude range to the present study,but the region of the present study is located offshore and in the shelf break. significant differences can be found for mean C- and N-isotope values of the same species among the present study and the previous studies (Table 4). The δ15N value ofP.ramsayiin the Patagonian shelf break was lowest and the δ15N value ofP.ramsayiin the northern and central Patagonian shelf was significantly higher than those in the others regions (Fig.5). Similar lower δ15N values can be found for other fi sh and squid species in the shelf break, although the latitudinal changes on the δ15N values of those species has not occurred. significant lower δ15N values of species in present study area may be attributed to complex habitats, oceanographic dynamics and overlapping anthropogenic activities.Squid and fi nfish fi sheries were concentrated in this region in the past decades (Haimovici, 1998; Chen et al., 2008; Laptikhovsky et al., 2013). Humans were fi shing down the food web to lower trophic level by selectively removing large fi sh from the oceans (Pauly et al., 2000). This process has potentially contributed to the lower δ15N value in this ecosystem. However,data on the feeding ecology of commercial species,particularly fi nfish, in this region was scarce (Mouat et al., 2001). Therefore more fishery data needed to provide a possible explanation. The δ13C values for most of species were concentrated from -18‰ to-17‰. However, the δ13C values of some species (for example,G.blacodesandP.ramsayi) in the northern and central Patagonian region were significantly higher than other species. The δ13C value of species in the southern Patagonian shelf were higher than those in other regions (Fig.5). Particularly, the δ13C values ofS.brasiliensiswas significantly lower than other species in the present study, the possible reason could be its residence in shallower and less salty waters which flowed from Argentina or Falkland waters(Fig.6). Using the ratio of δ13C/δ15N of species (four species,P.ramsayi,G.blacodes,M.MagellanicusandI.argentinuswere involved) as an indicator of food web structure. A significant difference can be found between the Patagonian shelf break (the present study) and the northern and central Patagonian region(Saporiti et al., 2015) (pairedt-test,t=4.30,P=0.04<0.05) (Fig.5). Lowest mean N-isotope values of species occurred in the Patagonian shelf break.Spatial-temporal heterogeneity of those studies can provide potential explanations for these differences.One of reasons is the possible annual or seasonally variability in stable isotope ratios, as the samples used by Ciancio et al. (2008) and Saporiti et al. (2015)were collected from 2001 to 2005 and from October 2009 to December 2011, respectively. However, the samples collected for the present study were collected from December 2014 to May 2015. The second reason is that the samples collected by Ciancio et al. (2008)were from the southern Patagonian shelf regions between the coastal frontal area and the shelf break and by Saporiti et al. (2015) from the coastal frontal area of northern or southern Patagonian shelf.However the samples in the present study were from shelf break between the regions B and C of Saporiti et al. (2015). significant differences in the mean N-isotope values ofI.argentines(pelagic species),P.ramsayi(benthopelagic species) andG.blacodes(bathydemersal species) between Ciancio et al. (2008)and Saporiti et al. (2015) in a similar region also supported the temporal heterogeneity of the ecosystem.

Fig.5 Comparison of mean C- and N-isotope values of selected fi sh species and squid in the different regions of the Patagonian ecosystema. Patagonian shelf break (the present study);b. southern Patagonian shelf (Ciancio et al., 2008);c. southern Patagonian region (Saporiti et al., 2015);d. northern and central Patagonian region (Saporiti et al., 2015);e. southern Patagonian region (Drago et al., 2009).
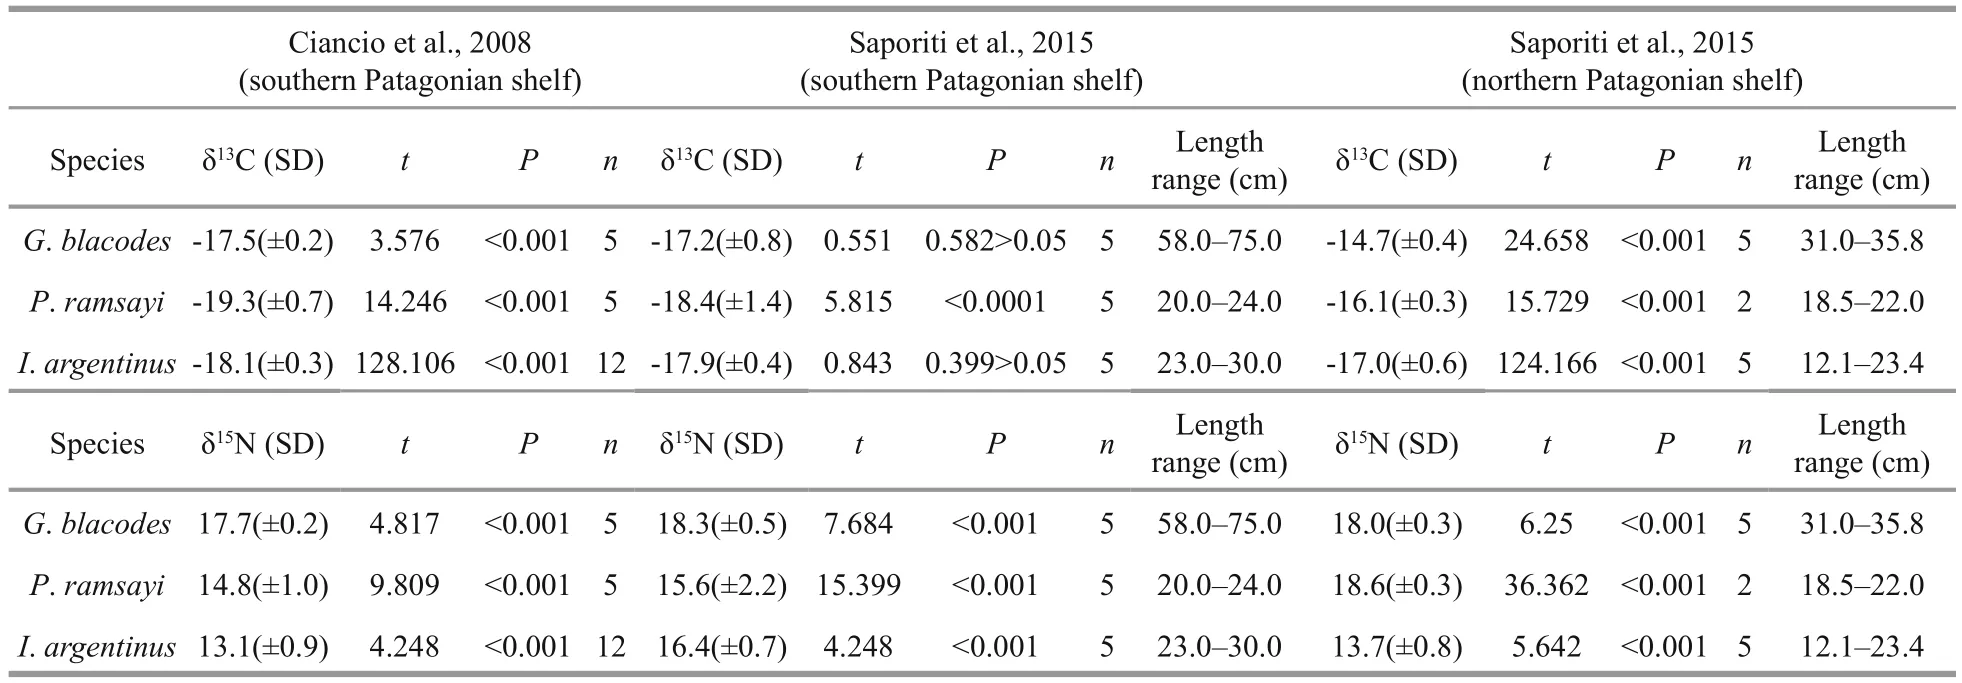
Table 4 Comparison on stable C- and N-isotope values of selected fi sh species and squid in the Patagonian regions between the present study and previous studies

Fig.6 The study area with the distribution of stable carbon and nitrogen isotopic values for the combined species and a schematic illustrating the main oceanographic featuresPartly reproduced from Arkhipkin et al. (2013).
Complex frontal regime in this region can provide another explanation. The Patagonian shelf has a complicated hydrographic structure, with a permanent front over the shelf break and coastal frontal regions(Acha et al., 2004). This results in the different ecosystem structures in the above habitats. Ciancio et al. (2008) collected most of the secondary consumer samples from the shelf region between the coastal frontal area and the shelf break. The samples of Saporiti et al. (2015) were collected within the coastal frontal regions where are characterized by intense vertical mixing of the water column (Acha et al.,2004) and hence a region with higher δ15N values(Calvert et al., 1992; Wu et al., 1997; Waser et al.,2000). This can explain why the δ15N values of samples from Saporiti et al. (2015) were higher than those from Ciancio et al. (2008) and the present study.Furthermore, the FCL in the Patagonian shelf break(FCL=2.16 betweenG.blacodesandI.argentinus,the present study) was longer than those in the southern Patagonian shelf (FCL=1.4, Ciancio et al.,2008), meaning poleward food web shortening was noted (Saporiti et al., 2015). Compared with the δ15N values in the northern and central Patagonia, the lower δ15N values presented in this study area also support this argument. Fishing activities, which has modified the abundance of many species and their diets (Drago et al., 2009; Ramírez et al., 2014; Zenteno et al., 2015)have also modified fatherly food web structures in the exploited regions, particularly in the Patagonian shelf break where heavy commercial squid fishery has occurred in the past decades (Laptikhovsky et al.,2013).
Oceanographic structures, such as fronts, are discontinuities in the marine environment which inf l uence the ecology of marine organisms (Leichter and Witman, 2009) and the distributional pattern of marine organisms at all trophic levels (Alemany et al.,2014). At upper trophic levels, particularly fi sh and squids, behavioral sensory cues (i.e., temperature,salinity, optical conditions, and trace substances) are involved in actively seek out frontal structures for reproduction, feeding and migration (Olson, 2002).Frontal systems are characterized by high primary and secondary production (Mann and Lazier, 2006)that is transferred to higher trophic levels within the regional food web. The Shelf-break front (SBF,Alemany et al., 2014) and the Eastern Falkland current (EFC, Arkhipkin et al., 2013) cross the present study area (Fig.6). Argentine drift also reaches the present study area. Similarly, the Southern Patagonia front (SPF) and Argentine drift have an impact on the study areas of Ciancio et al. (2008) and Saporiti et al.(2015). However, the impact of those fronts had different effects on those study areas and further affected trophic levels of the above food web structures.
With the unavailability of stable isotope data of primary producers, the trophic level of the Patagonian shelf break cannot be structured directly. However,there was a clear separation of resources between demersal-benthic and pelagic species of some fi sh species (Fig.4 and Fig.5). Moreover, the present study indicates the Patagonian shelf break can be considered as a separated ecosystem structure with lower δ15N values.
5 ACKNOWLEDGMENT
We would like to thank the fi sheries observers,crew and the offcers of the trawlerLongfa, LIU Zijun,CHEN Lvfen, WANG Rui, SONG Qi and REN Zeqian at the College of Marine Sciences, Shanghai Ocean University for their helps in processing the samples. We acknowledge Mr Alan Coughtrey of the Shanghai Ocean University for his help in polishing the language. Finally, we would also like to thank two anonymous reviewers for their contributions to improve this manuscript.
 Journal of Oceanology and Limnology2018年3期
- Journal of Oceanology and Limnology的其它文章
- Response of the North Pacific Oscillation to global warming in the models of the Intergovernmental Panel on Climate Change Fourth Assessment Report*
- Effect of mesoscale wind stress-SST coupling on the Kuroshio extension jet*
- Surface diurnal warming in the East China Sea derived from satellite remote sensing*
- Cross-shelf transport induced by coastal trapped waves along the coast of East China Sea*
- Observations of near-inertial waves induced by parametric subharmonic instability*
- Seasonal variation and modal content ofinternal tides in the northern South China Sea*
