Correlations between ultrasonic pulse wave velocities and rock properties of quartz-mica schist
Bharti Chawre
Central Soil and Materials Research Station,New Delhi,110016,India
1.Introduction
In rock mechanics,ultrasonic pulse wave velocity tests are becoming very popular due to their non-destructive nature,high precision and low cost.Three types of sonic velocity methods are available:ultrasonic technique,low frequency sonic wave technique and frequency resonant technique(Soroush and Qutob,2011).Among these methods,the ultrasonic technique is the most convenient to be used in rock mechanics.In this technique,transition time of a traveling elastic pulse wave is measured between two points in a core plug,and thus the compressional and shear waves(P-andS-wave)velocities can be calculated.This technique is frequently employed to investigate certain properties of rocks.
There are a number of factors that influence the ultrasonic pulse wave velocity of rocks,e.g.density,rock type,shape and grain size,porosity,anisotropy,pore water,confining pressure,temperature,and rock mass properties.In addition,weathering,alteration zone,bedding planes and joint properties( filling materials,roughness,water,dip and strike,etc.)also influence the sound velocity(Fener,2011).
The relationships between P-wave velocity and other rock properties have been investigated by various researchers.The transition time of the waves depends on the density of minerals forming the rocks(Birch,1961).The relationship between the wave velocity and the density of rocks is usually considered to be linear(Youash,1970).Relationships between compressional and shear wave velocities in elastic silicate rocks have been studied by Castagna et al.(1985).They concluded that the shear wave velocity is linearly related to the compressional wave velocity for both water saturated and dry elastic silicate sedimentary rocks.The wave velocity also depends on the porosity(void proportion and pore size distribution),and the possible anisotropic arrangement of the particles forming the material(Gaviglio,1989).Study of measurements of ultrasonic wave velocity in volcanic rocks and its correlation with micro-texture was carried out by Vanorio et al.(2002).The relation between the uniaxial compressive strength(UCS)and the laboratory P-wave velocity of sandstones was analyzed by Chary et al.(2006),and a good correlation was found between the UCS and P-wave velocity.Fener(2011)studied the effect of rock sample dimension on the P-wave velocity.Rodríguez-Sastre and Calleja(2006)calculated the elastic modulus of slates from ultrasonic wave velocity measurements.Results of the study showed a good linear correlation between the increase in the inclination angle of the foliation and the dynamic elastic constants,but this was less marked for Poisson’s ratio(μ).Good correlations between P-wave velocity,porosity and density were found by Rahmouni et al.(2013).Khandelwal(2013)investigated the relationships between different physico-mechanical properties of various rock types and the P-wave velocity.He concluded that the empirical equations are practical,simple,and accurate enough to be used in general practice to obtain important static physico-mechanical properties of different rocks for the design and planning of excavation with greater safety and stability.Effect of core size on the ultrasonic pulse wave velocities of dry and saturated limestone samples was studied by Ercikdi et al.(2016).It shows that the ultrasonic pulse wave velocities of limestone samples change with increasing sample size,and the dry samples produce consistently 1.03-1.46 times higher ultrasonic pulse wave velocities than the saturated samples at greater sample lengths(75 mm,100 mm and 125 mm).Wang et al.(2016)studied the correlation between the dynamic and static elastic parameters of rock.They found that the dynamic Young’s modulus was greater than the static one under the same condition,and a linear correlation was found between the static and dynamic Young’s moduli.Nourani et al.(2017)studied the classification and assessment of rock mass parameters in Choghart iron mine using P-wave velocity.The results showed that the rock mass rating(RMR)andQvalues have a close relation with P-wave velocity parameters,including P-wave velocity in field(VPF),and P-wave velocity in laboratory(VPL).
The relationships between the P-wave velocity and rock density and modulus of elasticity have been extensively investigated.It was reported that the rock density increases as the velocity increases,and an exponential relation exists between the density and the elastic parameters.It was also noticed in some of the previous studies that the rocks have all been subjected to the same statistical analysis,regardless of the differences in their geological origins.
The present study aims to understand the correlations between elastic wave velocities and some of the physico-mechanical properties of quartz-mica schist(QMS)metamorphic rocks only.Moreover,attempt has been made to estimate the static elastic constants of the rocks fromthe dynamic elastic constants measured with the ultrasonic technique.The main objective is to investigate the possibility of replacing the ordinary destructive tests(such as UCS)with non-destructive methods to determine the physicomechanical properties of rocks.
First,the relationships between the pulse waves(P-and S-wave)velocities and the physico-mechanical properties of QMS rock are investigated using the simple regression analysis.All the data are then subjected to multiple regression analysis.Some empirical equations with high correlation coefficients are derived and the results are also compared to the values obtained from the empirical equations given by other authors.
2.Sampling of data and methods
Thirteen QMS rock samples of 54 mm in diameter,collected from a project at Himachal Pradesh,India,are used in this study.The relationships between P-and S-wave velocities and rock density,porosity,UCS,and static and dynamic moduli of elasticity are investigated.All these tests are carried out in accordance with the International Society for Rock Mechanics(ISRM)suggested methods(Bieniawski and Bernede,1979).
2.1.Test procedures
2.1.1.Identification of water-related properties
(1)Bulk density(dry/saturated),water content(saturated)and apparent porosity
Representative samples of rock blocks,weighing approximately 5-15 g,are selected.The minimum size of each block is such that its minimum dimension is at least ten times the maximum grain size.Each block produces at least two samples.Each sample is brushed to remove loose material.The samples are placed in a container,dried in oven to a constant mass at temperature of 105°C,and then cooled for 30 min in desiccators.Subsequently,the mass(A)of the oven-dried sample is determined,and the bulk volume(V)of the sample is measured using the mercury-displacement method.The mercury adhering to the sample is carefully removed,ensuring that no fragments are lost.
A special saturation chamber is used to saturate the samples,in which the samples are kept immersed in water and vacuum is applied for a period of 6 h.Then the mass(B)of the saturated samples is determined.The above steps are repeated for each sample,and the properties are computed as follows:

where ρdryand ρsatare the densities of dry and saturated samples,respectively;wsatis the water content at saturation;andηais the apparent porosity.
(2)Grain density
The mass(C)of a clean dry specific gravity(grain density)bottle plus stopper is determined.The bottle is filled with kerosene oil(which is non-reactive with the rock)and is brought to equilibrium temperature in a constant temperature bath,and the liquid level is adjusted accurately to 50 mL mark.Then the specific gravity bottle is removed from the constant temperature bath,the stopper is replaced and its mass(D)is determined.The specific gravity bottle is emptied and dried.
The samples of a given rock block,weighing 30-50 g,are crushed together,and ground to a grain size not exceeding 150μm,and then oven-dried.Two representative samples with each of the pulverised material of about 15 g are selected and added to separate the bottle with the aid of a funnel(in other words,each sample is testedin duplicate).The mass(E)of the “bottle+sample+stopper”is determined.
Sufficient kerosene oil is added to the bottle containing the sample to fill 3/4 of the bottle and thoroughly wet the sample.The specific gravity bottle is then placed in the constant temperature water bath and slowly boiled to remove the air adhering to the particles.Then the bottle is removed from the water bath and cooled,and the kerosene oil is added to adjust the liquid level to 50 mL mark.The mass(M)is determined.
The above steps are repeated for each pulverised sample.The grain density(in g/cm3)is computed as follows:

where 0.8 g/cm3is the density of kerosene oil.
2.1.2.Wave velocity(compressional and shear,both in dry and saturated states)
The ultrasonic pulse wave method is used to determine P-wave(primary/compressional/longitudinal wave)and S-wave(secondary/shear/transverse wave)velocities.All the rock samples tested are of effectively infinite extent compared to the wavelength of the pulse,because the average grain size is less than the wavelength of the pulse,which is also less than the minimum dimension of samples.Other requirements,such as the lateral minimum dimension to be not less than 10(less than 5(ASTM D2845-08,2008))times the wavelength,and the travel distance of the pulse through the rock to be at least 10 times the average grain size,are also satisfied.
The sample is placed in physical contact between two piezoelectric transducers-one acting as the transmitter and another as the receiver-using suitable contact medium.Forthe transmission/reception of P-wave,a thin film of grease is used for coupling of the transducer elements to the end planes of the sample,whereas for S-wave transmission,hard coupling is obtained.The frequencies of P-and S-wave transducers are 200 kHz and 33 kHz,respectively.A pulse generator in the equipment supplies a short-duration electrical pulse to the driver transducer and this wave is transmitted to the sample.After traveling through the length of the sample,the pulse is picked up by the receiving transducer,converted into the electrical signal and displayed on the screen of a cathode-ray oscilloscope.To measure the travel time,the oscilloscope is used,with the time delay circuit,to display both the direct pulse and the first arrival of the transmitted pulse.The zero time of the circuit,including both transducers(i.e.transmitter and receiver)and the travel time measuring device,is determined and the correction to the measured travel time is applied.The velocities of either P-or S-wave are calculated as follows:

whereVPis the P-wave velocity(km/s),VSis the S-wave velocity(km/s),Sis the distance traveled by the wave(mm),andtis the travel time(μs).
2.1.3.Strength and deformability(in uniaxial compression)
After evaluating the wave velocity(compressional and shear)of rock samples(with length to diameter ratio of 2.5),the UCS of samples was evaluated,along with its deformability characteristics(modulus of elasticity and Poisson’s ratio).
The longitudinal and lateral strains of the sample are measured with the help of electrical resistance strain gages.Two vertical and two circumferential strain gages are pasted at the middle of the sample.The strain gages are connected to the Wheatstone bridge circuit of the multi-point measuring unit to find out the change in resistance and consequently the change in strain.
The rock samples are axially loaded-until failure-between the platens of a universal testing machine.The stress value at failure is given by

whereσcis the UCS(MPa),Pis the applied force at failure(N),andAsis the initial cross-sectional area of sample(mm2).
However,for assessment of deformability characteristics,the samples are not loaded up to failure in the first instance because the samples exhibit certain permanent or irrecoverable strain.Hence,the samples are first loaded up to half the anticipated UCS,and then unloaded(to the value of seating load,so that the samples do not get disturbed,and the permanent set is known).In the second cycle,the samples are loaded up to the anticipated failure load.In case the samples do not fail,they are unloaded again.In the third cycle,the samples are loaded up to failure.
While loading and unloading,the strain readings(vertical and circumferential)are recorded at definite intervals,so as to trace the strain-stress plot for the given saturated samples.The plots of longitudinal strain-UCS and lateral strain-UCS are used to evaluate the tangent modulus(at 50%of the ultimate UCS)and the corresponding Poisson’s ratio.
2.2.Dynamic elastic properties
The conventional method for determining the elastic modulus of intact rock is to perform unconfined compression tests on pieces of rock cores obtained from drilling using a diamond core barrel(Bieniawski and Bernede,1979).Since standard sample preparation is time consuming and expensive,indirect tests are also often conducted to estimate the elastic modulus using empirical correlations.The propagation velocity of elastic waves measured on intact rock is usually used to calculate the dynamic elastic properties(Zhang,2005):

2.3.Ranges of dataset
The 13 rock samples were tested to determineVP,VS,porosity,dry and saturated densities,UCS and static modulus of elasticity.The accuracy of the experiments was ensured by replicating the tests of the same rock samples.The maximum variation in different rock properties while replicating the test was found to be less than 10%and therefore the test results were considered to be reliable within reasonable experimental errors.It was found thatVPvaried from 2.06 km/s to 3.91 km/s and from 3.09 km/s to 5.02 km/s for dry and saturated rock samples,respectively.VSvaried from 1.43 km/s to 3.29 km/s and from 1.47 km/s to 3.73 km/s for dry and saturated rock samples,respectively.The porosity varied from 1.09 to 1.76 and the UCS varied from 13.5 MPa to 28.02 MPa for dry and saturated rock samples,respectively.The dry density varied from 2620 kg/m3to 2770 kg/m3,and the saturated density varied from 2640 kg/m3to 2800 kg/m3.The static modulus of elasticity varied from 10 GPa to 36.9 GPa.
3.Results and discussion
The majority of equations yield linear relationship between pulse wave(P-and S-wave)velocities and porosity and density,but the relation between the wave velocities and the UCS can be linear or power.Similarly,the static modulus of elasticityEsand the dynamic modulus of elasticityEdreveal an exponential relationship.In this study,linear relationship was found between pulse wave velocities and other properties of QMS rocks.
3.1.Simple regression analysis
The dataset was analyzed using the least squares linear regression analysis and the correlation coefficient(R2)was determined for each regression.
3.1.1.Physical properties(porosity and density)versus P-and S-wave velocities
In order to describe the relationship between the pulse wave(P-and S-wave)velocities and the porosity and dry and saturated densities of the tested rock samples,regression analyses were carried out.The values of P-wave velocity(VP)and S-wave velocity(VS)of rock samples were correlated with the porosity(η).The plots ofVP-η andVS-η are shown in Figs.1 and 2,respectively.
Linear relations between P-and S-wave velocities and the porosity of QMS metamorphic rocks were found.Equations for these relations are given below:

whereVP-dryandVS-dryare the P-and S-wave velocities in dry state,respectively;andηis the porosity.
The plots of P-wave velocity(VP)and S-wave velocity(VS)as a function of density(ρ)are shown in Figs.3-6 for dry and saturated rock samples.Both of theVP-ρandVS-ρplots show a linear relation.The equations and correlation coefficients for these relations are as follows:

whereVP-satandVS-satare the P-and S-wave velocities in saturated state,respectively;and ρdryand ρsatare the densities in dry and saturated states,respectively.
3.1.2.UCS versus P-and S-wave velocities
The relationships between the UCS(σc)and the pulse wave(P-and S-wave)velocities for QMS rock samples are plotted in Figs.7 and 8,respectively.It is shown that the UCS increases linearly with the increase in the P-and S-wave velocities.The empirical relations betweenσcandVPandVSare given below:


Fig.1.P-wave velocity versus porosity of dry rock samples.

Fig.2.S-wave velocity versus porosity of dry rock samples.

Fig.3.P-wave velocity versus density of dry rock samples.
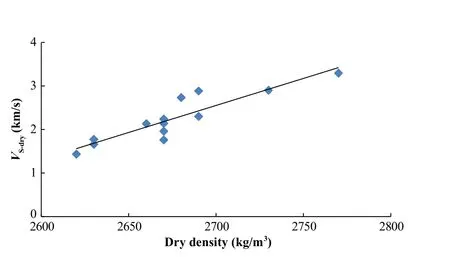
Fig.4.S-wave velocity versus density of dry rock samples.

Fig.5.P-wave velocity versus density of saturated rock samples.


Fig.6.S-wave velocity versus density of saturated rock samples.

Fig.7.P-wave velocity versus UCS of rock samples.

Fig.8.S-wave velocity versus UCS of rock samples.
3.1.3.Correlation between dynamic modulus of elasticity(Ed)and static modulus of elasticity(Es)
The static modulus of elasticity(Es)is determined from laboratory experiments on core samples.It is an expensive and timeconsuming approach,as intensive care is required for sample preparation,handling and testing.The dynamic modulus of elasticity of rock samples can be calculated easily by Eq.(8)using the elastic wave velocities(VPandVS).A graph of static versus dynamic modulus of elasticity is plotted in Fig.9.This figure reveals a linear relation betweenEsandEdwithR2=0.91:

3.1.4.Static modulus of elasticity versus P-and S-wave velocities
The relations between the static modulus of elasticity(Es)and the pulse wave(P-and S-wave)velocities for QMS rock samples are plotted in Figs.10 and 11,respectively.It is shown that the static modulus of elasticity increases linearly with the P-and S-wave velocities.The empirical relations betweenEsandVPandVSare given below:

3.2.Multiple regression analysis
Multiple linear regression analysis correlating the P-and S-wave velocities with the physico-mechanical properties of rocks was also carried out using Microsoft Of fice Excel statistical tools and functions.The equations derived to estimate the UCS,porosity,and density of the QMS rock are given below:
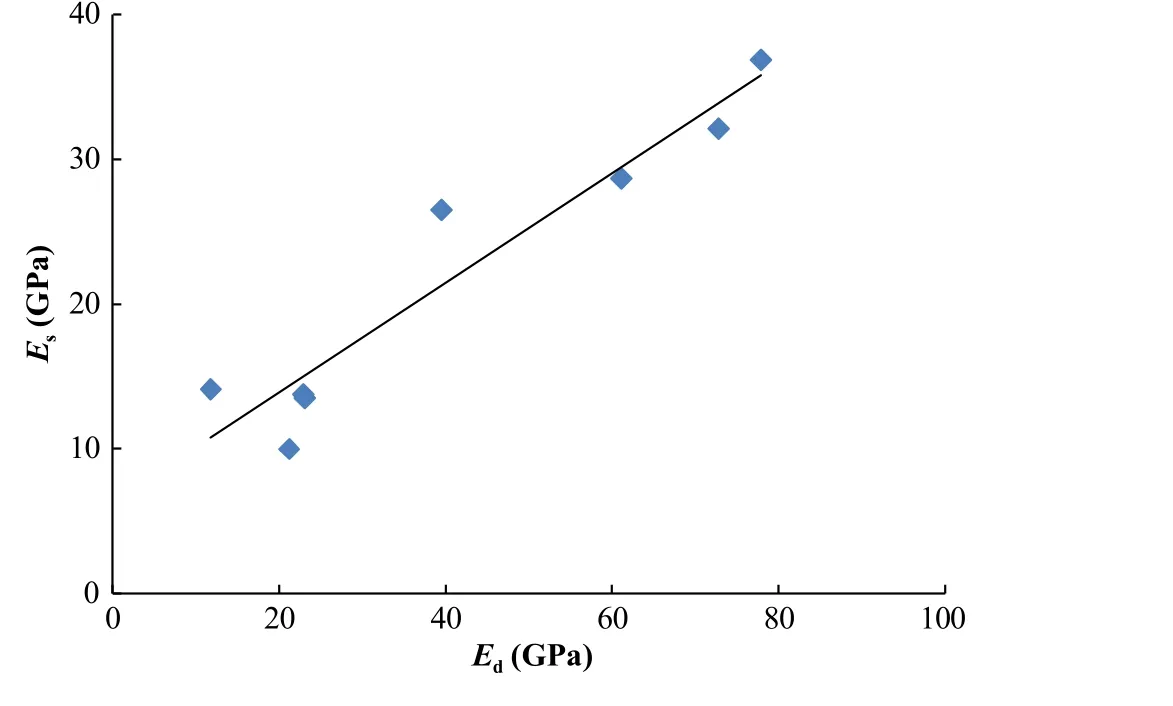
Fig.9.Static versus dynamic modulus of elasticity for saturated rock samples.
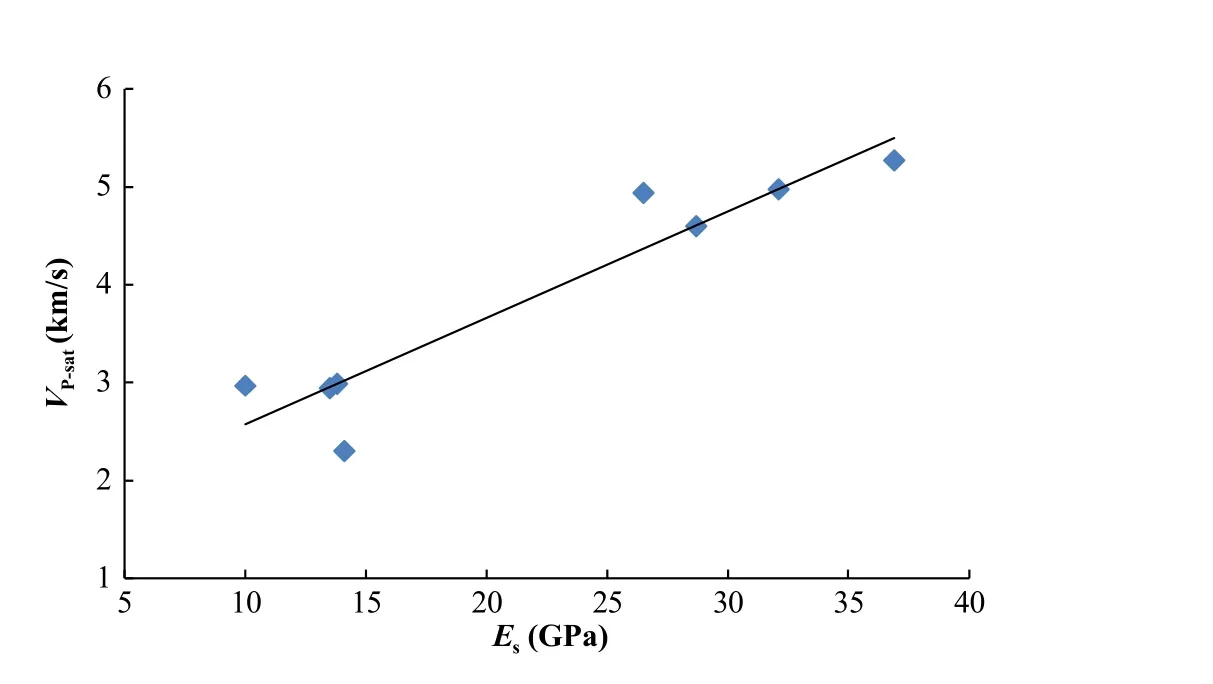
Fig.10.P-wave velocity versus static modulus of elasticity for saturated rock samples.

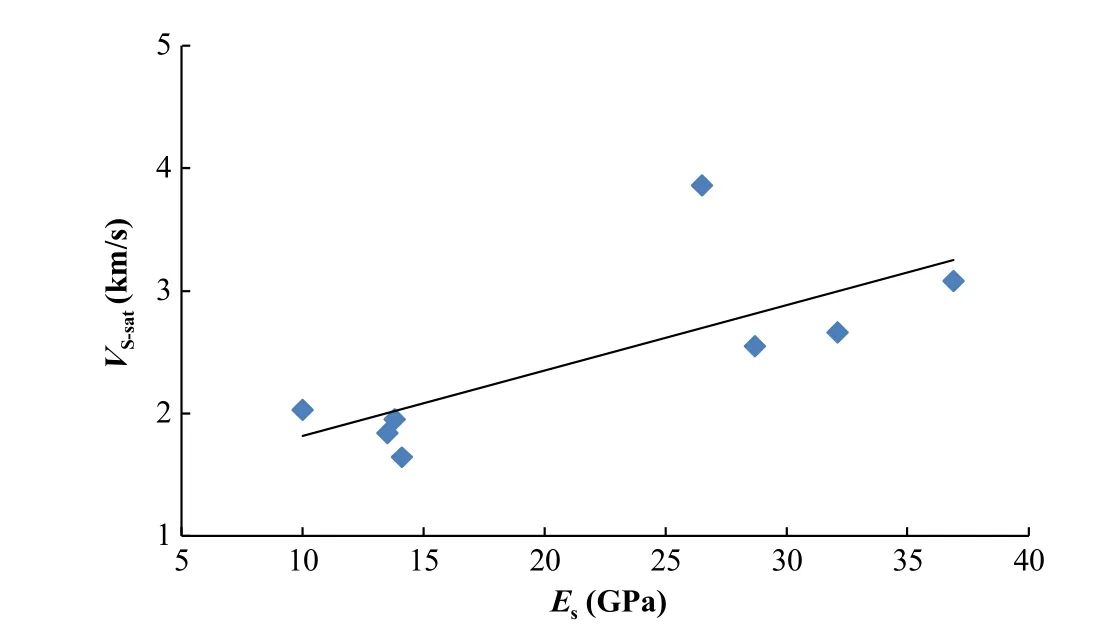
Fig.11.S-wave velocity versus static modulus of elasticity for saturated rock samples.
The relationships between the measured and predicted values are shown in Figs.12-14.The multiple regression models to predict the UCS,porosity,density and dynamic modulus of elasticity are summarized in Tables 1-7.
It may be noted from Table 2 that the UCS shows a strong correlation with P-wave velocity as the correspondingp-value is much less than 0.05 but thep-value for S-wave velocity is high.Therefore,Eq.(15)correlating the UCS only with the P-wave velocity also corresponds to the best fitting equation for obtaining the UCS from the P-wave velocity.
Similar analysis was carried out for further analysis.It was found thatVPandVSwere better parameters in a multiple regression analysis to correlate the rock properties.Therefore,VPandVSare considered in further multiple regression analysis.
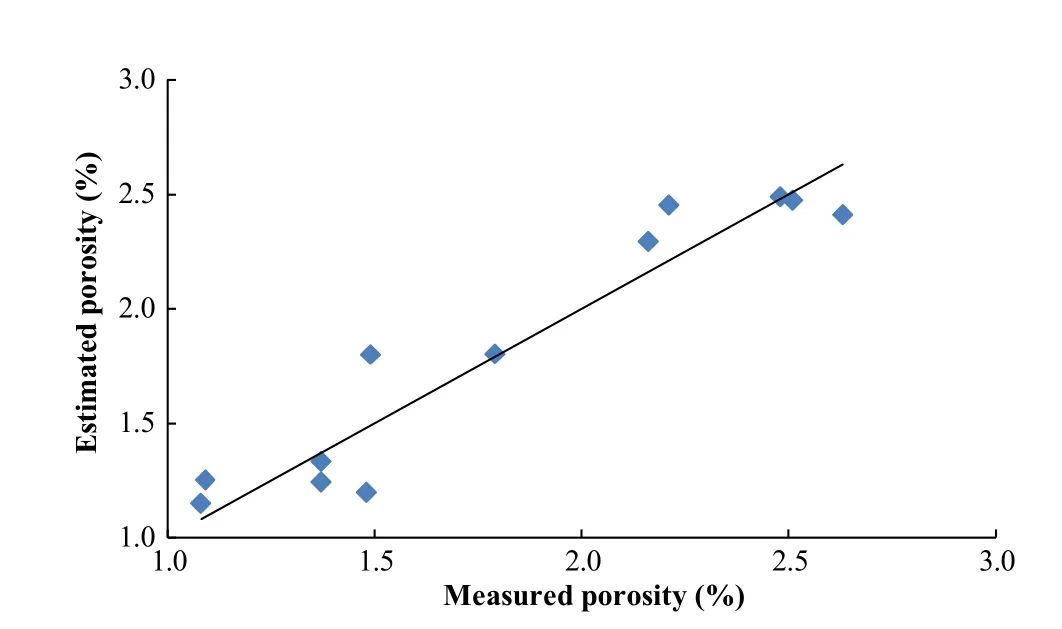
Fig.12.Estimated porosity and measured porosity from P-wave velocity in dry state.
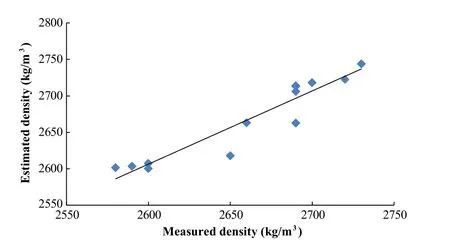
Fig.13.Estimated density and measured density from P-wave velocity in dry state.

Fig.14.Estimated UCS and measured UCS from P-wave velocity for saturated state.

Table 1Multiple regression model for the primary prediction of UCS.

Table 2Multiple regression model for the further prediction of UCS.

Table 3Multiple regression model for the prediction of porosity.

Table 4Multiple regression model for the prediction of dry density.

Table 5Multiple regression model for the prediction of saturated density.

Table 6Multiple regression model for the prediction of static modulus of elasticity.

Table 7Multiple regression model for the further prediction of static modulus of elasticity.
UCS value was first correlated with the P-and S-wave velocities,porosity and dry density in a multiple regression analysis to derive a better relation between UCS and the other rock properties.The results are shown in Table 1.It may be noted that the UCS was not well correlated with the porosity and dry density as most of thepvalues for these parameters were much greater than 0.05.Therefore,the porosity and density were dropped in further multiple regression analysis to obtain a better fitting equation and the results are shown in Table 2.
It can be observed from thep-values obtained from the multiple regression analysis(Tables 3-5)that the porosity is more strongly related withVS,the dry density withVP,and the saturated density withVS.Therefore,the corresponding equations of the linear analysiscan also be taken as the best fitting equations for these rock properties in place of the equations obtained from the multiple regression analysis.
It can be seen from Table 6 that the static modulus of elasticity can be related toVP.However,the results of Table 7 indicate that the static modulus of elasticity can be related not only toVPbut also toVSandEdto obtain the best fitting equation as the order of magnitude ofp-values comes out to be similar for these parameters.
3.3.Comparison with other empirical equations
Khandelwal(2013)gave some empirical relationships to estimate physical properties of rock from P-wave velocities.He concluded that“These equations are practical,simple,and accurate enough to apply for the use in general practice to obtain important static physico-mechanical properties of the different rocks for the design and planning of excavation with greater safety and stability”.These relationships are given in Table 8 and are compared with the results of UCS and modulus of elasticity obtained in the present study,as shown in Tables 9 and 10,respectively.
Other researchers also studied the relation between P-wave velocity and UCS(Nourani et al.,2017)and the suggested empirical relationship is also shown in Table 8.The UCS values of the present study are also compared with those obtained by the empirical equation of Nourani et al.(2017)in Table 9.
Table 9 shows large relative errors in UCS values,ranging from 160%to 237%between the measured values and those determined by Khandelwal(2013),and from 23%to 1146%based on Nourani et al.(2017).The relative error is defined as follows:

However,the empirical relationship in the present study gives the relative error ranging between 3.2%and 14.5%.The UCS is an important parameter for the designing of structures on rocks and such large errors obtained from Khandelwal(2013)and Nourani et al.(2017)would be unacceptable.
Table 10 shows the large relative errors in the static modulus of elasticity ranging from 184%to 290%between the measured values and those determined by Khandelwal(2013).However,the empirical relationship of the present study gives the relative errors ranging between 1.9%and 6%.The modulus of elasticity of a rock is an important input parameter in any analysis of rock mass behavior that is related to deformations,and such large errors obtained from the empirical equation proposed by Khandelwal(2013)are unacceptable.
The empirical relationships,developed in the present study between wave velocities and physico-mechanical properties of QMS rocks are summarized in Table 11.
4.Conclusions
This study aimed to investigate some of the properties of QMS rocks in a cost-effective manner by establishing correlationsbetween elastic wave velocities and rock properties.The samples were collected from one of the project in Himachal Pradesh,India and testing was done on the core samples in the laboratory to determine their physico-mechanical properties.The following conclusions may be drawn on the basis of the present study:

Table 8Some empirical relationships from the previous studies.
(1)It was found from the previous studies that the physicomechanical properties of rocks have been correlated with P-wave velocity either in dry or saturated state.But in this study,it has been shown that the physico-mechanical properties maybe related with both P-and S-wave velocities.
(
2)The results of multiple regression analysis indicated that the dry density is more strongly related withVP;the porosityand saturated densityare strongly related withVS;the UCS can be related with eitherVPorVPandVS;and the static modulus of elasticity can be related with not onlyVP,but more strongly withVP,VSandEd.
(3)It has been seen in the previous studies(Table 8)that different types of rocks have all been subjected to the same statistical analysis,regardless of the differences in their geological origins.The results of the present study were also compared with those obtained from other empirical equations shown in Table 8.The comparison(from Tables 9 and 10)shows that the general equations encompassing all types of rocks do not give reliable results and show large relative errors(from 23.34%to 1145.82%).Such large errors are unacceptable and cannot be used for the design and planning purposes.It is suggested that the geological origins of rocks should be taken into account separately in statistical analysis when seeking for the relationships between the pulse wave velocity and other properties of rocks.In this way,more reliable predictions will be possible for project engineers and researchers.
(4)Although the author has also found a linear relationship betweenVPandVSand rock properties,but it was observed that these regression equations varied from project to project.Therefore,it would be more appropriate to validate these empirical equations at least on one rock sample from the project site before using them for the design and planning purposes.
More research is needed to identify additional parameters to deal with the data from different sources while suggesting general equations to correlate properties of different rocks.

Table 9Comparison of UCS results from Table 8 and the present study.

Table 10Comparison of modulus of elasticity results from Table 8 and the present study.

Table 11Summary of regression equations developed for QMS rocks.
Conflicts of interest
The author wishes to confirm that there are no known conflicts of interest associated with this publication and there has been no significant financial support for this work that could have influenced its outcome.
Acknowledgements
The author would like to thank Sh.Hasan Abdullah,Director of Central Soil and Materials Research Station,New Delhi,India,for giving valuable suggestions and encouragement for this study.
ASTM D2845-08.Standard test method for laboratory determination of pulse velocities and ultrasonic elastic constants of rock.West Conshohocken,USA:ASTM International;2008.
Bieniawski ZT,Bernede MJ.Suggested methods for determining the uniaxial compressive strength and deformability of rock materials:Part 1.Suggested method for determining deformability of rock materials in uniaxial compression.International Journal of Rock Mechanics and Mineral Sciences&Geomechanics Abstracts 1979;16(2):135-40.
Birch F.The velocity of compressional waves in rocks to 10 kilobars:2.Journal of Geophysical Research 1961;66(7):2199-224.
Castagna JP,Batzle ML,Eastwood RL.Relationships between compressional-wave and shear-wave velocities in elastic silicate rocks.Geophysics 1985;50(4):571-81.
Chary KB,Sarma LP,Prasanna Lakshmi KJ,Vijayakumar NA,Naga Lakshmi V,Rao MVMS.Evaluation of engineering properties of rock using ultrasonic pulse velocity and uniaxial compressive strength.In:Proceeding of the national seminar on non-destructive evaluation.Indian Society for Non-destructive Testing;2006.p.379-85.
Ercikdi B,Karaman K,Cihangir F,Yılmaz T,Aliyazıcıoˇglu S¸,Kesimal A.Core size effect on the dry and saturated ultrasonic pulse velocity of limestone samples.Ultrasonics 2016;72:143-9.
Fener M.The effect of rock sample dimension on the P-wave velocity.Journal of Nondestructive Evaluation 2011;30(2):99-105.
Gaviglio P.Longitudinal waves propagation in a limestone:the relationship between velocity and density.Rock Mechanics and Rock Engineering 1989;22(4):299-306.
Khandelwal M.Correlating P-wave velocity with the physico-mechanical properties of different rocks.Pure and Applied Geophysics 2013;170(4):507-14.
Nourani MH,Moghadder TM,Safari M.Classification and assessment of rock mass parameters in Choghart iron mine using P-wave velocity.Journal of Rock Mechanics and Geotechnical Engineering 2017;9(2):318-28.
Rahmouni A,Boulanouar A,Boukalouch M,Géraud Y,Samaouali A,Harna fiM,Sebbani J.Prediction of porosity and density of calcarenite rocks from P-wave velocity measurements.International Journal of Geosciences 2013;4(9):1292-9.
Rodríguez-Sastre MA,Calleja L.The determination of elastic modulus of slates from ultrasonic velocity measurements.In:Proceedings of the 10th congress of the International Association for Engineering Geology and the Environment(IAEG).The Geological Society of London;2006.Paper No.775.
Soroush H,Qutob H.Evaluation of rock properties using ultrasonic pulse technique and correlating static to dynamic elastic constants.In:Proceedings of the 2nd South Asian Geoscience Conference and Exhibition(GEOIndia2011).New Delhi,India;2011.
Vanorio T,Prasad M,Patella D,Nur A.Ultrasonic velocity measurements in volcanic rocks:correlation with micro-texture.Geophysical Journal International 2002;149(1):22-36.
Wang F,Bian H,Yu J,Zhang Y.Correlation of dynamic and static parameters of rock.Electronic Journal of Geotechnical Engineering 2016;21(4):1551-60.
Youash Y.Dynamic physical properties of rocks:Part 2.Experimental result.In:Proceedings of the 2nd Congress of the International Society for Rock Mechanics.Beograd;1970.p.185-95.
Zhang L.Engineering properties of rocks.Oxford:Elsevier;2005.
 Journal of Rock Mechanics and Geotechnical Engineering2018年3期
- Journal of Rock Mechanics and Geotechnical Engineering的其它文章
- Numerical simulation of the behaviors of test square for prehistoric earthen sites during archaeological excavation
- Velocity of detonation measurement and fragmentation analysis to evaluate blasting efficacy
- Geostructural stability assessment of cave using rock surface discontinuity extracted from terrestrial laser scanning point cloud
- Optimization of dewatering schemes for a deep foundation pit near the Yangtze River,China
- Discussion on“Empirical methods for determining shaft bearing capacity of semi-deep foundations socketed in rocks”[J Rock Mech Geotech Eng 6(2017)1140-151]
- Reply to Discussion on“Empirical methods for determining shaft bearing capacity of semi-deep foundations socketed in rocks”
