Numerical simulation of the behaviors of test square for prehistoric earthen sites during archaeological excavation
Xudong Wang,Zongren Yu,Jingke Zhang,Qinglin Guo,Shanlong Yang,Manli Sun
aKey Laboratory of Mechanics on Environment and Disaster in Western China,School of Civil Engineering and Mechanics,Lanzhou University,Lanzhou,730000,China
bNational Research Center for Conservation of Ancient Wall Paintings and Earthen Sites,Dunhuang Academy,Dunhuang,73620,China
c School of Cultural Heritage,Northwest University,Xi’an,710069,China
1.Introduction
Prehistoric earthen site,invaluable cultural heritage in China,plays a key role in understanding the origin of Chinese civilization.After thousands of years,most of them are buried underground.Due to the absence of historical documents,archeological excavation becomes the only way to illustrate the prehistoric life and civilization process(Rotroff,2001).Thereby,test square becomes the most popular structure to obtain archeological information in prehistoric archeology,mainly due to its standard profile resulting from the vertical wall surface.In addition,historical strata can be read and distinguished from four sides of rectangular test square,and the buried relics can be collected as well.It should be noted that the absence of collaboration between archaeologist and conservator is currently a challenging issue in archeological works.Archeologists tend to adopt the shape of test square according to archeological information distribution without considering the stability of test square;as a result,collapse of test square may occasionally occur(Ehrenhard,1994;Charnov,2011;Corfield,2014).Failure of test square not only leads to the loss of prehistoric information,but also threatens the safety of archeologist and cultural relics.Therefore,stability of prehistoric earthen sites during excavation is becoming a hot issue.The principle of saving historic sites has gained interest and has been seen an increasing involvement by geotechnical engineers(Calabresi,2013).It is worthy to make any effort to achieve a convincing explanation of the potential information loss caused and to propose schemes that are safe for the history of the sites.
In geotechnical field,test square in archeological excavation is basically using a method of simple foundation pit.In terms of foundation pit,various researches on theory and method of stability evaluation have been conducted for the purposes of the standardization of foundation pit design and construction.In the late 1980s,Finno et al.(1989)observed the performance of a deep excavation in soft-to-medium stiff,saturated clays in Chicago by measuring the three-dimensional(3D)surface and subsurface ground movements,pore waterpressures,sheet-pile deformations,and strut loads.Lee et al.(1998)discovered the corner effects in strutted excavation.Hashash and Whittle(1996)and Hashash et al.(2006,2008)predicted the ground movement for deep excavation in soft clay and proposed a novel approach to integrate the numerical modeling and field observation for deep excavations.Jen(2005)proposed design methods of deep excavations in clay.Kung et al.(2007)established a simplified model for wall deflection and ground-surface settlement caused by braced excavation in clays.Seo et al.(2009)analyzed different characteristics of ground movements of three deep excavation sites with mixed ground profiles.Currently,various design and construction standards for foundation pit in clay have been proposed in many countries.Unfortunately,less attention is paid to the stability of test square in archeological excavation.Although test square shares similar shapes with foundation pit in geotechnical field,it has its own special characteristics.For instance,in consideration of archeological requirements,test square is characteristic of vertical or step profiles,which should facilitate site excavation as possible and keep the cultural relics undisturbed due to the long-term exposure to archeological investigation(Rotroff,2001).
A number of propping measures during excavation are also involved in foundation pit to reduce the exposure time and guarantee the pit stability(Salgado,2008).Fruitful researches reveal that the performances of foundation pit are affected by many factors(e.g.pit geometries,construction methods,soil conditions,and retaining systems).In foundation pit,many empirical or semiempirical approaches are derived from rectangular excavations(Ou et al.,1993;Hsieh and Ou,1998;Wang et al.,2005,2010;Tan and Wei,2012;Tan and Wang,2013),which provided references for the test square in archeological excavation.For conservation of intangible cultural heritages,it is needed to develop suitable stability evaluation approaches to ensure the safety of archeologist and cultural relics and to protect surrounding cultural information.Due to poorly documented field data,the behaviors of test squarein prehistoric sites still remain unclear.
For this,the archeological excavations in Liangzhu prehistoric sites,China,provide a good opportunity.According to the principle for the conservation of heritage sites in China(ICCOMOS-China,2015),a test square under the similar geotechnical setting was excavated based on the archeological procedure adopted for Liangzhu prehistoric sites.In order to better understand the behaviors of the test square,the lateral displacement and ground settlement were measured during excavation.Numerical simulation using FLAC3D was applied to modeling the whole excavation process,and then comparison between modeled and measured results was conducted to validate the feasibility of the established numerical simulation method.
2.Modeled test square for prehistoric earthen sites
2.1.Location and geometry
The Liangzhu prehistoric sites in Hangzhou,Zhejiang Province,China,are located at the lower reaches of Qiantang River on Southeast China.Liangzhu prehistoric sites sit on the fl at alluvial plain,which is featured by high water tables and thick soft clay in the upper layers.Fig.1 presents the location of Hangzhou in China.In view of the properties of cultural heritages,destructive testing is strictly forbidden on real archeological sites.Therefore,modeling test square with similar environments and strata is adopted to study the deformation and failure behaviors of cultural heritages during excavation.In this study,the experimental site is chosen on the basis of archaeometry and conservation technology of cultural relics,as shown in Fig.2.The site is surrounded by one electrical pipeline in the proximity,open space on the north side,brick walls with 2 m in height on the south and east sides,and the laboratory building(10 m high)on the west side.
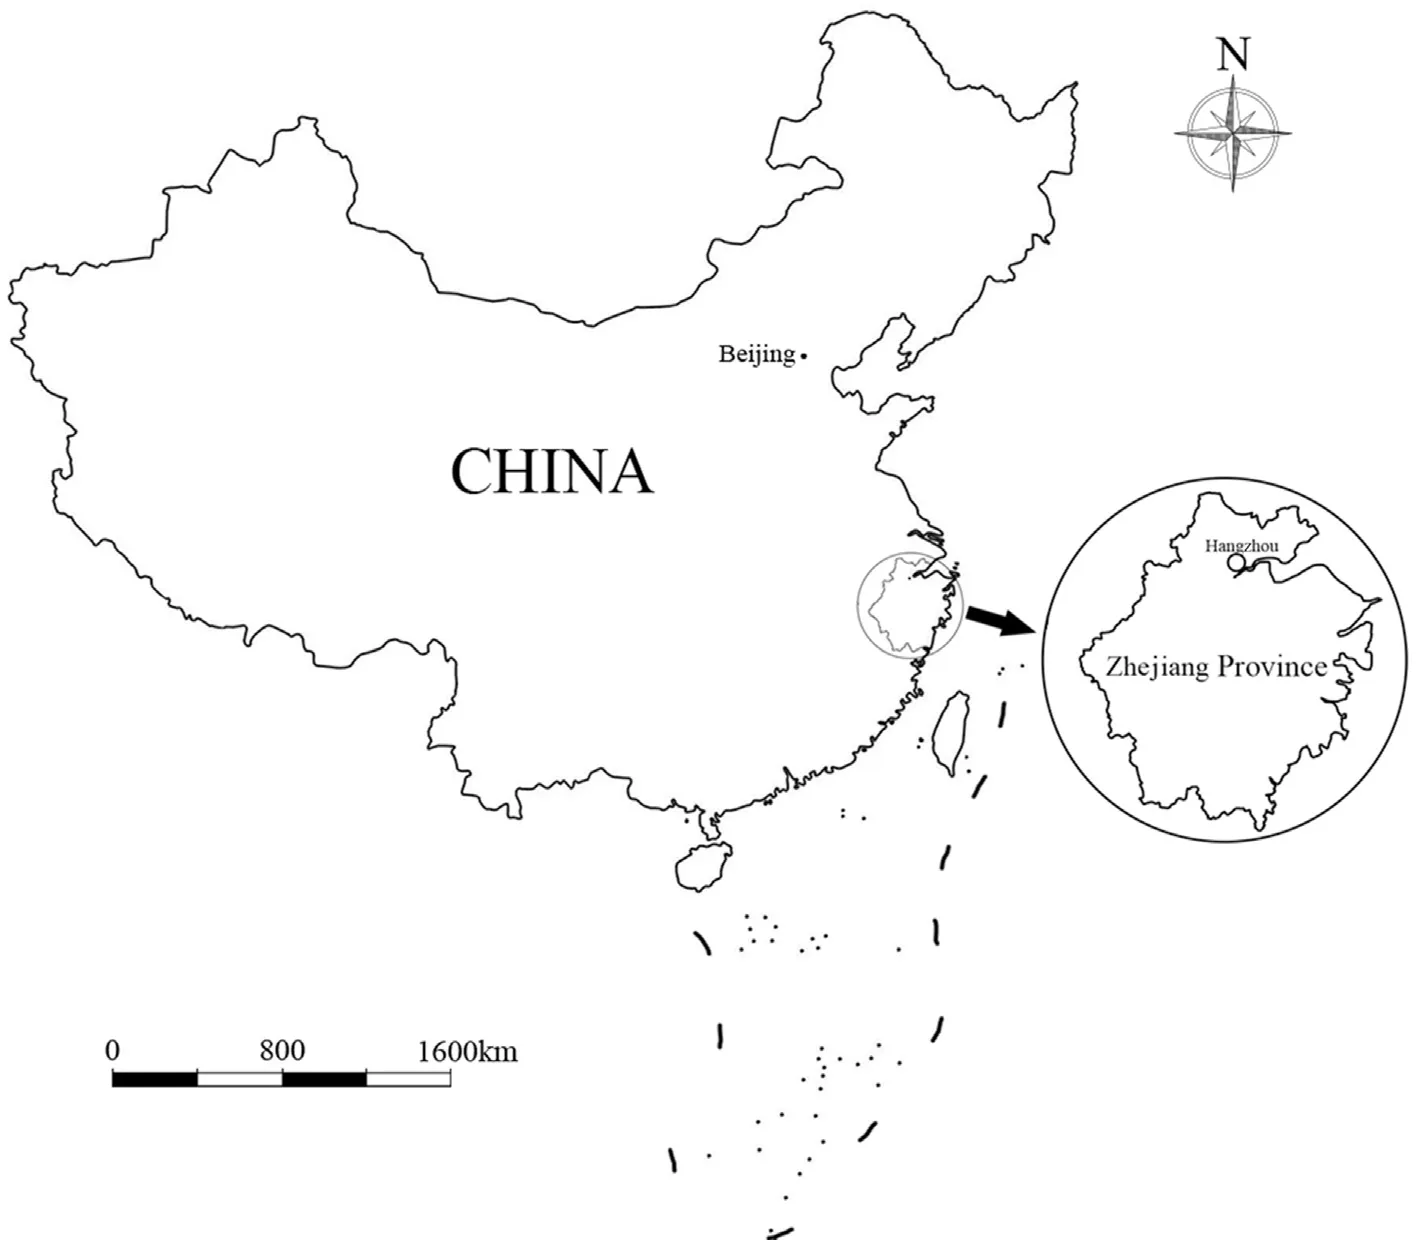
Fig.1.Geographical location of Hangzhou,China.
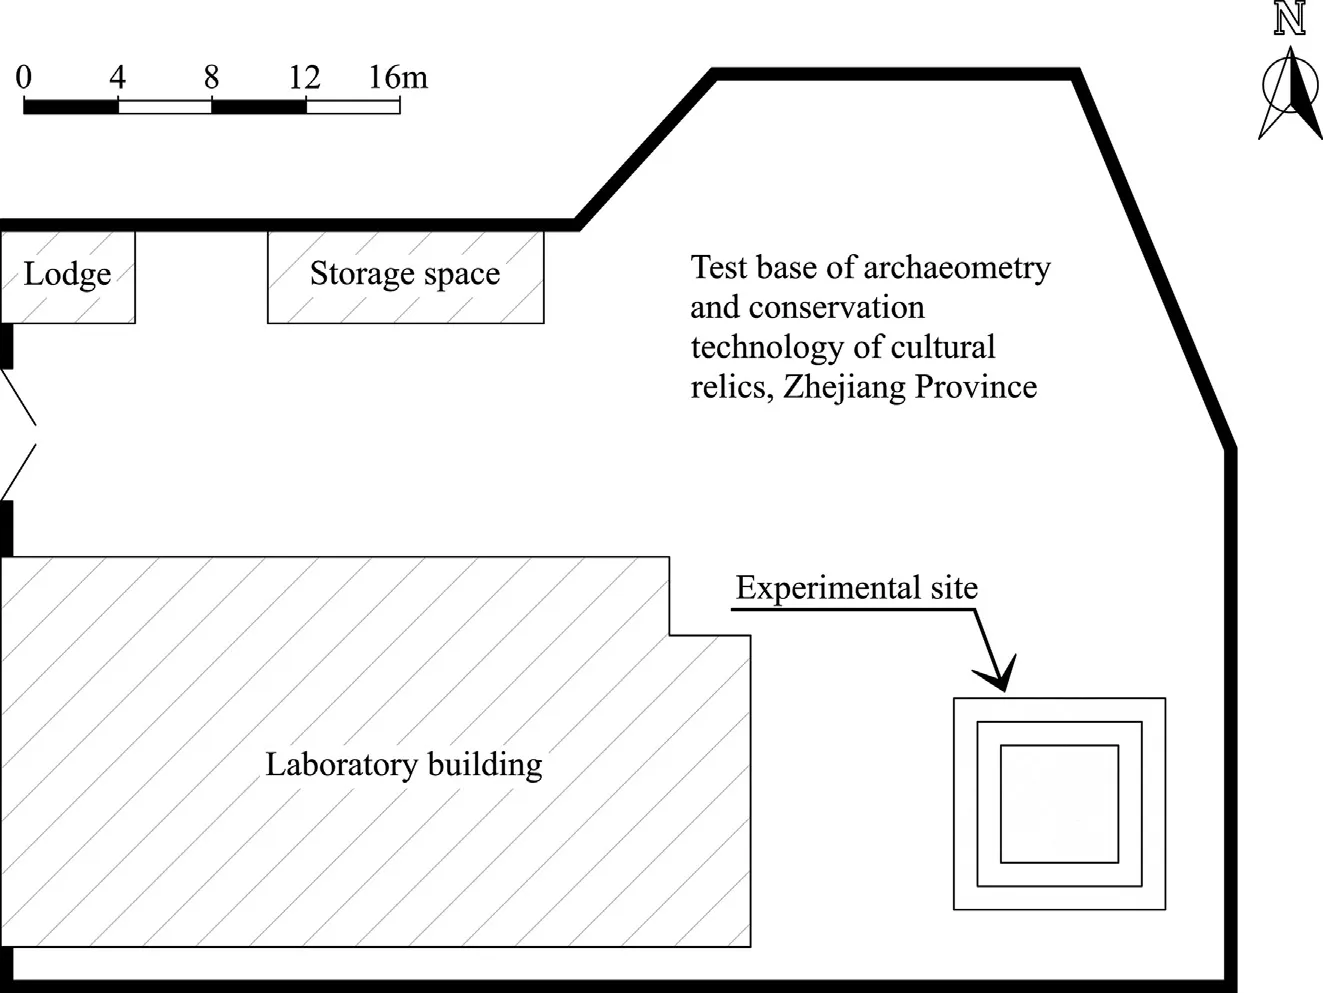
Fig.2.Plan view of the in situ experiment.
2.2.Engineering geology and hydrogeology
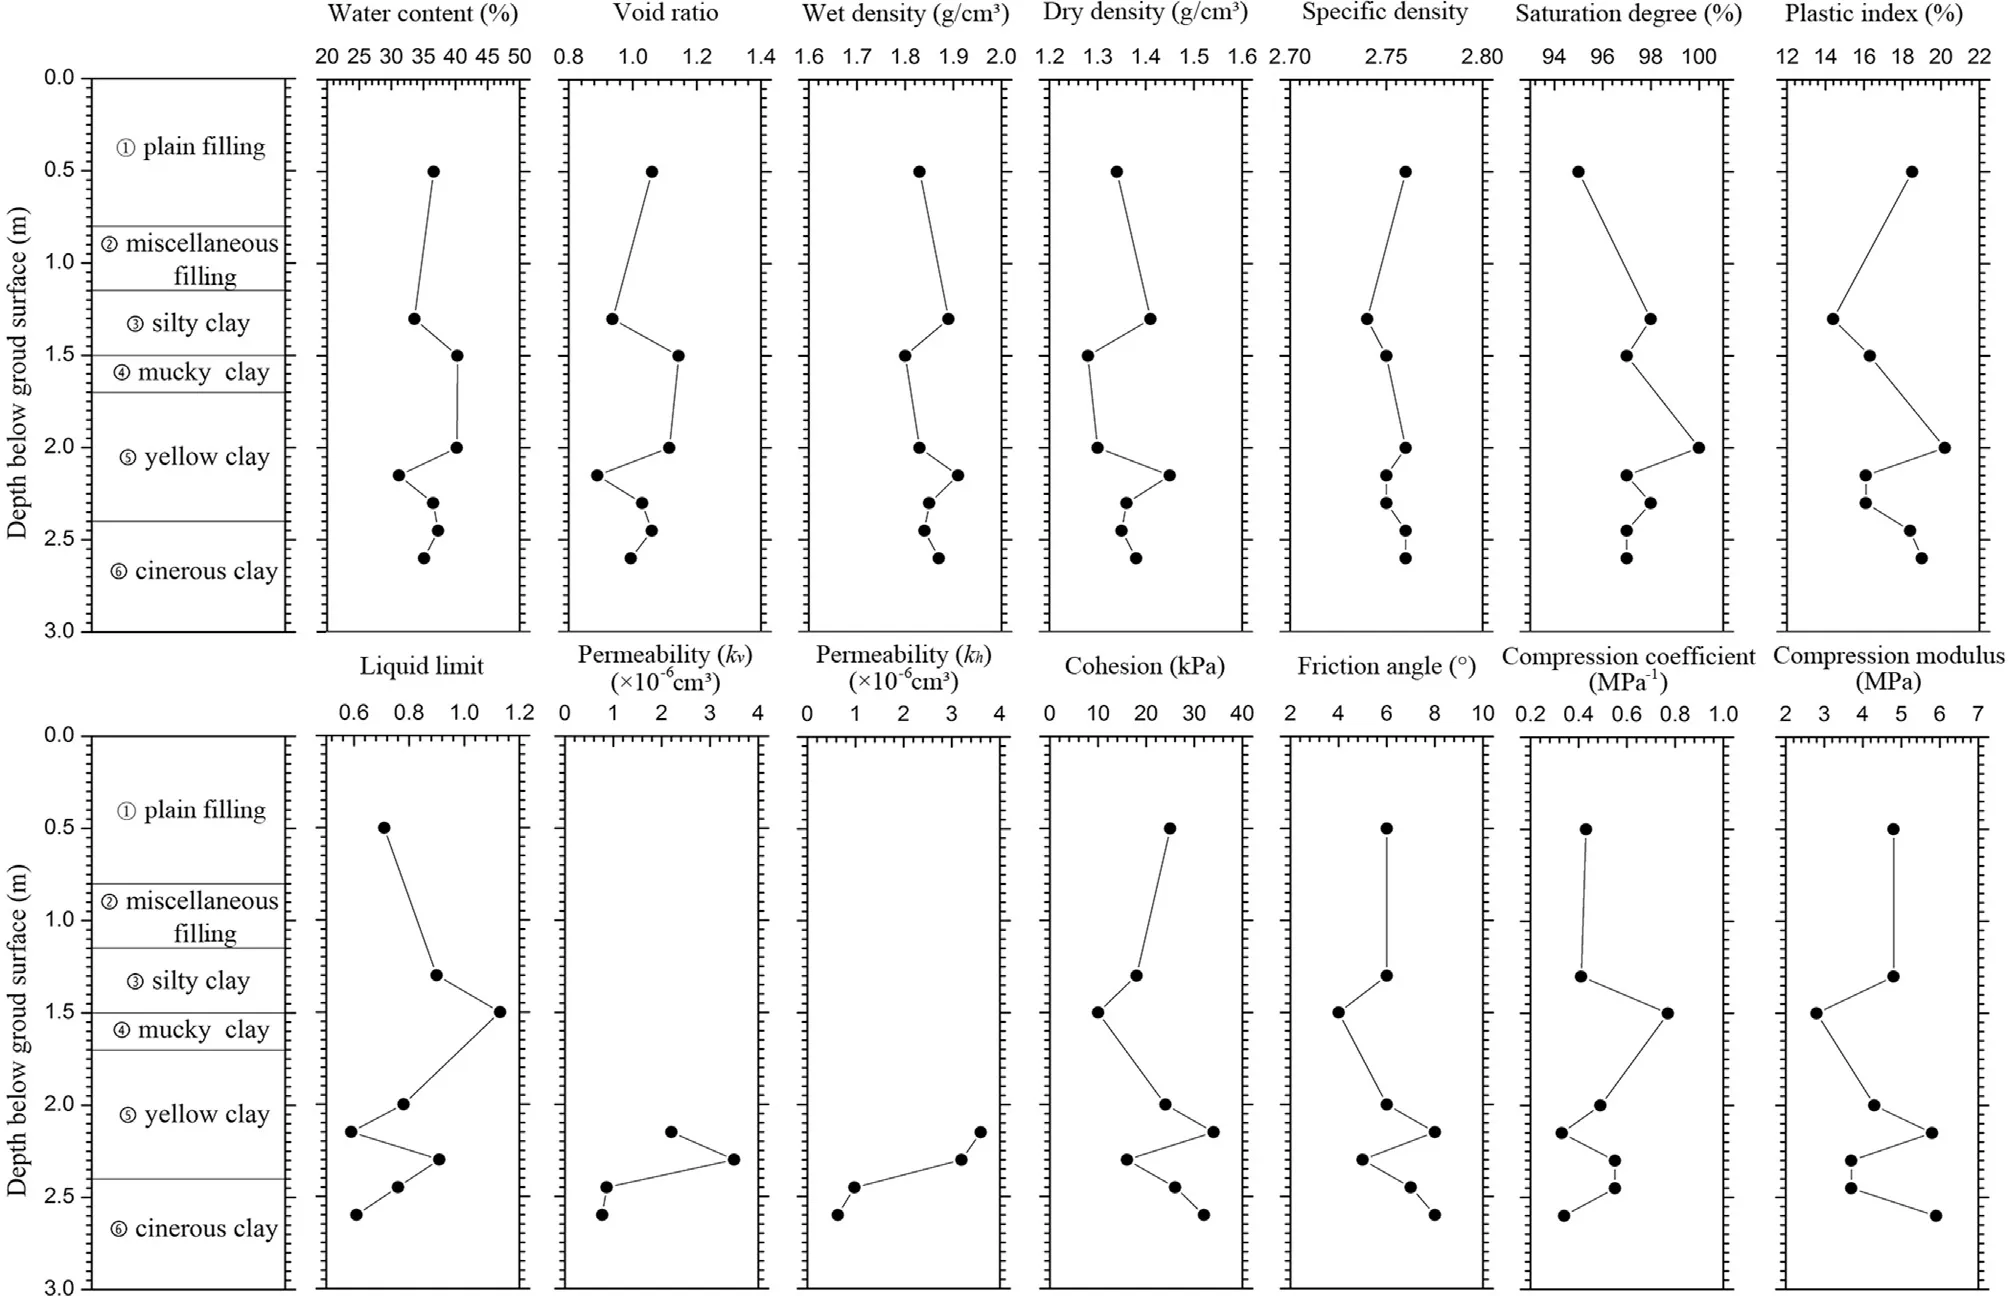
Fig.3.Stratum section.
Prior to excavation,the subsurface conditions and soil properties at the site had been extensively studied by a series of field and laboratory tests.Fig.3 presents the soil profiles with the measured properties along depth at the site.In general,the subsurface conditions are featured by two layers of fillings in the upper 1.15 m below the ground surface,followed by a layer of silty clay(Layer 3)to a depth of 1.5 m.The next layer is mucky clay(Layer 4)extending to a depth of 1.7 m,which is underlain by yellow clay(Layer 5)and cinereous clay(Layer 6)until the depth of 3 m.The observed long-term water table at the site is approximately 0.8 m.More detailed information regarding the geological and hydrological conditions in Hangzhou can be found in Wang and Chen(2010)and Xu et al.(2015).
2.3.Excavation procedure
It is proved(Youssef and Andrew,1996;Wang et al.,2005;Youssef and Richard,2008;Tan and Li,2011)that dewatering should be carried out before excavation of ground pit in high water-level area;otherwise,it is almost impossible to form the expected shape of ground pit due to the pit collapse induced by groundwater.Because of this,dewatering trench was considered around the test square prior to excavation of the test square, filled with sand and gravel as well as equipped by two pumping wells at the two corners.Meanwhile,the protective shed was built above the planned test square to prevent frequent rainfall and facilitate excavation.After the water table was lowered to the depth of 2 m,the test square was dug following the standard procedure of archaeological excavation using the top-down method,as illustrated in Fig.4.The size of the investigated test square is 5 m long,5 m wide and 2.3 m deep,with a cross-sectional area of 25 m2.It consists of two portions:(1)archeological column(1 m×2 m×2.3 m,length×width×height)at the center for the presentation of cultural strata,and(2)the 2.5 m deep peripheral rectangular pit,among which the south side is using one step profile and the others are vertical profiles for comparison purposes.The excavation of the test square was only performed at day time and it took 5 d in total.
2.4.Monitoring layout
To investigate the excavation behaviors and ensure the safety of working staff,a comprehensive field instrumentation program was conducted during the entire excavation progress,as shown in Fig.4.Assuming that the modeled archeological column sitting on the center of the test square keeps stable during the whole excavation process,the archaeological column is then not considered in the monitoring program.Observation from the entire excavation verified the assumption.The monitored items associated with instrumentsare(1)lateral soil movement measured by 4 inclinometer casings(designated as L1-L4)that are distributed in each side;and(2)ground settlements surveyed at one critical section behind the north wall using a level instrument(designated as M1-M8).
3.Numerical simulation
Numerical simulation is carried out to analyze the behaviors of the test square during each construction step,and the feasibility of numerical simulation on stability evaluation of test square is validated for prehistoric earthen sites during archaeological excavation.
3.1.Numerical model

Fig.4.Monitoring layout,plan view,and cross-sections.

Fig.5.Simulation model and excavation process.
A 3D numerical model was built using FLAC3D (Itasca Consulting Group,2007).The dimensions of this model are 12 m deep(four times the excavation depth)and 50 m wide(ten times the excavation length and width).In this sense,the effects of boundary conditions on the responses of the pit can be negligible.The model is divided into 207,360 zones with 218,489 nodes,as shown in Fig.5.For the regions away from the excavation,coarser meshes were used;for regions in the vicinity of the excavation face,finer meshes were utilized.The selected dimensions of the model are large enough to account for any restriction of propagation of stress and strains.Considering the stress and strain propagation,dimensions of the model to avoid any restrictions at the boundaries were determined using the trial-and-error method.The 3D linear hexahedron elements were used for the 3D modeling of soil materials,with three degrees of freedom at each node inx-,y-,andzdirections.The hexahedron elements are able to withstand plastic deformation,creep,swelling,stress stiffening,and large strain.

Table 1Physico-mechanical parameters of soils.

Table 2Physico-mechanical parameters of filling materials in dewatering trench.
3.2.Calculation conditions
(1)Boundary conditions
According to the characteristics of the model,the top surface of the model was designed as a free face,the side faces were restrained by rollers,and the bottom of the model was assumed to be fixed.
(2)Mechanical parameters of the model
The geological investigations of the site report the physicomechanical parameters of different layers of soils as listed in Table 1.The physico-mechanical parameters of filling materials of dewatering trench are shown in Table 2.Water lever is represented by means of FISH function in FLAC3D and is illustrated in Fig.6,and water level can be seen in Fig.7.
(3)Failure criterion
The soil is assumed isotropic and homogenous with Mohr-Coulomb yield criterion.Mohr-Coulomb criterion was applied in modeling the stress-strain behaviors of soils during excavation.
3.3.Analysis results
3.3.1.Horizontal displacement contour
In order to reveal the distribution of horizontal displacement around the test square,numerical results after each excavation step are displayed in Fig.8.

Fig.6.Water lever contours after dewatering.
(1)After the first excavation step,the upper part of south side yields a positive displacement,which means the upper part of south side wall deforms towards the test square direction.The upper part of the opposite side(north side)deforms towards the inner wall.Comparatively,the other sides(east and west sides)have no apparent deformation.
(2)When the second excavation step is completed,the south and west walls of test square are subsequently formed.The west side shows nonlinear deformation along the vertical section.From the bottom to the top,the west side wall moves towards the inner wall,and then transfers and moves towards the test square direction.However,no apparent differential deformation occurs at the south side wall.Those scenarios indicate that the step-shape profile has a better mechanical performance than vertical shape profile.
(3)After the third excavation step,the test column is partly formed.From the contours of horizontal displacements,it can be seen that no obvious deformation occurs in this excavation step.The side walls that are formed in the second excavation step still keep a stable deformation trend.
(4)The entire shape of the test square maintains well after the fourth excavation step.In comparison with the four sides of the test square,no apparent deformation occurs in north and south sides.However,the west side wall shows an apparent positive deformation and the east side wall yields a negative deformation.

Fig.7.Water lever represented by FISH.
3.3.2.Contour of shear strain increment
For the purpose of stability evaluation of the test square,contours of shear strain increment are obtained using strength reduction method.In Fig.9,it can be clearly seen that no sliding surface appears at the south side;however,the other side walls have a potential sliding surface.In order to demonstrate the slide belt of side walls,higher values of shear strain increment are highlighted and displayed in Fig.10.This clearly shows that step shape performs better than vertical shape does.
3.4.Comparison between numerical and monitoring results
3.4.1.Lateral soil movement
Modeling section is selected according to the actual monitoring one where inclinometers are set up.Monitoring points are listed in Table 3.
Considering the time effect,the initial and final displacements in the modeling are displayed in Fig.11.Along the vertical section,soil mass moves towards the outside of the test square in the range of 0-0.5 m of depth,and then gradually moves towards inside of the test square after 0.5 m deep.It can be observed that the modeled results are in good agreement with the monitoring data except for a point at east side.This basically proves that the numerical simulation used in the research is suitable for stability evaluation of archeological excavation in prehistoric earthen sites.
3.4.2.Ground settlement
Comparison of the ground settlements(M1-M8)between numerical and monitoring results is shown in Fig.12.It is apparent that the modeled results match well with the monitoring ones at four steps of excavation.In view of absolute value,ground settlement is larger than lateral displacement in the studied test square,which shows that soil consolidation is still in progress during excavation.For safe evaluation purpose,ground settlement will pose less threat to the safety of archaeological information by the archaeologists in comparison with lateral displacement.Comparison results also validate the established numerical method.In other words,FLAC3D can be applied to the stability evaluation of archaeological test square during excavation.
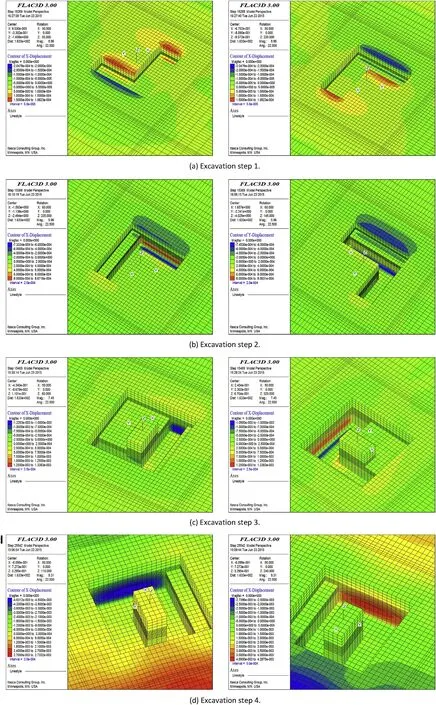
Fig.8.Horizontal displacement contours at different excavation steps.

Fig.9.Contour of shear strain increment in the completed test square.

Fig.10.Distribution of high shear strain among test square.
4.Conclusions
In order to understand the behaviors of test square in archeological excavation,Liangzhu prehistoric earthen sites are used as an example.For this,numerical simulation of test square behaviors during archaeological excavation is conducted.Finally,the modeling results are compared and validated by the monitoring results.The following conclusions can be drawn:
(1)Horizontal displacements around the test square show apparent different characteristics in the four sides of the pit.Except for the step side,other three vertical sides demonstrate a slow increase and then decrease in horizontal displacements from ground to bottom of test square.It is verified that step shape is superior to vertical shape for stability purpose of test square.
(2)The excavation procedure and dimension of the test square in this paper show a good stability without any cracks.The match between the modeling and monitoring results verifies the feasibility and applicability of numerical simulation in archeological works.However,sensitive analyses for different material properties are needed in further works.
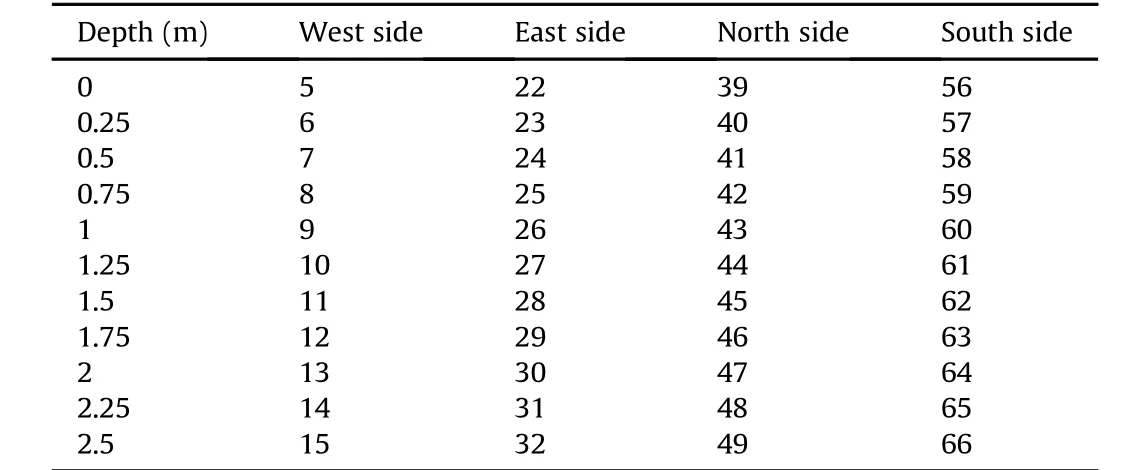
Table 3Number of monitoring points in numerical simulation.
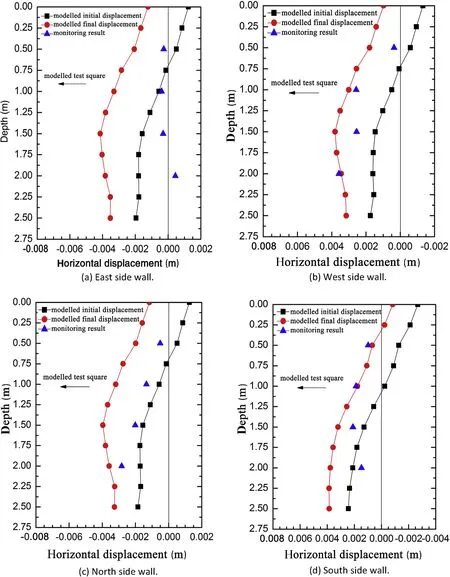
Fig.11.Comparison between monitoring and modeled results.
Conflict of interest
We wish to confirm that there are no known conflicts of interest associated with this publication and there has been no significant financial support for this work that could have influenced its outcome.
Acknowledgements
Many institutions and scholars are contributing to this research project and special thanks are given to Conservation Technology of Cultural Relics,Zhejiang Province,China.The financial support provided by the National Natural Science Foundation of China(Grant No.51578272),the State Administration of Cultural Heritage“Research Program for Outstanding Youth"(Grant No.2014224),the National Key Technology R&D Program of China during the Twelfth Five-year Plan Period(Grant No.2013BAK08B11),and the Project on Basic Research of Gansu Province’s Innovation Group(Grant No.145RJIF336)are highly acknowledged.Finally,the insightful comments and suggestions from the anonymous reviewers are sincerely appreciated.
Calabresi G.Le rôle des ingénieurs géotechniciens dans la sauvegarde des monuments et des sites historiques.In:Proceedings of the 18th international conference on soil Mechanics and geotechnical engineering.Paris:French Society for Soil Mechanics and Geotechnical Engineering(CFMS);2013.p.71-83(in France).
Charnov AA.100 years of site maintenance and repair:conservation of earthen archaeological sites in the American southwest.Journal of Architectural Conservation 2011;17(2):59-75.
Corfield M.Archaeological sites:conservation and management.Journal of the Institute of Conservation 2014;37:197-207.
Ehrenhard JE.Stabilization and restoration at Russell cave.Cultural Resources Management 1994;17(1):28-30.
Finno RJ,Atmatzidis DK,Perkins SB.Observed performance of a deep excavation in clay.Journal of Geotechnical Engineering 1989;115(8):1045-64.
Hashash YMA,Whittle AJ.Ground movement prediction for deep excavations in soft clay.Journal of Geotechnical Engineering 1996;122(6):474-86.
Hashash YMA,Marulanda C,Ghaboussi J,Jung S.Novel approach to integration of numerical modeling and fi eld observations for deep excavations.Journal of Geotechnical and Geoenvironmental Engineering 2006;132(8):1019-31.
Hashash YMA,Osouli A,Marulanda C.Central artery/tunnel project excavation induced ground deformations.Journal of Geotechnical and Geoenvironmental Engineering 2008;134(9):1399-406.
Hsieh PG,Ou CY.Shape of ground surface settlement profiles caused by excavation.Canadian Geotechnical Journal 1998;35(6):1004-17.
ICCOMOS-China.Principles for the conservation of heritage sites in China.Los Angeles,CA,USA:The Getty Conservation Institute;2015.
Itasca Consulting Group.Fast Lagrangian analysis of continua in three dimensions.America:Itasca Consulting Group;2007.
Jen LC.The design and performance of deep excavations in clay.PhD Thesis.Massachusetts Institute of Technology;2005.
Kung GT,Juang CH,Hsiao EC,Hashash YM.Simplified model for wall deflection and ground-surface settlement caused by braced excavation in clays.Journal of Geotechnical and Geoenvironmental Engineering 2007;133(6):731-47.
Lee FH,Yong KY,Quan KCN,Chee KT.Effect of corners in strutted excavations: field monitoring and case histories.Journal of Geotechnical and Geoenvironmental Engineering 1998;124(4):339-49.
Ou CY,Hsieh PG,Chiou DC.Characteristics of ground surface settlement during excavation.Canadian Geotechnical Journal 1993;30(5):758-67.
Rotroff SI.Archaeologists on conservation:how codes of archaeological ethics and professional standards treat conservation.Journal of the American Institute for Conservation 2001;40(2):137-46.
Salgado R.The engineering of foundations.McGraw-Hill;2008.
Seo MW,Olson SM,Yang KS,Kim MM.Sequential analysis of ground movements at three deep excavation sites with mixed ground profiles.Journal of Geotechnical and Geoenvironmental Engineering 2009;136(5):656-68.
Tan Y,Li MW.Measured performance of a 26 m deep top-down excavation in downtown Shanghai.Canadian Geotechnical Journal 2011;48(5):704-19.
Tan Y,Wei B.Observed behaviors of a long and deep excavation constructed by cutand-cover technique in Shanghai soft clay.Journal of Geotechnical and Geoenvironmental Engineering 2012;138(1):69-88.
Tan Y,Wang DL.Foundation pit excavated by the central-island technique in Shanghai soft clay.II:top-down construction of the peripheral rectangular pit.Journal of Geotechnical and Geoenvironmental Engineering 2013;139(11):1894-910.
Wang JH,Xu ZH,Wang WD.Wall and ground movements due to deep excavations in Shanghai soft soils.Journal of Geotechnical and Geoenvironmental Engineering 2010;136(7):985-94.
Wang SP,Chen YH.The geological condition and the main geotechnical problems of the Hangzhou No.1 Subway.Zhejiang Construction 2010;27(2):12-5(in Chinese).
Wang ZW,Ng CW,Liu GB.Characteristics of wall de fl ections and ground surface settlements in Shanghai.Canadian Geotechnical Journal 2005;42(5):1243-54.
Xu RQ,Deng YW,Xu B,Lai JP,Zhan XG,Xu LY,Lu JY.Quantitative analysis of soft porosity based on SEM clay three-dimensional image information.Journal of Earth Sciences and Environment 2015;37(3):104-10(in Chinese).
Youssef MA,Andrew JW.Ground movement prediction for deep excavations in soft clay.Journal of Geotechnical Engineering 1996;122(6):474-86.
Youssef MA,Richard JF.Ground development of new integrated tools for predicting,monitoring,and controlling ground movements due to excavations.Practice Periodical on Structural Design and Construction 2008;13(1):4-10.
 Journal of Rock Mechanics and Geotechnical Engineering2018年3期
- Journal of Rock Mechanics and Geotechnical Engineering的其它文章
- Assessment of clay stiffness and strength parameters using index properties
- Velocity of detonation measurement and fragmentation analysis to evaluate blasting efficacy
- Geostructural stability assessment of cave using rock surface discontinuity extracted from terrestrial laser scanning point cloud
- Optimization of dewatering schemes for a deep foundation pit near the Yangtze River,China
- Discussion on“Empirical methods for determining shaft bearing capacity of semi-deep foundations socketed in rocks”[J Rock Mech Geotech Eng 6(2017)1140-151]
- Reply to Discussion on“Empirical methods for determining shaft bearing capacity of semi-deep foundations socketed in rocks”
