Assessment of clay stiffness and strength parameters using index properties
Sayed M.Ahmed
Structural Engineering Department,Ain Shams University,Cairo,11517,Egypt
1.Introduction
Determination of the parameters of compressibility and strength of geomaterials is a difficult yet essential task in geotechnical analyses.Reliable estimates of these parameters allow geotechnical engineers to design structures,roads and utilities to be safe,serviceable and economic.Commonly,geotechnical engineers,in the initial phases of the geotechnical investigation,focus on the index properties such as the liquid limit,LL,plastic limit,PL,natural water content,wn,and gradation tests.These tests are generally cheap,as they do not require expensive capacious equipment or special experience.They are mainly used to serve in the classi fi cation of soils.


Geotechnical engineers commonly utilize clay index properties to estimate the geotechnical parameters.For example,the use of plasticity index,PI,to estimate the effective friction angle,φ′,and the use of the liquidity index,LI,to determine the undrained shear strength,su,are the normal geotechnical practices.Nevertheless,such correlations have a substantial scatter(Kulhawy and Mayne,1990;Ameratunga et al.,2015).Fig.1 shows the obviously scatteredPI-φ′data,pertaining to different clays(Tanaka,2002),versus a recentPI-φ′correlation proposed by Sorensen and Okkels(2013).This figure also illustrates that some clays may have a high effective friction angle,φ′,despite of high plasticity index,PI,which contradicts with the commonly related correlations.
Moreover,some clays naturally exist with a liquidity index,LI,greater than 100%(i.e.the natural water content,wn,is greater than the liquid limit,LL);yet they have non-trivial undrained shear strength,su,that increases with depth.This contradicts with the common correlations that relatesutoLIas they presume such clays to have negligible undrained strength.Examples of these clays include Ariake clay in Japan and Champlain clay in Canada(Rochelle et al.,1974;Tanaka et al.,2001).
The above-mentioned discrepancies shed doubts on the reliability of the correlations relating the clay parameters to the index properties.One of the anticipated reasons for these discrepancies is that such correlations are developed based on the data pertaining to particular sites.Hence,inaccuracies may occur when such correlations are applied to other sites with varied clay mineralogy,gradation and/or state of stresses.Additionally,many influencing factors,such as aging,cementation,and anisotropy,cannot simply be incorporated into the correlations that relate clay parameters to the index properties.In this context,site-specific correlations are generally expected to perform better than generic correlations.
In this study,the parameters controlling the site-specific relationships between the shear wave velocity,VS,the void ratio,e0,and the effective mean stress,p′,are obtained using measurements of the clay index properties with depth.Subsequently,the strength and stiffness parameters are determined using relationships interrelating clay stiffness and strength.The presented approach comprises an iterative site-specific methodology rather than a direct correlation.It can be implemented using a simple spreadsheet.Thus,it can be utilized in both geotechnical research and routine engineering practices.

Fig.1.Relationship between the effective friction angle φ′and plasticity index PI.
2.Previous related correlations
The following correlations are utilized in this study as a part of the presented procedures:
(1)The compression index,CC,is related to the plasticity index,PI,as follows(Wroth and Wood,1978):


Eqs.(1)-(7)can simply be substituted with alternative sitespecific correlations or factual data without affecting the structure of the presented methodology.
3.Site-specific formulation of the shear wave velocity
Recently,the use of shear wave velocity(either independently or with other parameters)has become an increasing trend in geotechnical engineering.The shear wave velocity has been related to many important geotechnical parameters such as the bulk unit weight,effective friction angle,undrained shear strength,and atrest earth pressure coefficient(Mayne,2014;Hussien and Karray,2016;L’Heureux and Long,2016;Moon and Ku,2016a).Moreover,the indispensable need to consider the small-strain stiffness in geotechnical applications is related to the shear wave velocity,which has been frequently demonstrated(Burland,1989;Atkinson,2000;Elhakim,2005;Benz,2007;Clayton,2011).
Many studies have shown that the shear wave velocity can be expressed directly as a function of the effective mean stress,p′,the soil void ratio,e0,and theOCR(Hardin and Richart,1963;Hardin,1978).More recently,a different approach has been presented.The shear wave velocity is expressed as a function of certain sitespecific parameters with either the effective mean stress,p′,or the void ratio,e0(Santamarina et al.,2001;Ku et al.,2016)as follows:

whereVS,p′andVS,e0are the estimates of shear wave velocity using the mean effective stress,p′,or the void ratio,e0,respectively.The pa
rametersα,β,a,andbare the site-specific parameters.
It is noted that Eqs.(8)and(9)do not provideVSas functions of the effective mean stressp′or void ratioe0only,as these formulae depend also on site-specific parameters,i.e.α,β,a,andb.Based on the measurements made in many sites with different geomaterials(including clays and sands)at different states of stresses and OCRs,it is found that the site-specific parametersαandaare related toβ andb,respectively,which can be written as follows(Ku et al.,2016;Moon and Ku,2016b):


Generally,the site-specific parameters(i.e.α,β,a,andb)are determined from in situ measurements of the shear wave velocityVS.In this study,the shear wave site-specific parameters,i.e.α,β,a,andb,are determined by utilizing the variation of the natural water content,wn(or the void ratioe0)with the effective mean stress,p′.Hence,shear wave velocityVScan be estimated consequently.
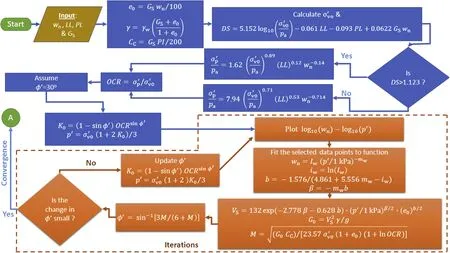
Fig.2.Iterative procedure used in this study.

Fig.3.Continuation of the analysis after convergence.
4.Methodology
4.1.Determination of the shear wave velocity VS
According to Eqs.(8)-(11),VS,p′andVS,e0may be expressed as follows:


As lnGS≈1 for the common value range ofGS,lne0in saturated soils may be expressed as follows:

Fig.4.Locations of the five case studies.

Fig.5.Index properties and inferred OCR of Bothkennar clay case study.Sources of data:Allman and Atkinson(1992),Hight et al.(1992,2003),Nash et al.(1992),McGinty(2006),and Mayne(2016).


Fig.6.Regression analysis of Bothkennar clay case study.Sources of data:Allman and Atkinson(1992),Hight et al.(1992,2003),Nash et al.(1992),McGinty(2006),and Mayne(2016).

Fig.7.Undrained shear strength suof Bothkennar clay case study.Sources of data:Allman and Atkinson(1992),Hight et al.(1992,2003),Nash et al.(1992),McGinty(2006),and Mayne(2016).
whereiwandmware the site-specific parameters representing the intercept and the negative slope of the lnwn-lnp′linear relationship,respectively.
The interceptiwand the slopemwin Eq.(16)can be determined using simple regression analysis with common spreadsheet program,such as EXCEL,by assuming a power fitting function with respect to the natural water content,wn,and the mean effective stress,p′,as follows:

whereie,me,andIeare the site-specific parameters representing the intercept of the lne0-lnp′linear relationship,the negative exponent of thee0-p′power relationship,and the constant of thee0-p′power relationship,respectively.
The relationships betweeniw,ieandmw,meare
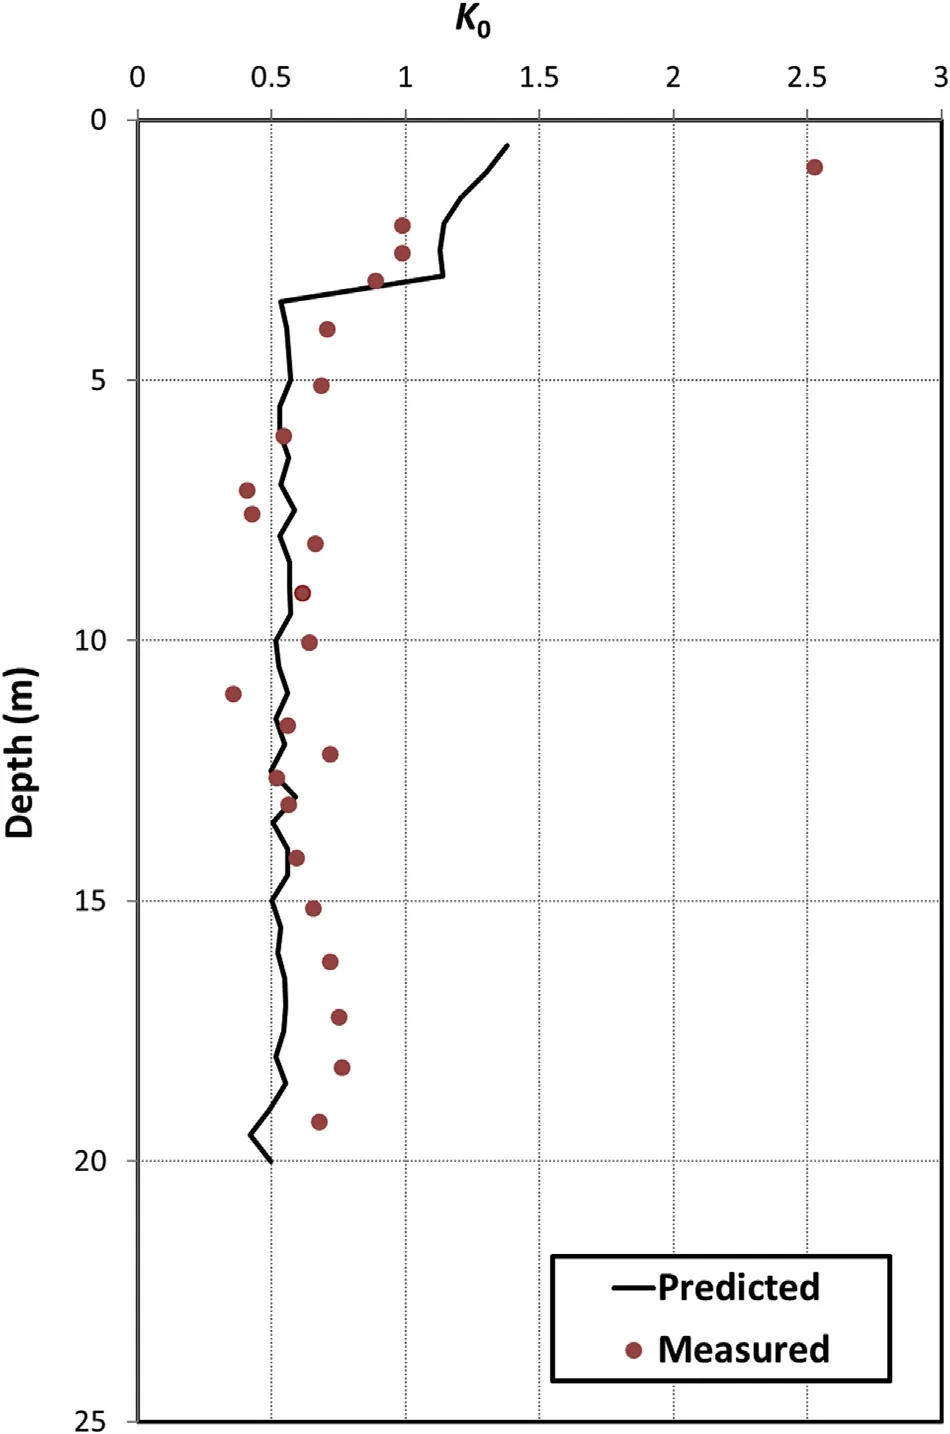
Fig.8.At-rest earth pressure coefficient K0of Bothkennar clay case study.Sources of data:Allman and Atkinson(1992),Hight et al.(1992,2003),Nash et al.(1992),McGinty(2006),and Mayne(2016).

Theoretically,Vsestimated using the formulations ofVS,p′orVS,e0should be identical.Nevertheless,as commonly acknowledged,there might be differences between independent expressions for the same geotechnical parameter,especially when they depend on different inputs.Hence,in case ofVS,p′≠VS,e0,it is logical to use the average of them as an estimate ofVS.This average is assumed herein as the geometric mean value.Hence,the shear wave velocityVSmay be estimated usingVS,e0andVS,p′as follows:


Fig.9.The shear wave velocity VSof Bothkennar clay case study.Sources of data:Allman and Atkinson(1992),Hight et al.(1992,2003),Nash et al.(1992),McGinty(2006),and Mayne(2016).
The geometric mean value,expressed in Eqs.(25)and(26),is preferred over other averaging methods as it yields a similar expression to the direct correlations that relate the shear wave velocityVSto both of the mean effective stress,p′,and the void ratio,e0.Nevertheless,it is noted that the above equations utilize the site-specific parametersβandbin lieu of constants in the direct correlations.
The mean effective stress,p′,in the above equations is determined in accordance with Eqs.(2)-(7).An initial value for the effective friction angle,φ′,is needed at the start of the analyses.This initial value may be assumed as 30°.Subsequently,an iterative procedure is used to determine the true value ofφ′as detailed in the following sections.
4.2.Determination of clay stiffness parameters
In this section,the small-strain shear modulus,G0,and the operative moduli,G50,andEoed,are deduced from the deduced shear wave velocity.Firstly,the small-strain shear modulus,G0,is determined from the shear wave velocity and the soil unit weight as follows(Mayne,2014):

whereγandgare the clay unit weight and the gravitational acceleration,respectively.

Fig.10.The effective friction angle φ′of Bothkennar clay case study.Sources of data:Allman and Atkinson(1992),Hight et al.(1992,2003),Nash et al.(1992),McGinty(2006),and Mayne(2016).
The secant shear modulus at 50%of the ultimate shear stress,
G
50,is related to the small-shear modulus,G0,as follows(Krage et al.,2014):

4.3.Determination of the effective friction angle
In this section,the effective friction angle, φ′,is determined using the formulation of the rigidity index,Ir,which relates clay strength to its stiffness.The parameter,Ir,is defined as the ratio of the operative shear modulusGto the undrained shear strengthsu(i.e.Ir=G/su).
For the case of the consolidated isotropic undrained triaxial compression(CIUC)testin soft to firm clays,the rigidity indexIr,CIUCmay be estimated using the critical state mechanics as follows(Kulhawy and Mayne,1990;Mayne,2001):

whereMis a critical state strength parameter.It is related to the critical state friction angle φcsasM= 6 sin φcs/(3-sinφcs).However,in soft to firm clays,the difference between the peak strength friction angle,φ′,and the critical state friction angle,φcs,may be ignored.Hence,the parameterMmay be defined for these studied clays asM=6 sinφ′/(3-sinφ′)(Kulhawy and Mayne,1990).
The operative shear modulusGin Eq.(30)may be assumed equal toG50(Kulhawy and Mayne,1990;Mayne,2001).Thus,Eq.(30)may be modified as follows:

Subsequently,the effective friction angle,φ′,is estimated using the value ofMobtained from Eq.(33)as follows:

The outcome of Eq.(34)is considered a better estimate of the effective friction angle φ′than its initial assumption(i.e.30°).The effective friction angle, φ′,becomes closer to its real value with more iterations;the value ofφ′concluded from an iteration is considered to be the new initial value in the subsequent iteration.The iterations stop when the effective friction angle φ′converges to its anticipated correct value.

Fig.11.Index properties and OCR of Ariake clay case study.Source of data:Tanaka et al.(2001).

Fig.12.Regression analysis of Ariake clay case study.Source of data:Tanaka et al.(2001).
4.4.Determination of the undrained shear strength
The undrained shear strength varies with the stress path.Typically,the undrained shear strength of the triaxial compression(TC)test is the largest and that of the triaxial extension(TE)test is the lowest.The undrained strength of the direct simple shear(DSS)test is nearly the average of these limits,and hence it is often employed in the geotechnical analysis that involves different stress paths such as the analysis of foundations and slopes.
The DSS undrained strengthsu,DSScan be obtained from the estimated effective friction angle,φ′,overconsolidation ratio,OCR,and the effective vertical stress,σ′v0,as follows(Wroth and Wood,1978;Kulhawy and Mayne,1990):

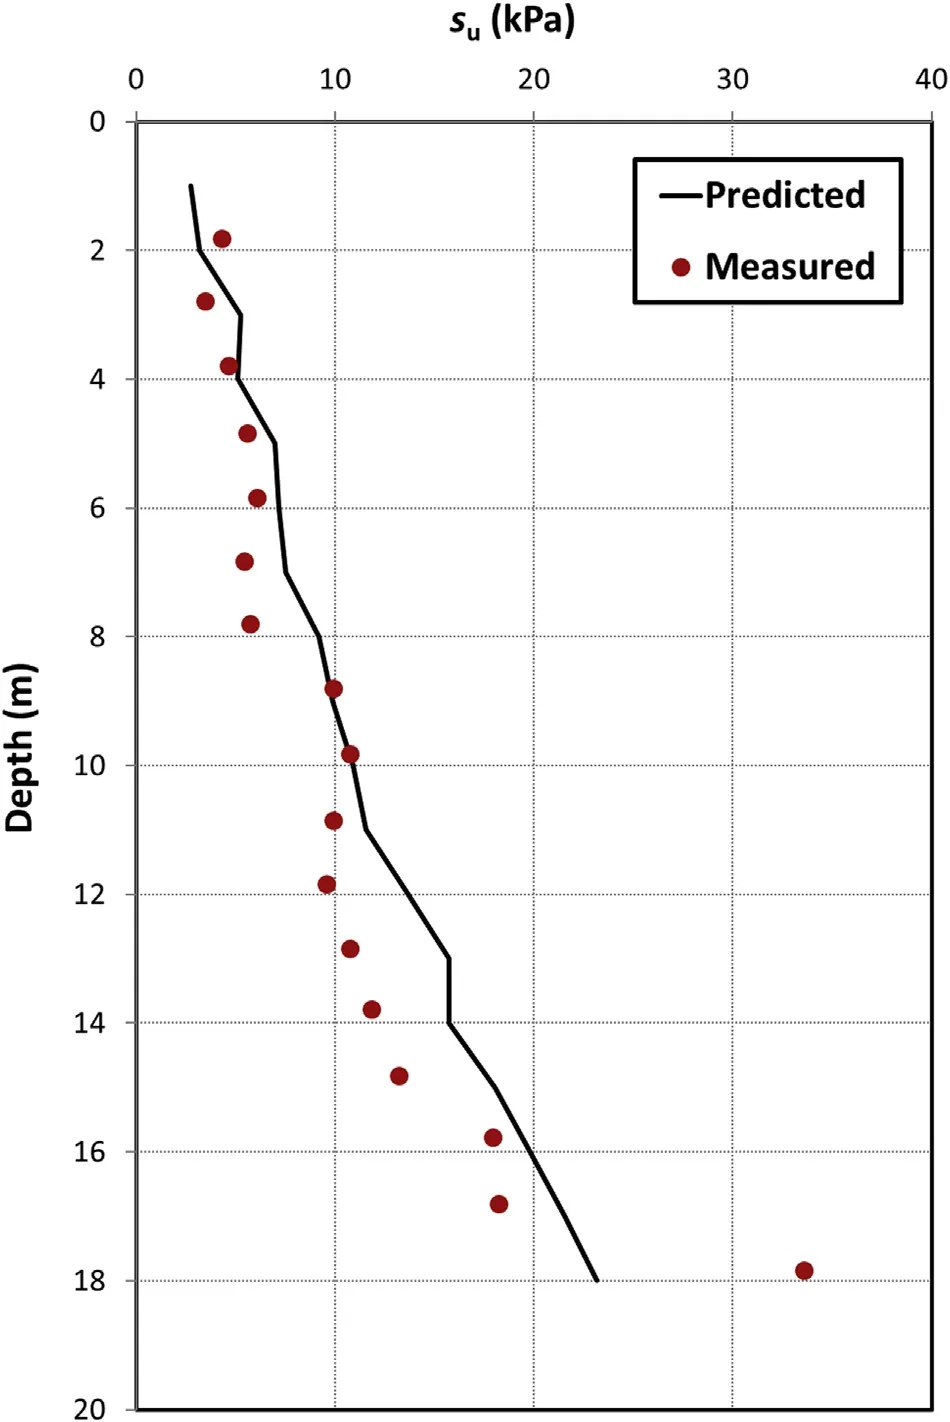
Fig.13.Undrained shear strength suof Ariake clay case study.Source of data:Tanaka et al.(2001).
The undrained shear strength for other stress paths can also be determined for the same stress and effective strength parameters(Kulhawy and Mayne,1990).
4.5.Determination of the cone factors Irand Nkt
Based on the estimated values ofG50andsu,DSS,the cone rigidity factor,Ir,cone,may be determined as


Fig.14.Small-strain shear modulus G0of Ariake clay case study.Source of data:Tanaka et al.(2001).

Fig.15.Cone factor Nktof Ariake clay case study.Source of data:Tanaka et al.(2001).
4.6.Iterative procedure
As mentioned previously,the analysis starts with an assumption of the effective friction angle φ′=30°.Subsequently,an updated value is obtained from Eq.(34).A new iteration starts with the updated value ofφ′until two subsequent iterations yield close values of the effective friction angle,φ′.Fig.2 shows the flow chart of the proposed methodology before and during the iteration process.Once convergence is reached,the clay stiffness and strength parameters are calculated as demonstrated in Fig.3.
5.Validation cases
Five well-reported case studies are analyzed using the proposed approach.The case studies are from different places around the world(i.e.United Kingdom,Japan,Thailand,South Korea and Canada),as shown in Fig.4.The consistency of the clays in these case studies varies from very soft to firm.In two of the cases,the natural water content,wn,exceeds the liquid limit,LL(i.e.Ariake and Champlain clays).As illustrated before,a regression analysis is required to determine the power function that relates the natural water content,wn,and the mean effective stress,p′,in Eqs.(17)and(18).This function is represented by a straight line in the log10wn-log10p′space.Data points used in the regression analyses are to be selected in accordance with the following tentative criteria:
(1)The natural water content,wn,should decrease with the increase of the mean stress,p′.Data points having different trends are to be ignored in the regression analyses.
(2)Outliers(i.e.points that may substantially reduce the coefficient of determinationR2when considered)are removed from the data utilized for the regression analyses.

Fig.16.Index properties and OCR of Bangkok clay case study.Source of data:Bergado et al.(2002).
The measured undrained shear strength of clays in the case studies was mainly determined using vane shear test(VST).In some case studies,clay parameters other than the undrained shear strength(e.g.VS,G0,φ′,K0andNkt)were also reported;these parameters are also compared with the results of the analyses for validation of the proposed approach.
5.1.Bothkennar clay
This site is located in Bothkennar,Scotland,United Kingdom.It has been intensively used for the geotechnical researches related to soft clays.An exhaustive geotechnical site investigation program was carried out that comprised undisturbed sampling with different methods(i.e.block samples,Delft continuous samples and piston samples),installation of piezometers,conducting of piezocones(CPTU),seismic piezocone(SCPTU),VST,dilatometer(DMT),and self-boring pressuremeter(SBPM)(Allman and Atkinson,1992;Hight et al.,1992,2003;Nash et al.,1992;McGinty,2006;Mayne,2016).
Fig.5 shows the liquid limit,LL,plastic limit,PL,natural moisture content,wn,and inferred overconsolidation ratio,OCR.A regression analysis between the natural water content,wn,and effective mean stress,p′,was conducted as shown in Fig.6.The following results are obtained:Iw=572.8,iw=6.35,andmw=0.551.The coefficient of determination,R2,is 0.89.The site-specific shear wave parametersβandbare 0.553 and-1.003,respectively.
Fig.7 shows the predicted DSS undrained strength versus the corrected VST undrained strength.In general,there is a good agreement between the predicted undrained strength and the corrected undrained VST strength except for the few meters near the ground surface.It is noted that different in situ investigations(i.e.CPTU,DMT and VST)conducted as a part of the different site investigation campaigns have shown similar contradictions near the ground surface in this particular site(Mayne,2016).Hence,it is believed that the revealed differences near the ground surface are mainly due to the substantial natural variability of the surficial soil layers at this site.
Fig.8 shows the predicted at-rest earth pressure coefficient,K0,as well as the values inferred from the self-boring pressuremeter SBPM measurements.Fig.9 shows the predicted and the measured values of the shear wave velocityVS.Generally,there is a good agreement between the measurements and the predicted values ofK0andVSexcept for few points near the ground surface for the reasons explained above.
The commonly reported effective friction angle φ′for Bothkennar clay is 34°.Fig.10 shows that the predicted values for the effective friction angle,φ′,generally ranges between 32°and 38°,except for positions near the ground surface where higher values are anticipated.It is realized that the measured and predicted ranges of the effective friction angles are mostly in a good agreement.
5.2.Ariake clays
This experimental site is located in Kyushu Island,Japan.It has been used for studying Ariake soft clays by the Japanese research institutes.The natural water content is generally greater than the liquid limit in this site(generally,110%≤LI≤ 170%).This special aspect gives Ariake site a special importance as the other Japanese soft clay sites have lowerLIvalues(Tanaka et al.,2001).
Fig.11 shows the liquid limit,LL,the plastic limit,PL,the natural moisture content,wn,and the overconsolidation ratio,OCR,at the Ariake site.The predicted values ofOCRare generally in good agreement with the values known for this site,except for the depth of 17 m or deeper(predictedOCR≈1.5;actualOCR≈1.7-2).It is also noted that the soil granulometry also changes abruptly from silty clay(about 50%silt+50%clay)above the depth of 18 m to sandy clay(about 50%sand+50%clay)below that depth(Tanaka et al.,2001).
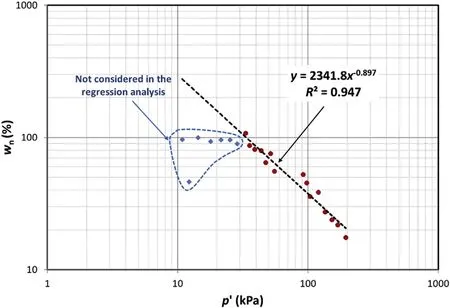
Fig.17.Regression analysis of Bangkok clay case study.Source of data:Bergado et al.(2002).

Fig.18.Undrained shear strength suof Bangkok clay case study.Source of data:Bergado et al.(2002).
The regression analysis between the natural water content,wn,and the effective mean stress,p′,is shown in Fig.12;the results areIw=937.44,iw=6.843,mw=0.582 andR2=0.89.Hence,the site-specific shear wave parameters areβ=0.732 andb=-1.257.Fig.13 shows the predicted undrained strength as well as the measured undrained strength.Fig.14 shows the predicted small strain modulus and values inferred from the shear wave velocity.Fig.15 shows the predicted cone factor,Nkt,as well as the value inferred from the measurement of the cone and the vane shear(Tanaka et al.,2001).
In general,the predicted values ofsu,G0andNktare in good agreement with the measured/reported values except for the depth of 17 m or deeper.The reason for the deviation between the predicted and measuredsuandG0values below this depth is the above-discussed abrupt changes in the clay’sOCRvalues as well as in its granulometry,implying different characteristics below the depths of 17-18 m.
5.3.Bangkok clay
This clay is located approximately 30 km east of Bangkok City.The soil profile at the site consisted of a 2-m thick weathered crust overlying soft to stiff Bangkok clay.AVST was carried out for the top 15 m of the site.Fig.16 shows the liquid limit,LL,the plastic limit,PL,the natural moisture content,wn,and the overconsolidation ratio,OCR,at the site(Bergado et al.,2002).
The results of the regression analysis between the natural water contentwnand the effective mean stressp′,as shown in Fig.17,areIw=2341.8,iw=7.759,mw=0.897 andR2=0.95.Hence,the sitespecific shear wave parameters areβ=0.677 andb=-0.755.The predicted DSS undrained strength is plotted versus the corrected vane shear strength,as shown in Fig.18.Generally,a close agreement between the actual and predicted strengths is observed.
5.4.Busan clay
This site is located in Busan New Port,southeast coastal region of South Korea.Busan clay extends from a depth of approximately 7 m to the end of the exploration depth at 40 m.The natural water contentwnis almost equal to or slightly lower than the liquid limit,LL,for the entire depth.Fig.19 shows the liquid limit,LL,plastic limit,PL,natural moisture content,wn,and overconsolidation ratio,OCR,at the site(Choo et al.,2016).
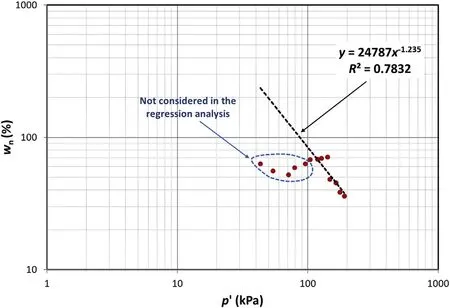
Fig.20.Regression analysis of Busan clay case study.Source of data:Choo et al.(2016).

Fig.19.Index properties and OCR of Busan clay case study.Source of data:Choo et al.(2016).
Regressionanalyses between the natural watercontent(wn)and the effective mean stressp′,as shown in Fig.20,were carried out.The results areIw=24787,iw=10.118,mw=1.235 andR2=0.78.Hence,the site-specific shear wave parameters areβ=1.214 andb=-0.983.The predicted DSS undrained strength is plotted versus the corrected vane shear strength,as shown in Fig.21.A close agreement between the measured and predicted undrained strengths is generally observed.

Fig.21.Undrained shear strength suof Busan clay case study.Source of data:Choo et al.(2016).
5.5.Champlain clay
This experimental site is located in Quebec,Canada.The prevailing formation,often termed as Champlain clay,is mainly soft sensitive cemented silty clay that has low-to-medium plasticity.One of the main characteristics of this clay is having natural water content,wn,that is substantially higher than its liquid limit,LL(generally,140%≤LI≤270%).Fig.22 shows the liquid limit,LL,plastic limit,PL,natural moisture content,wn,and the inferred overconsolidation ratio,OCR,at this site.In addition to the undrained strengths inferred from the VST,the undrained shear strength that corresponded to the failure of a full-scale test embankment was also back-calculated.The depth of failure was about 7-9 m from the ground surface.The undrained strength ratiosu/σ′pfor the clay mass within the failure zone was estimated to be 0.22(Rochelle et al.,1974).
Regression analyses between the natural water content(wn)and the effective mean stressp′were carried out,as shown in Fig.23.The results areIw=318.47,iw=5.763,mw=0.499 andR2=0.56.The site-specific shear wave parameters areβ=0.421 andb=-0.843.The predicted DSS undrained strength versus the corrected vane shear strength is plotted in Fig.24.The predicted strength is generally in a good agreement with the back-calculated undrained strength and corrected VST undrained strength from the ground surface till reaching the depth of the failure surface.At the failure surface(i.e.at the depths of 7-9 m from the ground surface),the analysis predicts the undrained strengths of much lower value than the VST and the back-calculated undrained strengths.This may be due to reaching the post-peak low undrained strength at the failure surface.

Fig.22.Index properties and OCR of Champlain clay case study.Source of data:Rochelle et al.(1974).
Below the failure zone(i.e.deeper than 7-9 m from the ground surface),the predicted strength approaches again the VST undrained strength,which is higher than the back-calculated strength.These results are acceptable since the back-calculated strength is limited to the depth of the failure zone(i.e.at depths shallower than 7-9 m from the ground surface).The anticipated relatively high undrained strength below the depth of the failure zone explains the reason that the failed soil mass did not extend below that depth.
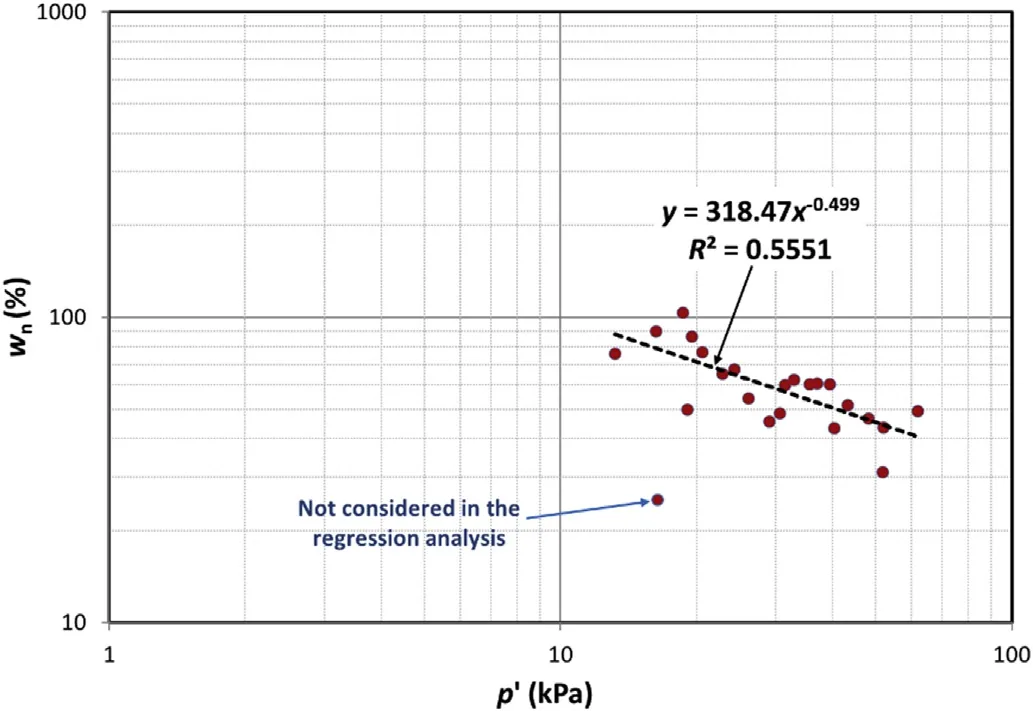
Fig.23.Regression analysis of Champlain clay case study.Source of data:Rochelle et al.(1974).

Fig.24.Undrained strength suof Champlain clay case study.Source of data:Rochelle et al.(1974).
6.Limitations and advantage of the proposed approach
Based on the results obtained in the five case studies,the suggested methodology may be utilized to determine the stiffness and strength parameters of clay layers,which is however subjected to the following constraints:
(1)The analyzed clay layers should have nearly unified geological setting,clay mineralogy and granulometry.
(2)Water content and Atterberg limits should be accurately determined.Low-quality geotechnical site investigations may produce unreliable index parameters.
(3)Water content and Atterberg limits should be frequently determined(e.g.at a spacing of 1 m along the clay depth)to ensure that the data are sufficient to conduct a reliable regression analysis.
(4)The trend of decreasing water content with increasing effective stress for a number of the points should be included in the results.In the absence of this trend,the presented approach cannot be utilized.
(5)The vertical effective stress profile should be determinable.This may limit the use of the presented approach in under-consolidated clays,as the effective stress profiles are varied with depth and time,and thus cannot be easily determined.
Conversely,there are advantages of the presented approach as follows:
(1)It depends on simple tests that are often carried out for soil classification.
(2)It is site-specific,as it depends on a regression analysis relating the water contentwnto the mean effective stressp′for the site under consideration.
7.Conclusions
A new approach is presented to relate the shear wave velocity,VS,and small-strain shear modulus,G0,to the index properties of saturated soft to firm clays using the site-specific variation of the natural water content,wn,with the effective mean stress,p′.The clay stiffness and strength parameters as well as the CPT modulus of rigidityIrand bearing factorNktare assessed based on the presented approach.
The suggested approach is used as an iterative methodology rather than direct correlations.It utilizes the relationships between clay strength and stiffness inferred from the critical state mechanics.The analysis starts with an assumption of the effective friction angle φ′that is enhanced with the progress of the iterations until convergence is achieved.The proposed iterative scheme,which is described in the flowcharts shown in Figs.2 and 3,can be performed using a simple EXCEL spreadsheet.
Five case studies in the United Kingdom,Japan,Thailand,South Korea,and Canada,respectively,were analyzed using the presented approach.It is shown that the suggested approach provides acceptable estimates of the strength and the stiffness of clays using their index properties.
Conflicts of interest
The author wishes to confirm that there are no known conflicts of interest associated with this publication and there has been no significant financial support for this work that could have influenced its outcome.
Acknowledgments
The author would like to express his sincere gratitude to Prof.F.M.El-Nahhas for his kind advices during the preparations of this study.The author would also like to acknowledge the efforts of the anonymous reviewers of the Journal of Rock Mechanics and Geotechnical Engineering(JRMGE).Their constructive comments helped the author to enhance the contents and the presentation of this paper.
Appendix A.Supplementary data
Supplementary data related to this article can be found at https://doi.org/10.1016/j.jrmge.2017.10.006.
List of symbols
aParameter related to the site-speci fi cVS-e0relationship
bVoid ratio exponent in the site-specificVS-e0relationship
CCCompression index
CIUC Consolidated isotropic undrained triaxial compression
DS Sample discrimination function to determineσ′
p
DSS Direct simple shear
e0Natural void ratio,e0=GSwn/100 for saturated soils
EoedConstrained/oedometric modulus
GOperative secant shear modulus,G=G50
gGravitational acceleration,g=9.81 m/s2
G0Small-strain shear modulus(i.e.at shear strains less than
G50Shear secant modulus at a shear stress equal to 50%of the ultimate shear stress
GSSpecific gravity
IeParameter inp′-e0relationship
ieParameter inp′-e0relationship,ie=lnIe
IrRigidity index,Ir=G/su
Ir,CIUCRigidity index for the CIUC case
Rigidity index for the cone penetration test,Ir,cone=Ir,DSS
Ir,DSSRigidity index for the DSS case
IwParameter inp′-wnrelationship
iwParameter inp′-wnrelationship,iw=lnIw
K0at-rest earth pressure coefficient
LIliquidity index,LI=100(wn-PL)/PI(expressed as a percentage)
LLLiquid limit(expressed as a percentage)
meStress exponent ine0-p′relationship
mwStress exponent inwn-p′relationship
MStrength parameter in the Cam Clay Model
NktBearing capacity factor related to the cone penetration
OCROverconsolidation ratio
p′Effective mean stress,p′=(1+2K0)σ′v0/3
paAtmospheric pressure,pa≈100 kPa
PIPlasticity index(expressed as a parentage),PI=LL-PL
PLPlastic limit(expressed as a parentage)
qtTotal cone resistance
R2Coefficient of determination
SBPM Self-boring pressuremeter
suUndrained shear strengthsu,CIUCUndrained shear strength obtained from the CIUC triaxial test
su,DSSUndrained shear strength obtained from the DSS test
TC Triaxial compression
TE Triaxial extension
VSShear wave velocity
VS,e0Shear wave velocity estimated using a site-specific Correlation withe0
VS,p′Shear wave velocity estimated using a site-specific correlation withp′
VST Field shear vane test
wnNatural water content(expressed as a percentage)
α Parameter in theVS-p′site-specific relationship
β Stress exponent in theVS-p′site-specific relationship
φ′Effective friction angle
φcsCritical state friction angle

Allman MA,Atkinson JH.Mechanical properties of reconstituted Bothkennar soil.Géotechnique 1992;42(4):289-301.
Ameratunga J,Sivakugan N,Das BM.Correlations of soil and rock properties in geotechnical engineering.Springer;2015.
Atkinson JH.Nonlinear soil stiffness in routine design.Géotechnique 2000;50(5):487-508.
Benz T.Small-strain stiffness of soils and its numerical consequences.Institut für Geotechnik,Universität Stuttgart;2007.
Bergado DT,Balasubramaniam AS,Fannin RJ,Holtz RD.Prefabricated vertical drains(PVDs)in soft Bangkok clay:a case study of the new Bangkok International Airport project.Canadian Geotechnical Journal 2002;39(2):304-15.
Burland JB.Ninth Laurits Bjerrum Memorial Lecture: “Small is beautiful”-the stiffness of soils at small strains.Canadian Geotechnical Journal 1989;26(4):499-516.
Choo H,Lee W,Hong SJ,Lee C.Application of the dilatometer test for estimating undrained shear strength of Busan New Port clay.Ocean Engineering 2016;115:39-47.
Clayton CRI.Stiffness at small strain:research and practice.Géotechnique 2011;61(1):5-37.
Elhakim AF.Evaluation of shallow foundation displacements using soil small-strain stiffness.Georgia Institute of Technology;2005.
Hardin BO,Richart JFE.Elastic wave velocities in granular soils.Journal of the Soil Mechanics and Foundations Division 1963;89(1):33-65.
Hardin BO.The nature of stress-strain behavior for soils.In:Proceedings of earthquake engineering and soil dynamics,ASCE,Pasadena,19-21 June 1978.American Society of Civil Engineers;1978.p.3-89.
Hight DW,Bond AJ,Legge JD.Characterization of the Bothkennar clay:an overview.Géotechnique 1992;42(2):303-47.
Hight DW,Gasparre A,Nishimura S,Minh NA,Jardine RJ,Coop MR.Characteristics of the London clay from the terminal 5 site at Heathrow airport.Géotechnique 2007;57(1):3-18.
Hight DW,Paul MA,Barras BF,Powell JJM,Nash DFT,Smith PR,Jardine RJ,Edwards DH.The characterisation of the Bothkennar clay.In:Characterisation and engineering properties of natural soils.A.A.Balkema;2003.p.543-98.
Hussien MN,Karray M.Shear wave velocity as a geotechnical parameter:an overview.Canadian Geotechnical Journal 2016;53(2):252-72.
Kootahi K,Mayne PW.Index test method for estimating the effective preconsolidation stress in clay deposits.Journal of Geotechnical and Geoenvironmental Engineering 2016;142(10). https://doi.org/10.1061/(ASCE)GT.1943-5606.0001519.
Krage CP,Broussard NS,DeJong JT.Estimating rigidity index(IR)based on CPT measurements.In:Proceedings of the 3rd international symposium on cone penetration testing;2014.p.727-35.
Ku T,Subramanian S,Moon SW,Jung J.Stress dependency of shear-wave velocity measurements in soils.Journal of Geotechnical and Geoenvironmental Engineering 2016;143(2).https://doi.org/10.1061/(ASCE)GT.1943-5606.0001592.
Kulhawy FH,Mayne PW.Manual on estimating soil properties for foundation design.EPRI EL-6800,Palo Alto,CA,USA.Ithaca,NY,USA:Cornell University;1990.
L’Heureux JS,Long M.Correlations between shear wave velocity and geotechnical parameters in Norwegian clays.In:The 17th nordic geotechnical meetingchallenges in Nordic Geotechnic(NGM 2016);2016.p.299-308.
Mayne PW,Kulhawy FH.K0-OCR relationships in soil.Journal of the Geotechnical Engineering Division 1982;108:851-72.
Mayne PW.Stress-strain-strength- fl ow parameters from enhanced in-situ tests.In:International conference on in situ measurement of soil properties&case histories;2001.p.27-47.
Mayne PW,Christopher BR,DeJong J.Manual on subsurface investigations.Publication No.FHWA NHI-01-031.Washington,D.C.:National Highway Institute,Federal Highway Administration;2001.
Mayne PW.Interpretation of geotechnical parameters from seismic piezocone tests.In:Proceedings of the 3rd international symposium on cone penetration testing(CPT’14,Las Vegas);2014.p.47-73.
Mayne PW.Evaluating effective stress parameters and undrained shear strengths of soft- firm clays from CPTu and DMT.In:The 5th international conference on site characterization (ISC-5).Gold Coast,Brisbane,Australia:Australian Geomechanics Society;2016.p.27-55.
McGinty K.The stress-strain behaviour of Bothkennar clay.University of Glasgow;2006.
Moon SW,Ku T.Empirical estimation of soil unit weight and undrained shear strength from shear wave velocity measurements.In:The 5th international conference on geotechnical and geophysical site characterisation.Sydney,Australia:Australian Geomechanics Society;2016a.p.1247-52.
Moon SW,Ku T.Development of global correlation models between in situ stressnormalized shear wave velocity and soil unit weight for plastic soils.Canadian Geotechnical Journal 2016b;53(10):1600-11.
Nash DFT,Powell JJM,Lloyd IM.Initial investigations of the soft clay test site at Bothkennar.Géotechnique 1992;42(2):163-81.
Rochelle P La,Trak B,Tavenas F,Roy M.Failure of a test embankment on a sensitive champlain clay deposit.Canadian Geotechnical Journal 1974;11(1):142-64.
Santamarina JC,Klein KA,Fam MA.Soils and waves:particulate materials behavior,characterization and process monitoring.Wiley&Sons Inc.;2001.
Skempton AW.The consolidation of clays by gravitational compaction.Quarterly Journal of the Geological Society 1970;125(1-4):373-411.
Sorensen KK,Okkels N.Correlation between drained shear strength and plasticity index of undisturbed overconsolidated clays.In:Proceedings of the 18th international conference on soil mechanics and geotechnical engineering;2013.p.423-8.
Tanaka H.Re-examination of established relations between index properties and soil parameters.In:Nakase A,Tsuchida T,editors.Proceedings of the International Symposium on Coastal Geotechnical Engineering in Practice,vol.2.Yokohama:A.A.Balkema;2002.p.3-25.
Tanaka H,Locat J,Shibuya S,Soon TT,Shiwakoti DR.Characterization of Singapore,Bangkok,and Ariake clays.Canadian Geotechnical Journal 2001;38(2):378-400.
Wroth CP,Wood DM.The correlation of index properties with some basic engineering properties of soils.Canadian Geotechnical Journal 1978;15(2):137-45.
Yu HS,Herrmann LR,Boulanger RW.Analysis of steady cone penetration in clay.Journal of Geotechnical and Geoenvironmental Engineering 2000;126(7):594.https://doi.org/10.1061/(ASCE)1090-0241(2000)126:7(594).
 Journal of Rock Mechanics and Geotechnical Engineering2018年3期
- Journal of Rock Mechanics and Geotechnical Engineering的其它文章
- Numerical simulation of the behaviors of test square for prehistoric earthen sites during archaeological excavation
- Velocity of detonation measurement and fragmentation analysis to evaluate blasting efficacy
- Geostructural stability assessment of cave using rock surface discontinuity extracted from terrestrial laser scanning point cloud
- Optimization of dewatering schemes for a deep foundation pit near the Yangtze River,China
- Discussion on“Empirical methods for determining shaft bearing capacity of semi-deep foundations socketed in rocks”[J Rock Mech Geotech Eng 6(2017)1140-151]
- Reply to Discussion on“Empirical methods for determining shaft bearing capacity of semi-deep foundations socketed in rocks”
