
Bias correction and projection of surface air temperature in LMDZ multiple simulation over central and eastern China
2018-05-24 07:48:19GUOLinYiGAOQinJIANGZhiHongLurentLI
GUO Lin-Yi,GAO Qin,b,JIANG Zhi-Hong,*,Lurent LI,c
a Key Laboratory of Meteorological Disaster,Ministry of Education,Joint International Research Laboratory of Climate and Environment Change,Collaborative Innovation Center on Forecast and Evaluation of Meteorological Disasters,Nanjing University of Information Science&Technology,Nanjing 210044,China
b Jiaxiang County Meteorological Service,Jining 272400,China
c Laboratory of Meteorological Dynamics,UPMC/CNRS,IPSL,Paris 75005,France
1.Introduction
Climate models are important tools for climate simulation and projection of future climate change(Zhao,2006).The global model(GCM)cannot accurately describe regional climatic characteristics due to coarse resolution(Gao et al.,2006;Jiang et al.,2016).Therefore,a regional climate model(RCM)driven by the outputs of the GCM needs to be applied over an area of interest to generate finer scale projections of local climatologies(Xu et al.,2007;Zhang et al.,2008).This technique is usually referred to as dynamical downscaling.Some studies(Chen et al.,2011;Ji and Kang,2015;Yu et al.,2015;Gao et al.,2016;Yang et al.,2016;Zhang et al.,2017)have shown that LMDZ,PRECIS,WRF,and RegCM4 have good simulation ability for the regional and seasonal scales of geographical and seasonal variations in temperature and precipitation in China.However,dynamical downscaling may remain large errors,on the one hand,as a result of the regional model itself,such as physical processes,and on the other hand,having been inherited from the driving GCM(Dosio and Paruolo,2011).
The bias correction is an important means to reduce biases of the model results(Ines and Hansen,2006;Yang et al.,2010,2017;Zhou et al.,2014a,b;Tong et al.,2017).One way of bias correction is to construct a transfer function(TF)to match the cumulative distribution functions(CDF)of modelled and observed data from large-scale climatic variables(e.g.temperature and precipitation),such as CDF-transform method(CDF-t)and equidistant CDF matching method(EDCDFm).Michelangeli et al.(2009) first applied the CDF-t method to GCM outputs fields to project changes in wind intensity anomalies.Thereafter,many studies have applied this method to the correction of temperature and precipitation in different regions,and all of them have a better correction effect(Lavaysse et al.,2012;Vrac et al.,2012;Vigaud et al.,2013;Flaounas et al.,2013;Farajzadeh et al.,2015).The EDCDFm method is proposed on the basis of the quantile mapping method by Li et al.(2010),and is applied to the projection of precipitation and temperature field in northern Europe.The results show that compared with the quantile mapping method,the proposed method is more sensitive to the reduction in variability and biases.However,these two methods are rarely applied in China.All relevant studies are aimed at GCM and lack in biases correction of dynamical downscaling results(Jiang et al.,2012;Li et al.,2013;Zhou and Jiang,2017).
In addition,the 2015 Paris Agreement aims to limit the global mean temperature increase to below 2°C or even 1.5°C above pre-industrial levels.Relative to the 2°C global warming target,the occurrence frequencies and impact of extreme events under the 1.5°C target would be drastically reduced(Schaeffer et al.,2012;Fischer and Knutti,2015;Knutti et al.,2016),and thus it's worth getting more attention.Previous studies analyzed the response characteristics mainly by the means of GCMs(Jiang et al.,2009;Guo et al.,2016;Hu et al.,2017;Shi et al.,2018).However,there was not high credibility in fine features of regional response obtained by GCMs.In this paper,combining multi-model dynamical downscaling with bias correction methods could improve the credibility of regional response.
In this study,based on dynamical downscaling daily mean,minimum,and maximum temperature data from LMDZ4,which is nested into five GCMs(bcc-csm1-1-m,CNRM-CM5,FGOALS-g2,IPSL-CM5A-MR,and MPI-ESM-MR),the EDCDFm and CDF-t methods are used to evaluate the ability of the models to simulate extreme surface air temperature over central and eastern China.On this basis,the better method is used to project the regional temperature change in the early(2017-2036),middle(2046-2065),and late(2080-2099)21st century under the RCP4.5 emission scenario,and analyze the response characteristics of extreme temperature in the study area under the global warming 1.5°C and 2°C,relative to 1986-2005.
2.Data and methods
2.1.Datasets
The dynamic downscaling LMDZ4 is the atmospheric component of the coupled model IPSL-CM5A that participates in the Coupled Model Intercomparison Project Phase 5(CMIP5)(Hourdin et al.,2006;Taylor et al.,2012;Dufresne et al.,2013).The model center is set at 30°N,110°E;the range of encryption is 5°-55°N,85°-135°E;and the simulated horizontal resolution is approximately 60 km and with 19 layers in the vertical direction.Dynamical downscaling daily mean,minimum,and maximum temperature data from LMDZ4,which is nested into five GCMs(namely,bcc-csm1-1-m,CNRM-CM5,FGOALS-g2,IPSL-CM5A-MR,and IPSL-CM5A-MR)are chosen.Basic information on the models is shown in Table 1.The data are divided into two phases: historical (1961-2005) and estimated period(2006-2100).The previous data are used for calibration and verification of the bias correction,and the posterior data are used for projection of future temperature change.The 0.5°×0.5°daily maximum and minimum temperature datasets,which are based on the interpolation of 753 meteorological station observations from the China Meteorological Administration,are used as observations(Xu et al.,2009).For convenience of comparison,the bilinear interpolation method is used to interpolate the model outputs to the same grid as observed data.Considering the obvious variation of terrain in different regions of central and eastern China,we divided the study area into seven regions to compare the difference between the global model and the downscaled model for extreme temperature(Zou and Zhou,2013;Dong et al.,2015);these regions are Northeast China(NE,42°-55°N,105°-132°E),North China(NC,35°-42°N,105°-122°E),Yangtze River Valley(YZ,28°-35°N,105°-122°E),Southeast China(SE,19°-28°N,105°-122°E),Tibetan Plateau(TP,27°-36°N,86°-105°E),Southwest China(SW,22°-27°N,96°-105°E),and Northwest China(NW,36°-50°N,86°-105°E),as shown in Fig.1.
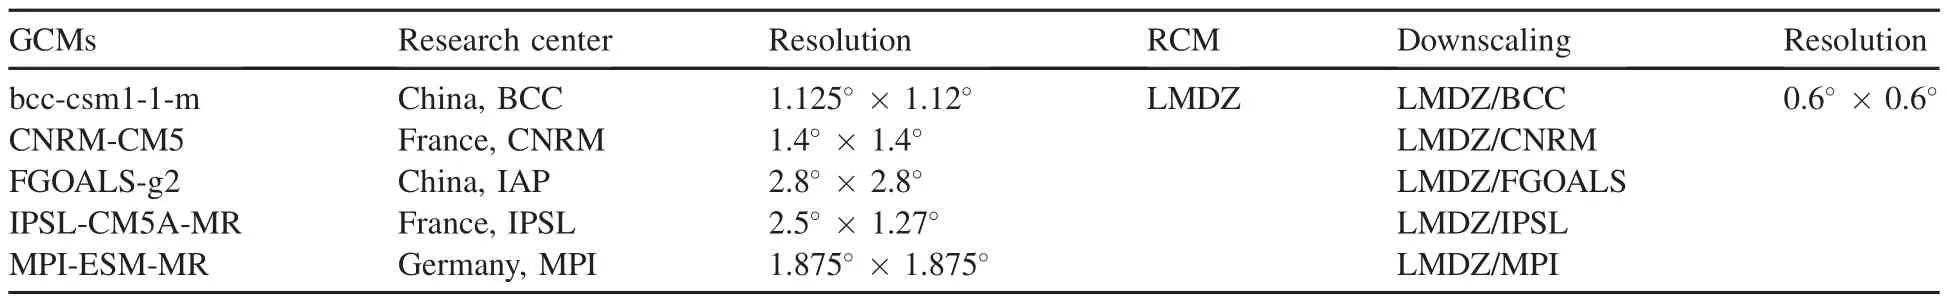
Table 1Basic information of models.
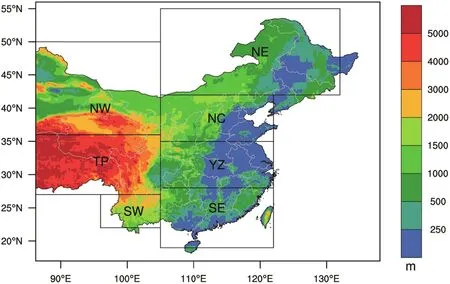
Fig.1.Study areas and their topography.
2.2.Extreme temperature indices
In order to comprehensively investigate the EDCDFm and CDF-t method's abilities in simulating extreme surface air temperature over central and eastern China,and four extreme temperature indices are employed.The first two are mean maximum temperature(TXAV)and mean minimum temperature(TNAV),which can directly describe the model to simulate the strength of extreme temperature capability.The third indice is frost days(FD),which describes the length of frost days in the middle-to-high latitudes.The fourth is heat wave duration indice(HWDI),which re flects the duration of summer high temperatures.The specific definitions can be found in Table 2(Frich et al.,2002;Jiang et al.,2017).
2.3.Bias correction methods
2.3.1.Cumulative distribution function transform method(CDF-t)
The CDF-t method is based on the assumption that a transform functionTexists,which establishes the relationship between the CDF of the observed and modelled outputs.LetFShstand for the CDF of observed daily temperature data at a given grid cell over a historical period,andFGhstand for the CDF of model outputs at the given grid cell for the same period.FGfandFSfare the CDFs equivalent toFGhandFShbut for a future period.
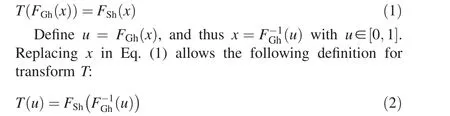
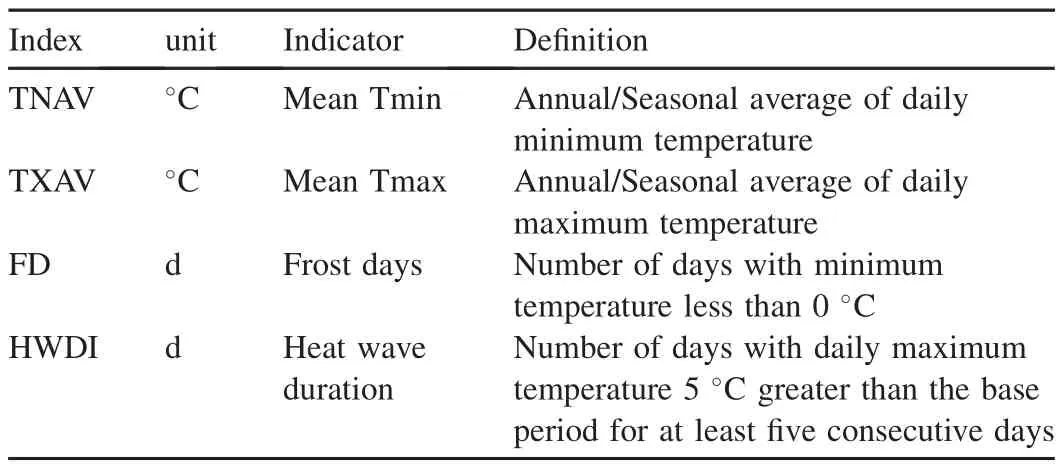
Table 2The definition of extreme indices.
In whichTdenotes the functional relationship between the CDF of observation and simulation results over a historical period.Thus,assuming that relationship in Eq.(2)will remain valid in the future,and the corrected CDF is given by

Following Michelangeli et al.(2009),the CDF-t is then defined in two steps.First, fit non-parametrically the observed and modelled variables over a historical period and establish the functional relation betweenFShandFSf.Then,use the modelled projectionxand estimate the CDF of the future climate projection referring toFSfbased on Eq.(3).Flaounas et al.(2013)pointed out that the uncertainty associated with CDF-t increases significantly when performing seasonal distinction without beneficial effect of considering the seasonality of the extremes due to smoothed spatial and temporal variability of the extremes.Therefore,we use the CDF-t method to monthly correct the daily temperature at the given grid cell.
2.3.2.Equidistant cumulative distribution function matching method(EDCDFm)
The EDCDFm method is based on the assumption that for a given percentile,the difference between the model and observed value during the historical period also applies to the future period,which means that the adjustment function remains the same.Meanwhile,the difference between the CDFs for the future and historical periods is also considered.The method can be written mathematically as

LetFShandFGhstand for the CDF of observed and models outputs at a given grid cell over a historical time period,respectively.FGfis the CDF equivalent ofFGhbut for a future period.XGfdenotes the future modelled outputs.XGf.adjustrepresents the future corrected outputs by the EDCDFm method.Fig.2 illustrates the specific principle.Firstly,for a fixed grid, fit parametrically the historical observation,the historical modelled outputs and the future modelled outputs following the normaldistribution.Secondly,whenXGf=-10,and thusFGf(XGf)=0.2.For the corresponding current climate,the difference betweenFS-h1(0.2)andFG-h1(0.2)is defined as Δxand transfer Δxinto the future period.Finally,the corrected value is-10+Δx.
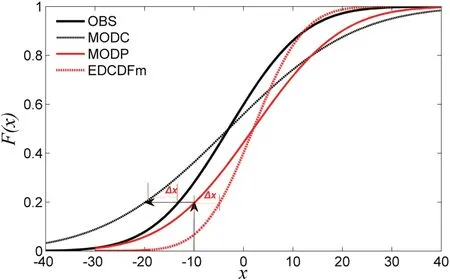
Fig.2.Illustration of methodology(OBS:observation;MODC:model simulation for current climate;MODP:model simulation for future projection;EDCDFm:the corrected values by the EDCDFm method).
In this paper,the historical period(1961-2005)is divided into two parts:the control period(1966-1985),in which the observation and model data are used to establish the TF,and the verification period (1986-2005).By outputting the correction results of the early (2017-2036), middle(2046-2056),and late(2080-2099)periods of the 21st century,we examine the characteristics of future temperature changes over central and eastern China.The model spreads(i.e.,mean square error between modes)are used to analyze the uncertainty of the model estimates(Li and Zhou,2010).During the validation and projection periods,the average of the five models before and after the correction is used as the analysis result.
2.4.Arrival time point of 1.5 °C and 2 °C global warming target
The global averaged temperature anomalies in the 21st century under the RCP4.5 emission scenario are dealt by 21-year running average.The year firstly arriving the 1.5°C and 2°C warming target is defined as the 1.5°C and 2°C year,respectively.Selecting the arrival time points and the individual 10 years before and after these points add up to 21 years as the study period.The response characteristics of extreme temperature over central and eastern China under the global warming of 1.5°Cand 2°Care analyzed relative to the pre-industrialperiod.Table 3 shows the specific time points and study periods of five GCMs for the 1.5°C and 2°C global warming target.
3.Comparison of various correction methods in current climate
3.1.Comparison of mean temperature space fields
The observed temperature data and five dynamical downscaling outputs during 1966-1985 are used to establish the transform functionsT,respectively.Then,the functional relations were applied to estimate five corrected downscaling results for 1986-2005.The simulation capabilities of the EDCDFm and CDF-t methods were evaluated in the study area by comparing them with the observation data.As shown in Fig.3,the multi-model dynamic downscaling can simulate the spatial distribution of the daily mean temperature(TAV)over central and eastern China,but an average bias of-1.15°C.The cold anomalies in TP,SW,and southeastern coastal areas are obvious;for example,in the TP and SW regions,the cold anomalies are more than 3°C and 2°C,respectively.A weak warm bias occurs in the NC and YZ regions(Fig.3b).The EDCDFm and CDF-t methods have a significant improvement in the spatial distribution of TAV(Fig.3c and d).The biases in most regions are below 0.5°C.Compared with dynamic downscaling,the biases of correction in the entire study region still show weak cold bias,but the intensity is significantly reduced and the absolute errors of TAV reduce to-0.15°C(Table 4).Northern China shows weak cold biases and southern China exhibits weak warm biases,especially in the TP region where the correction effect is significant and the bias is reduced to 0.07°C.
In order to further examine the spatial simulation ability of the EDCDFm and CDF-t methods,the absolute errors of TAV between observation and simulation during the period 1986-2005 are calculated.Fig.4 illustrates the absolute errors before and after correction for TAV during the period 1986-2005 for seven subregions.The results show that the simulation results of models are poor,especially in the NW and TP regions,where the median absolute errors are-1°C and-3°C,respectively.The absolute errors after correction are reduced significantly,as the median absolute errors in all regions are close to 0°C,and the range of the 25th and 75th quantile percentile errors are significantly reduced,especially in the NW and TP regions where the median is reduced to 0.3°C and 0°C.In addition,in most areas,the EDCDFm method is slightly better than the CDF-t method;for example,the bias range of the EDCDFm method is less than that of the CDF-t method,especially in the SE,TP,and SW regions.
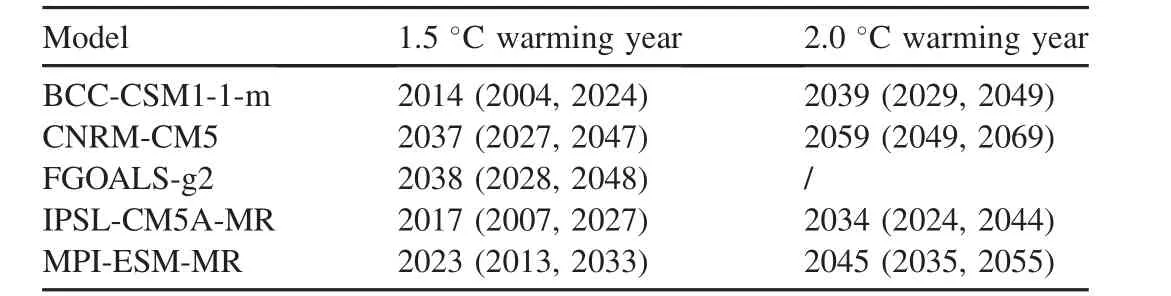
Table 3The time points and study periods of five global models under global warming at 1.5 °C and 2.0 °C.
3.2.Comparison of TAV annual change
The central and eastern parts of China are located in a typical monsoon climate region,and the seasonal characteristics of temperature are obvious.Therefore,investigating the simulation ability of the annual circle in different regions before and after correction is necessary.The seasonal changes in the absolute biases of TAV(Fig.5)shows that a cold bias of less than-1°C occurs in spring,autumn,and winter,as simulated by dynamical downscaling,while a warm bias occurs in the summer,especially in July and August,when the biases are greater than 0.5°C(Fig.5a).The seasonal biases after EDCDFm method correction are reduced significantly,and during most of the months,these biases are below 0.5°C,indicating that the TAV seasonal change curve is almost coincident with the observation(Fig.5a).Although the biases of the CDF-t method have decreased,a cold bias of more than 1°C still occurs in January and February.
For the various regions(Fig.5),simulations of dynamical downscaling show warm biases in NE,NC,YZ,and NW in the summer,while other seasons show cold biases,and in most of the months,the biases are greater than 1°C.Warm biases occur during March-June in SC,and are more than 1.5°C in March and April.However,in the TP and SW regions,the model biases are the largest,and the annual biases are mainly cold,especially in winter;for example,the winter bias in the TP region reaches-5°C.After the correction of the EDCDFm method,the biases in each region are significantly reduced;specifically,the monthly biases in the YZ,TP,and SW regions are reduced to less than 0.5°C.For various seasons,the EDCDFm method has the most obvious improvement in winter;for example,in the TP region,the bias is almost 0°C.The biases of the CDF-t method have decreased,which is consistent with the result of the EDCDFm method.In contrast to the correction effect of the two methods,the temperature change curve of the EDCDFm method is closer to that of the CDF-t method in most areas,especially in January and February;for example,the biases of the EDCDFm method are below 0.5°C in the NC,NW,and YZ regions,while the biases after the CDF-t method correction are still greater than 1°C.
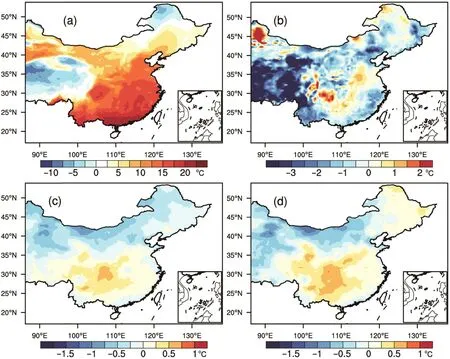
Fig.3.Spatial pattern of bias between observed mean daily temperature and simulations during 1981-2005:(a)observation,(b)observation minus model simulation,(c)EDCDFm simulation minus observation,and(d)CDF-t simulation minus observation.
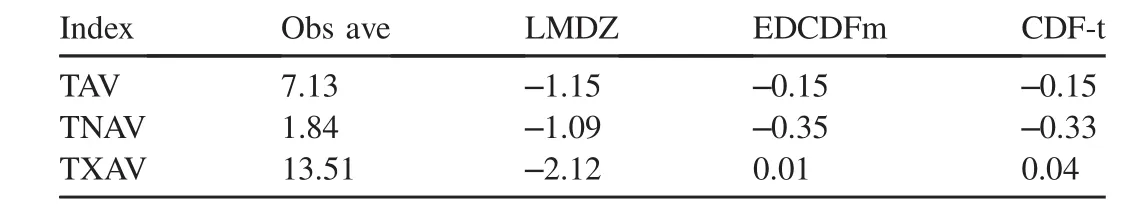
Table 4Bias between observation and simulation before and after correction for TAV,TNAV,and TXAV(unit:°C).
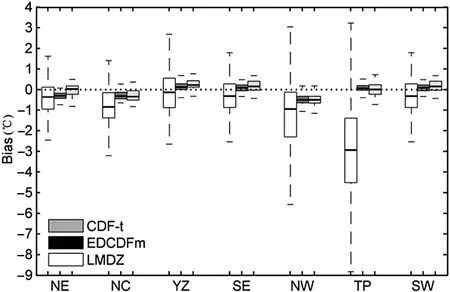
Fig.4.Box plot of absolute errors between observed and simulated values for each region.
In summary,the EDCDFm and CDF-t methods can reduce the biases between the model simulation and the observation,so that the seasonal variation curve is basically coincident with the observation,particularly in the TP and SW regions where the correction effect is remarkable.However,the temperature change curve of the EDCDFm method is closer to the observation than that of the CDF-t method.
3.3.Comparison of extreme temperature space fields
To test the simulation capabilities of extreme temperature before and after correction,the spatial distributions of the extreme temperature indices during 1986-2005 are compared with the corresponding observation field,as shown in Fig.6.The biases of TNAV and TXAV in the study area were-1.09°C and-2.12°C,respectively(Table 2).Warm biases are observed in the northern region and cold biases in the southern region for TNAV.The cold biases are the highest in the TP and SW regions,reaching 4°C(Fig.6b).Although TXAV in YZ and the Sichuan Basin region shows warm bias,other areas exhibit cold biases.The biases of the EDCDFm and CDF-t methods are significantly reduced,and the national mean biases of TXAVand TNAVare reduced to less than 0.35°C(Table 2).TNAV shows weak cold bias in NE,Inner Mongolia,and the western region(Fig.6c and d),whereas NC,YZ,and SE exhibit warm bias of less than 0.3°C;however,the warm biases in the Sichuan Basin are 0.3-0.6°C(Fig.6c and d).For TXAV(Fig.6g and h),cold biases are observed in Inner Mongolia and the northern part of the TP,and the other regions show a warm bias,which is relatively large in the SW region.
For the national mean FD,the model simulation is 17.7 d higher than the observation,while the biases of the two correction methods are reduced to 5 d.From the spatial distribution of the biases of FD before and after correction,one can see that the model-simulated FD in NE are lower than the observation,and the other regions show positive biases,especially in the southern TP,YZ,and SW for more than 40 d(Fig.6j).After the correction of the two methods,the biases in most regions are significantly reduced;a large decrease is observed in the large negative biases in the NE and the large positive biases in the YZ areas.The biases of the EDCDFm method are significantly smaller than that of the CDF-t method in NE,Inner Mongolia,and NW regions.
For HWDI,the model simulations of northern NW,Hetao,and parts of SE are lower than the observation with negative biases of more than 4 d,while positive biases are observed in TP and SW(Fig.6n).After the correction of the EDCDFm method(Fig.6o),the negative biases of NW and the positive biases of TP and SW are reduced significantly,but no improvement is observed in the Hetao region.The negative biases of the CDF-t method have slightly increased in Hetao and southern TP(Fig.6p).This result indicates that the same method has varying effects on different regions,and the biases of the EDCDFm method is slightly lower than those of the CDF-t method.
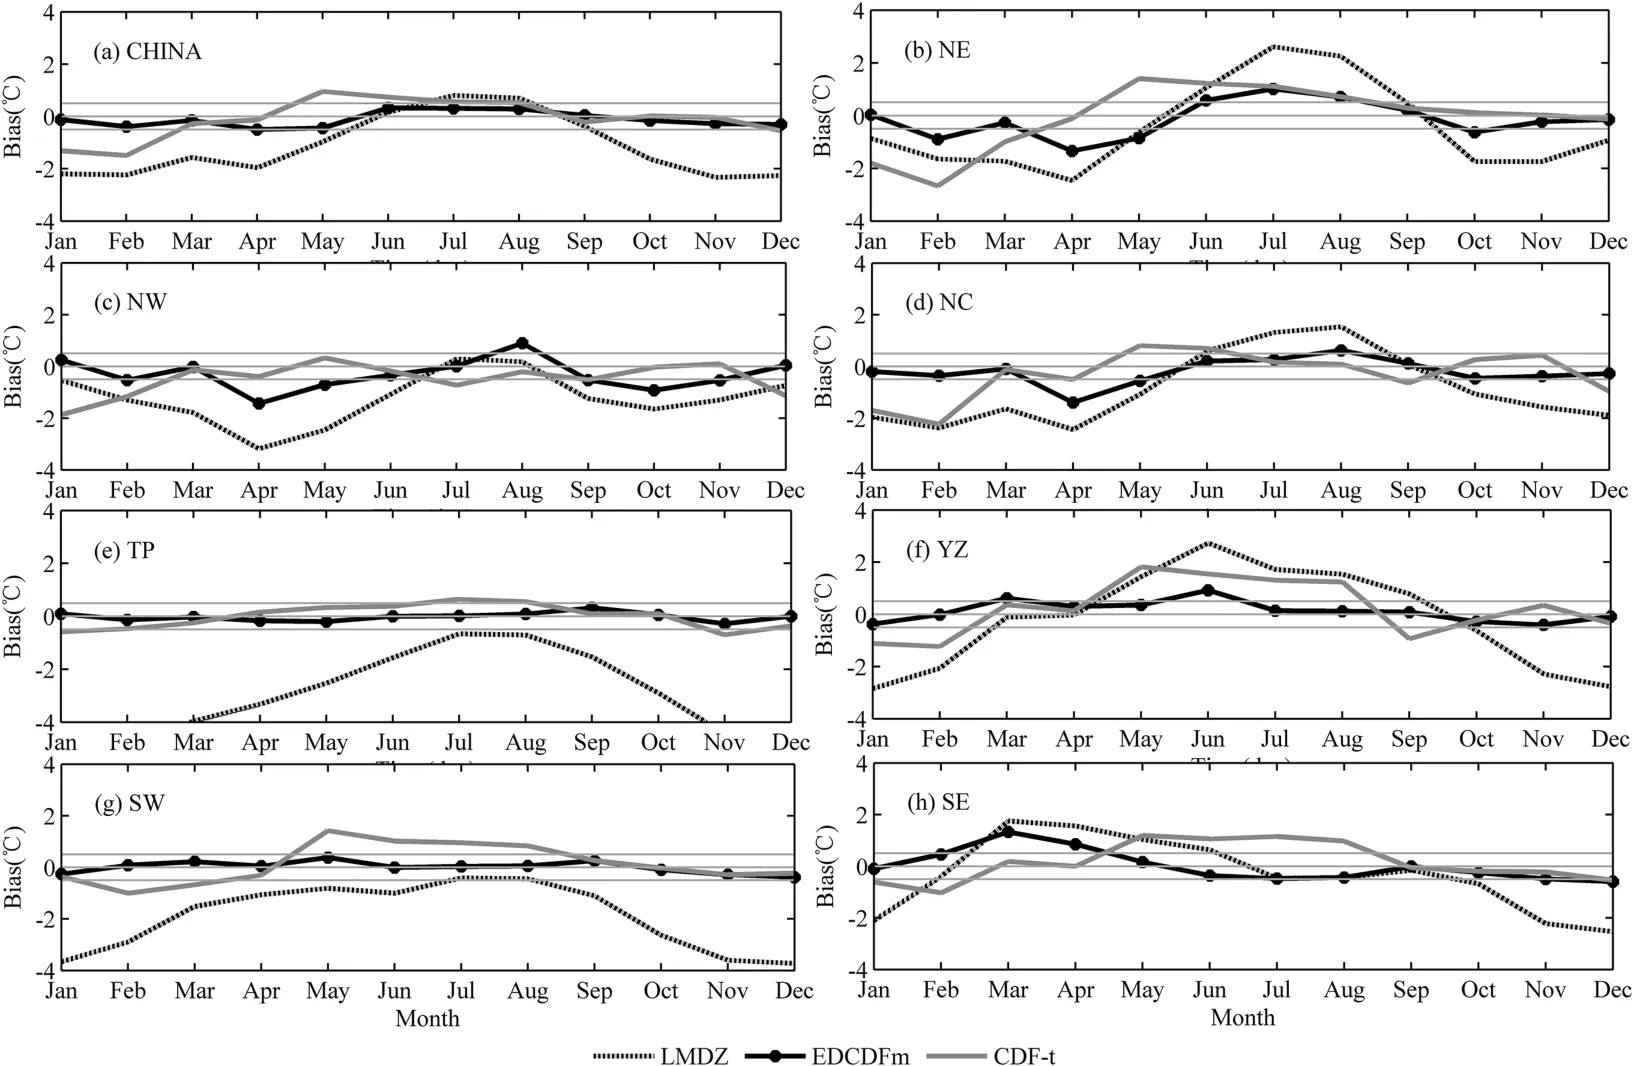
Fig.5.Seasonal change of temperature bias in the different regions before and after correction(LMDZ:model minus observation;EDCDFm:EDCDFm minus observation;CDF-t:CDF-t minus observation).
Taylor diagrams are used to assess the performance before and after correction in simulating the spatial pattern of indices(Fig.7).The spatial correlation coef ficients of TXAV,TNAV,and FD between model simulation and observation are approximately 0.97 and the root mean square error is more than 0.25°C.After correction,the correlation coef ficients for the three indices are above 0.99,the relative standard deviations are close to 1,and the root mean square errors are close to 0,which indicates that the performances in simulating the spatial pattern of TXAV,TNAV,and FD are significantly improved by correction.For HWDI,the model simulations are poorer than those of the other three indices,with a spatial correlation coef ficient below 0.75 and relative standard deviation of 0.75.After correction,the spatial correlation coef ficient increases to 0.75 and the relative standard deviation is close to 1,indicating that the simulation capability of HWDI improves slightly after the correction.
By comprehensively evaluating the ability of the model to simulate the TAV and the extreme temperature spatial pattern before and after the correction,we can observe that the model can significantly improve the simulation capability of the temperature spatial pattern over central and eastern China after the correction of the EDCDFm and CDF-t methods,and we can reproduce the regional characteristics of the temperature affected by terrain and atmospheric circulation.Therefore,projecting the spatial pattern of the future climate by using EDCDFm and CDF-t correction is a reliable task.In addition,the cold bias of the CDF-t method in winter is obviously higher than that of the EDCDFm method,and the temperature change curve of the EDCDFm method is closer to the observation than that of the CDF-t method.
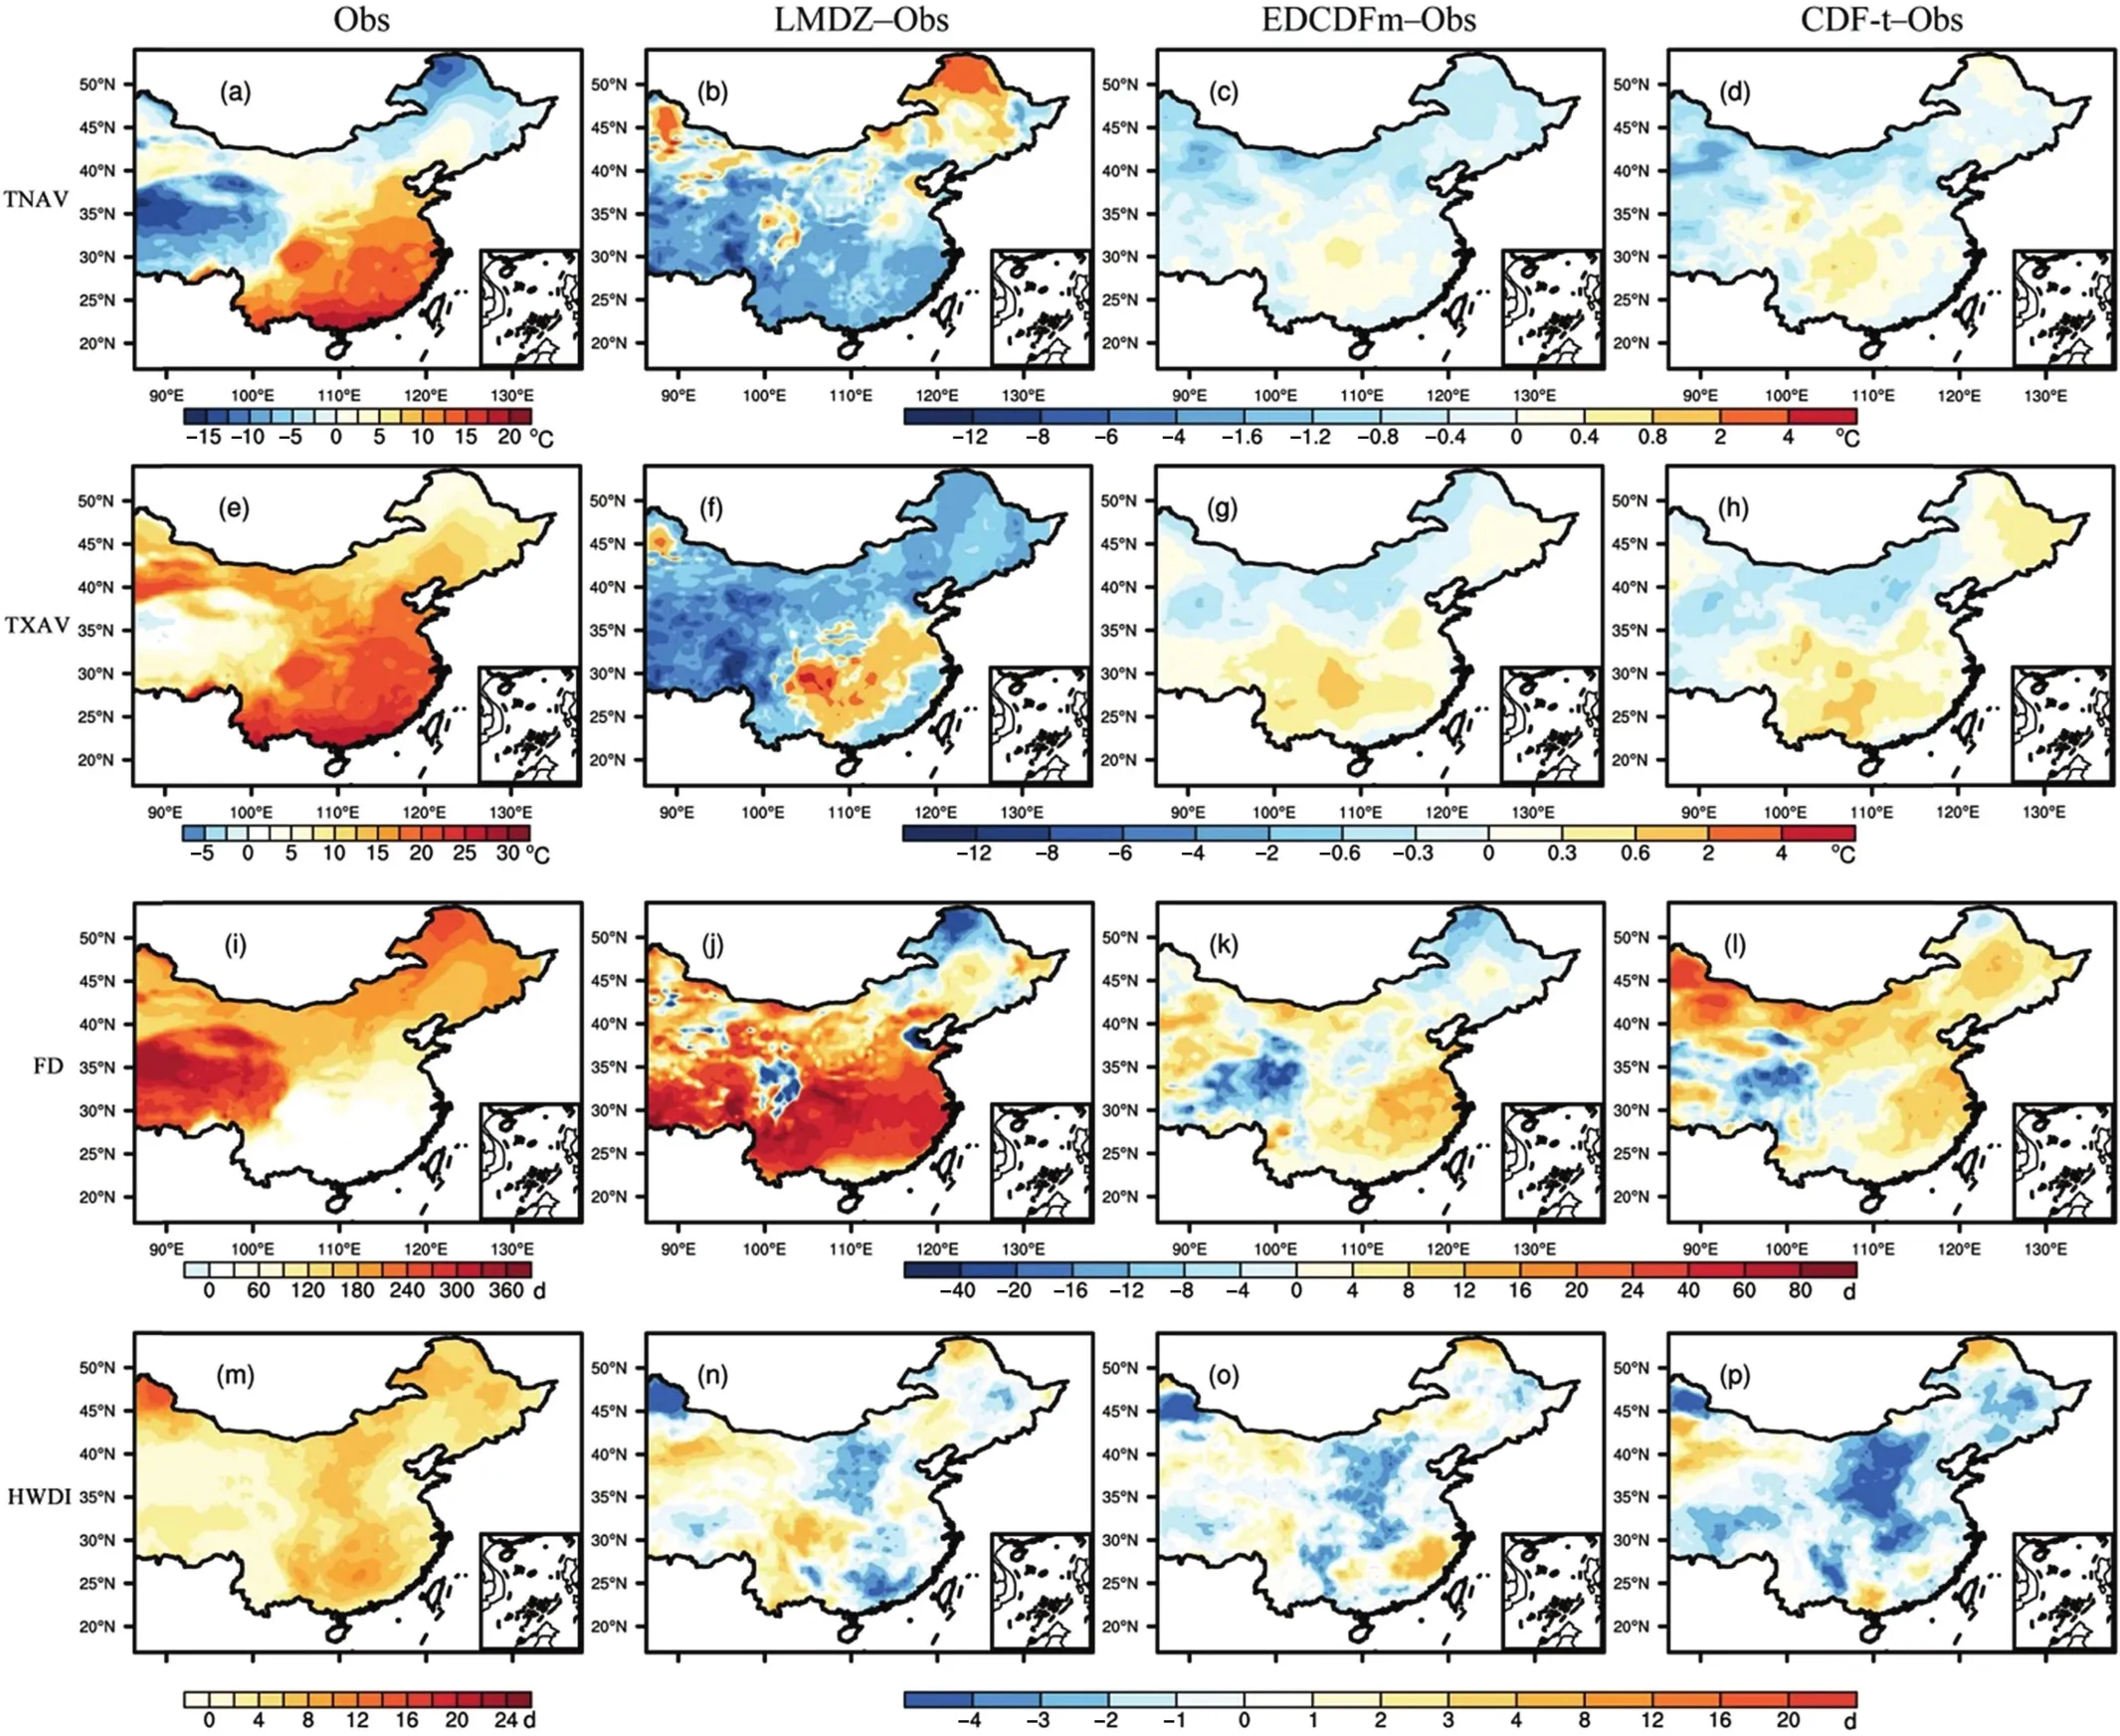
Fig.6.Spatial pattern of extreme indices for the observed( first column),biases between observation and model(second column),biases between observation and EDCDFm(third column),and biases between observation and CDF-t(fourth column).
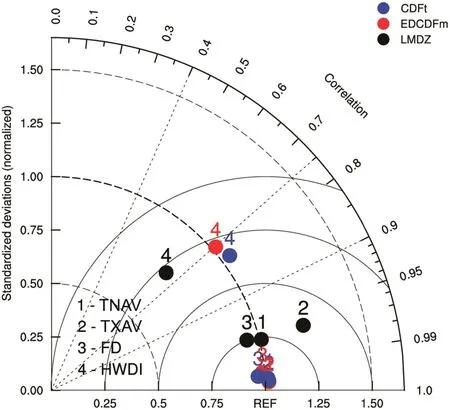
Fig.7.Taylor diagram of extreme indices before and after correction.
4.Future projections
4.1.Future projection of extreme temperature and its uncertainties
The preceding results show that the EDCDFm method is superior to the CDF-t method for temperature.Therefore,the EDCDFm method is applied to project the future changes of mean temperature and extreme temperatures in the study area relative to the baseline in 1986-2005.Notably,differences occur in the climate distribution between the model simulations and the corrections,but for the climate change signals relative to the baseline period,the results are consistent before and after the correction.The projection based on the EDCDFm method shows that under the RCP4.5 emission scenario,the temperature in the entire study area shows a warming trend in the 21st century(Fig.8).The mean temperature is projected to increase by 0.76,1.84,and 2.10°C with respect to 1986-2005 during 2017-2036,2046-2065,and 2080-2099,respectively.The spatial change for the TAV in the three future periods exhibit good consistency,warming in northern China is higher than that in the south,and warming in the northwest is higher than that in the northeast,specifically in the northern part of Xinjiang where the temperature change in the three periods reaches 1.1,2.0,and 3.0°C.
Large uncertainties are observed in the projection of future climate change.The model spreads(i.e.,the mean square error between modes)are the indicators of uncertainties(Li and Zhou,2010).No significant differences are observed in the distribution of model spreads in China during the three periods(Fig.8).The model spreads in the early 21st century are 0-0.4°C,indicating that the multiple models have fewer uncertainties for TAV projection.The model spreads in TP and Sichuan Basin in the middle and late 21st century exceeded 0.4°C and 0.6°C,respectively,indicating that the multiple model uncertainties of the TAV projection change have increased.The spatial distribution characteristics and distributions of model spreads of TNAV and TXAV are similar to those of TAV,which show that the temperature increases from south to north,and the uncertainty in TP and Sichuan Basin gradually increases from the early to the late 21st century.
FD in the 21st century shows a significant decrease(Fig.9),the magnitude of reduction from the early to late 21st century gradually increased.The reduction magnitude of 26º-40ºN is the largest.The FD reduction in TP in the early,middle,and late 21st century exceeds 15,30,and 40 d,respectively,while the reduction magnitude in Guangdong,Guangxi,and Sichuan Basin is less than 5 d.In TP and the Loess Plateau,the simulated model spreads of FD are greater than 5 d(Fig.9),which indicates that the uncertainties in these regions are larger.The uncertainties between models from the early to the end of the 21st century gradually increase.
In the 21st century,HWDI is expected to increase in the NC,NE,YZ,and SE regions(Fig.10),especially in SE over 3 d.Meanwhile,in NW and TP,HWDI shows a decreasing trend.From the early to the late 21st century,the range of increased heat waves has widened.For the model spreads,the difference between the models is greater than 0.8 d in NW,NE,and SE,that is,the model has higher uncertainty.
In summary,under the RCP4.5 emission scenario,TAV,TXAV,and TNAV over central and eastern China show a warming trend in the 21st century.In the early,middle,and late 21st century,TAV is projected to increase by 0.76,1.84,and 2.10°C,respectively.The spatial change for TAV,TXAV,and TNAV in the three future periods exhibit good consistency,and warming in northern China is higher than that in the south.Uncertainties in temperature change projection are large in TP and Sichuan Basin,and uncertainty from the early to the late 21st century gradually increases.FD decreases significantly,especially in TP,to more than 15,30,and 40 d,and the uncertainty is larger.The variation of the heat wave indice is the smallest,the heat wave increase mainly occurs in eastern China,and the heat wave in south China occurs for more than 2 d.
Wang et al.(2008)have shown that TXAVand TNAV in the 21st century is likely to increase;the increase is expected to be greater in the north than that in the south,and the FD is much larger in the Jianghuai region and plateau areas.These conclusions are consistent with the results of the four extreme temperature indices.FD decreases significantly in the YZ and TP.These conclusions are consistent with the projection results of the four extreme temperature indices discussed in this paper.
4.2.Response of extreme temperature under the global warming of 1.5 °C and 2.0 °C
Considering the high attention of regional response to the global warming of 1.5°C and 2.0°C in Paris Agreement,the response characteristic of extreme temperature over central and eastern China under two warming targets are analyzed.As shown in Fig.11,TAV,TNAV and TXAV have an increasing trend and increase by over 0.75°C in the study area under 1.5°C warming target,especially in the northwestern China and the TP,relative to 1986-2005.Under 2°C warming target,three temperature indices increase by more than 1.25°C over central and eastern China,and over 3°C in parts of TP.It's noted that the addition of temperature are over 0.75°C in the Huanghuai region and North China,and over 1.5°C in parts of northeastern China obviously larger than under 1.5°C warming target.For HWDI,the increase happens in North China,Ordos region and southwestern China,while the slight decrease occurs in northeastern China and TP under the global warming of 1.5°C.There is a whole increase of HWDI in the study area and the largest increase in southwestern China is up to 4 d under the global warming of 2°C.What's more,addition of HWDI in northeastern China is more than 3 d larger than under 1.5°C target and 80%of models have the consistency in the sign of future change.
Compared with response results of GCM simulations(Jiang et al.,2009;Guo et al.,2016;Hu et al.,2017;Shi et al.,2018),the increase of extreme temperature over central and eastern China with CDF-t method has a similar spatial distribution decreasing from northwest to southeast,and obviously changes in TP and Northwest China.However,with difference in the additional 0.5°C global warming,the results using CDF-t more clearly capture that the significantly changed region is Northeast China.
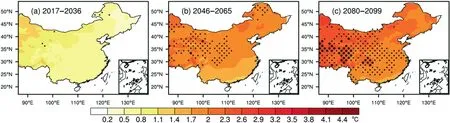
Fig.8.Spatial distribution of mean daily temperature changes relative to 1968-2005:(a)2017-2036,(b)2046-2065,and(c)2080-2099;black dots indicate models spreads;in the areas without black dots,the model spreads are less than 0.4°C.
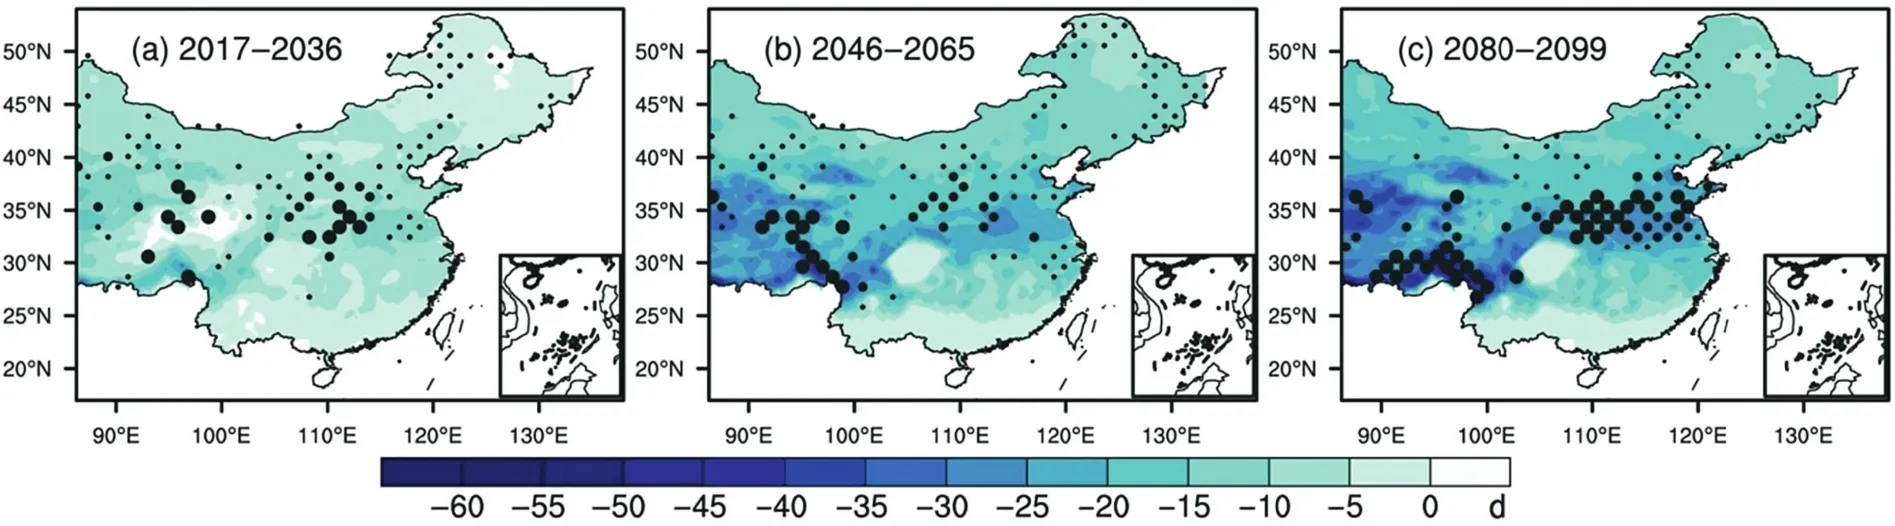
Fig.9.Spatial distribution of frost days changes relative to 1968-2005:(a)2017-2036,(b)2046-2065,and(c)2080-2099;black dots indicate model spreads;in the areas without black dots,the model spreads are less than 3 d.
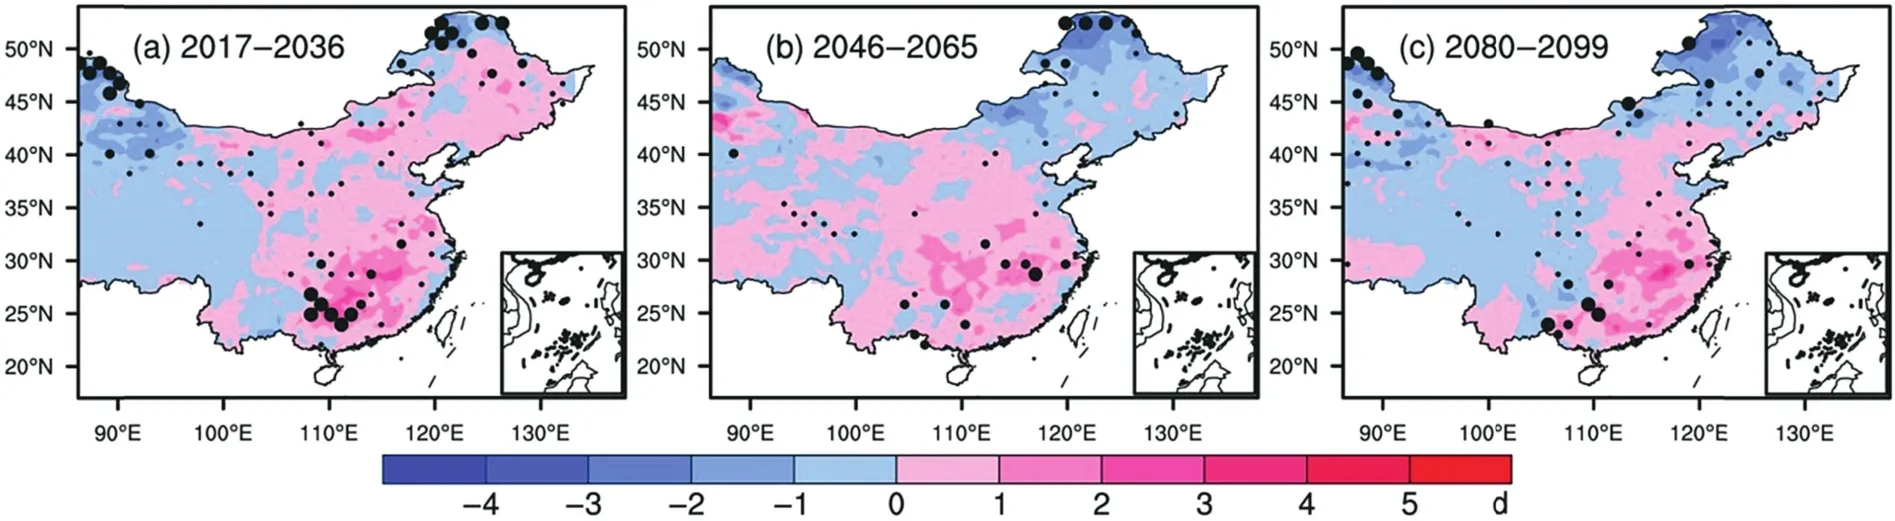
Fig.10.Spatial distribution of heat wave indice changes relative to 1968-2005:(a)2017-2036,(b)2046-2065,and(c)2080-2099;black dots indicate models spreads;in the areas without black dots,the model spreads are less than 0.8 d.
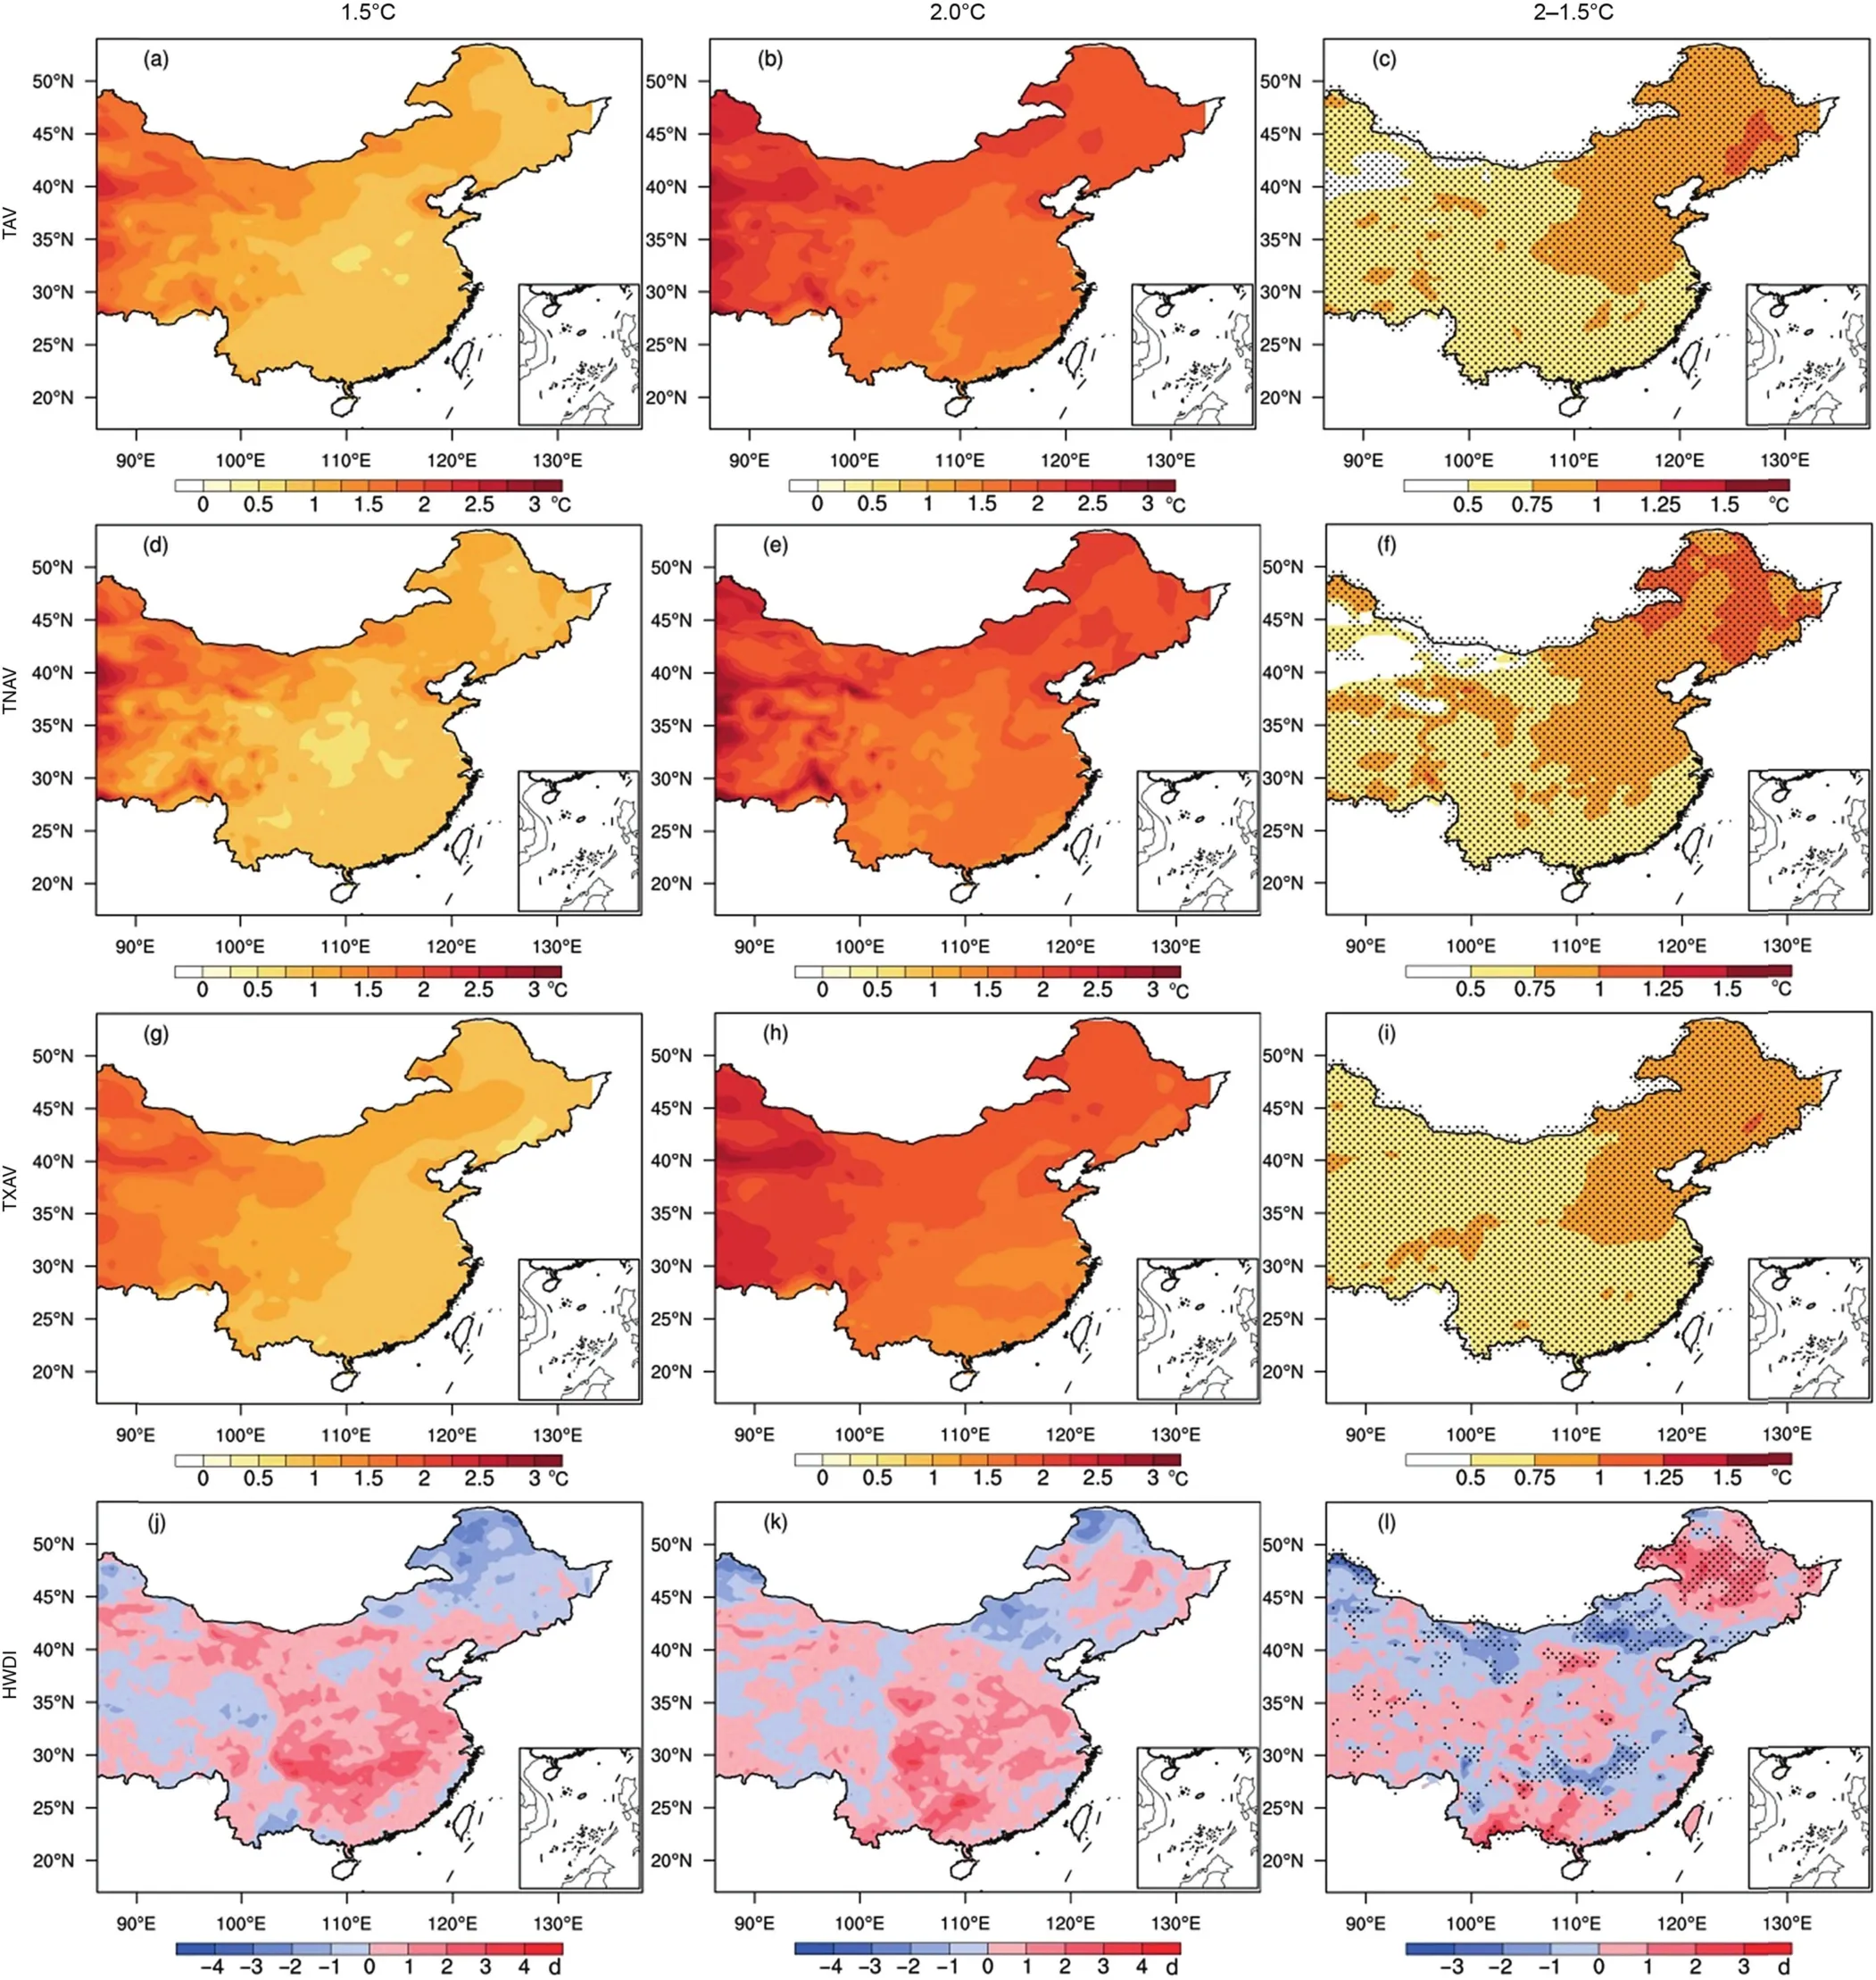
Fig.11.Spatial distributions of extreme indices changes over central and eastern China(relative to 1986-2005 period)for global warming at 1.5°C(left column),2 °C(middle column)and 2-1.5 °C(right column)in the RCP4.5 emission scenario,black dots indicate 80%of models have the consistency in changes only for the global warming of 2-1.5°C.
5.Summary and conclusions
In this paper,the EDCDFm and CDF-t methods are applied to the daily mean temperature,minimum temperature,and maximum temperature data of the dynamical downscaling simulation.The simulation capabilities of these two methods on the daily temperature over central and eastern China are evaluated,and the better correction method is selected to project the future temperature change and analyze the uncertainties of future projection in the 21st century under the RCP4.5 emission scenario.The following conclusions are drawn:
(1)The EDCDFm and CDF-t methods can better correct the spatial distribution of daily mean temperature and extreme temperature,significantly reduce the biases of the model simulation,and effectively improve the capacity of models for the spatial pattern of extreme temperature.The temperature change curve of the EDCDFm method is closer to the observation than that of the CDF-t method.
(2)The projection of the MME based on the EDCDFm method shows that under the RCP4.5 emission scenario,the temperature over central and eastern China shows a warming trend.The mean temperature is projected to increase by 0.76,1.84,and 2.10°C with respect to 1986-2005 during the periods 2017-2036,2046-2065,and 2080-2099,respectively.The spatial change for the mean temperature,maximum temperature,and minimum temperature in the three future periods have good consistency,and warming in northern China is higher than that in the south.Uncertainties in temperature change projection are large in TP and the Sichuan Basin.The frost days decrease significantly in the mid-latitude area,and the increasing heat wave increase mainly occurs in eastern China.
(3)TAV,TNAV and TXAV over central and eastern China increase by more than 0.75°C under 1.5°C target,especially in the northwestern China and the TP,relative to 1986-2005.Under 2°C warming target,three temperature indices increase by over 1.25°C.It's noted that the addition of temperature in parts of northeastern China is more than 1.5°C obviously larger than under 1.5°C target,while over 3 d for HWDI.
The EDCDFm and CDF-t methods significantly improve the ability of the model to simulate temperatures over central and eastern China.However,these two methods only establish the function of the CDF between the observed and model variables,and the large-scale circulation factors are not involved;thus,simulation biases remain.In addition,the two methods aim to correct the probability and simulation values of the cumulative distribution function of models,respectively.Further study should investigate whether the effect will be better when the probability and simulation value are corrected simultaneously.
Acknowledgments
Funding for this study was provided by the National Key R&D Program of China(2017YFA0603804)and the National Natural Science Foundation of China(41230528).
References
Chen,W.L.,Jiang,Z.H.,Li,L.,et al.,2011.Simulation of regional climate change under the IPCC A2 scenario in southeast China.Climate Dyn.36(3-4),491-507.
Dong,S.Y.,Xu,Y.,Zhou,B.T.,et al.,2015.Assessment of indices of temperature extremes simulated by multiple CMIP5 models over China.Adv.Atmos.Sci.32(8),1077-1091.
Dosio,A.,Paruolo,P.,2011.Bias correction of the ENSEMBLES highresolution climate change projections for use by impact models:evaluation on the present climate.J.Geophys.Res.116(117),127-135.
Dufresne,J.L.,Foujols,M.A.,Denvil,S.,et al.,2013.Climate change projections using the IPSL-CM5 Earth system model:from CMIP3 to CMIP5.Climate Dyn.40(9-10),2123-2165.
Farajzadeh,M.,Oji,R.,Cannon,A.J.,et al.,2015.An evaluation of single-site statistical downscaling techniques in terms of indices of climate extremes for the Midwest of Iran.Theor.Appl.Climatol.120(1-2),377-390.
Fischer,E.M.,Knutti,R.,2015.Anthropogenic contribution to global occurrence of heavy-precipitation and high-temperature extremes.Nat.Clim.Change 5,560-564.
Flaounas,E.,Drobinski,P.,Vrac,M.,et al.,2013.Precipitation and temperature space-time variability and extremes in the Mediterranean region:evaluation of dynamical and statistical downscaling methods.Climate Dyn.40(11-12),2687-2705.
Frich,P.,Alexander,L.V.,Della-Marta,P.,et al.,2002.Observed coherent changes in climatic extremes during the second half of the twentieth century.Clim.Res.19(3),193-212.
Gao,X.J.,Shi,Y.,Giorgi,F.,2016.Comparison of convective parameterizations in RegCM4 experiments over China with CLM as the land surface model.Atmos Oceanic Sci Lett 9(4),246-254.
Gao,X.J.,Xu,Y.,Zhao,Z.C.,et al.,2006.Impacts of horizontal resolution and topography on the numerical simulation of east Asian precipitation.Chin.J.Atmos.Sci.30,185-192(in Chinese).
Guo,X.J.,Huang,J.P.,Luo,Y.,et al.,2016.Projection of heat waves over China for eight different global warming targets using 12 CMIP5 models.Appl.Climatol 128(3-4),507-522.
Hu,T.,Sun,Y.,Zhang,X.B.,2017.Temperature and precipitation projection at 1.5°C and 2.0°C increase in global mean temperature.Sci.Bull.62(26),3098-3111(in Chinese).
Hourdin,F.,Musat,I.,Bony,S.,et al.,2006.The LMDZ4 general circulation model:climate performance and sensitivity to parametrized physics with emphasis on tropical convection.Climate Dyn 27(7-8),787-813.
Ines,A.V.M.,Hansen,J.W.,2006.Bias correction of daily GCM rainfall for crop simulation studies.Agric.For.Meteorol.138(1),44-53.
Ji,Z.,Kang,S.,2015.Evaluation of extreme climate events using a regional climate model for China.Int.J.Climatol.35(6),888-902.
Jiang,D.B.,Zhang,Y.,Sun,J.Q.,2009.Ensemble projection of 1-3°C warming in China.Chin.Sci.Bull.54,3326-3334.
Jiang,D.B.,Tian,Z.P.,Lang,X.M.,2016.Reliability of climate models for China through the IPCC third to fifth assessment reports.Int.J.Climatol.36(3),1114-1133.
Jiang,S.,Jiang,Z.H.,Li,W.,et al.,2017.Evaluation of the extreme temperature and its trend in China simulated by CMIP5 models.Climate Change Res 13(1),11-24(in Chinese).
Jiang,Z.H.,Song,J.,Li,L.,et al.,2012.Extreme climate events in China:IPCC-AR4 model evaluation and projection.Climatic Change 110(1),385-401.
Knutti,R.,Rogelj,J.,Sedlacek,J.,et al.,2016.A scientific critique of the twodegree climate change target.Nat.Geosci.9(1),13-18.
Lavaysse,C.,Vrac,M.,Drobinski,P.,et al.,2012.Statistical downscaling of the French Mediterranean climate:assessment for present and projection in an anthropogenic scenario.Nat.Hazards Earth Syst.Sci.12(3),651-670.
Li,B.,Zhou,T.J.,2010.Projected climate change over China under SRES A1B scenario:multi-model Ensemble and uncertainties.Adv.Clim.Change Res.6(4),270-276(in Chinese).
Li,H.,Shef field,J.,Wood,E.F.,2010.Bias correction of monthly precipitation and temperature fields from Intergovernmental Panel on Climate Change AR4 models using equidistant quantile matching.J.Geophys.Res.115(D10),985-993.
Li,J.,Zhang,Q.,Chen,Y.D.,et al.,2013.GCMs-based spatiotemporal evolution of climate extremes during the 21st century in China.J.Geophys.Res.118(19),11017-11035.
Michelangeli,P.A.,Vrac,M.,Loukos,H.,2009.Probabilistic downscaling approaches:application to wind cumulative distribution functions.Geophys.Res.Lett.36(36),163-182.
Schaeffer,M.,Hare,W.,Rahmstorf,S.,Vermeer,M.,2012.Long-term sealevel rise implied by 1.5°C and 2°C warming levels.Nat.Clim.Change 2,867-870.
Shi,C.,Jiang,Z.H.,Chen,W.L.,2018.Changes in temperature extremes over China under 1.5°C and 2°C global warming targets.Adv.Clim.Change Res.https://doi.org/10.1016/j.accre.2017.11.003.
Taylor,K.E.,Stouffer,R.J.,Meehl,G.A.,2012.An overview of CMIP5 and the experiment design.Bull.Am.Meteorol.Soc.93(4),485.
Tong,Y.,Gao,X.J.,Han,Z.Y.,et al.,2017.Bias correction of daily precipitation as simulated by RegCM4 over China.Chin.J.Atmos.Sci.41(6)https://doi.org/10.3878/j.issn.1006-9895.1704.16275(in Chinese).
Vigaud,N.,Vrac,M.,Caballero,Y.,2013.Probabilistic downscaling of GCM scenarios over southern India.Int.J.Climatol.33(5),1248-1263.
Vrac,M.,Drobinski,P.,Merlo,A.,et al.,2012.Dynamical and statistical downscaling of the French Mediterranean climate:uncertainty assessment.Nat.Hazards Earth Syst.Sci.12(9),2769.
Wang,J.,Jiang,Z.H.,Ding,Y.G.,et al.,2008.Multi-model Ensemble prediction of extreme temperature indices in China.Resour.Sci.30(07),1084-1092(in Chinese).
Xu,Y.,Gao,X.J.,Shen,Y.,et al.,2009.A daily temperature dataset over China and its application in validating a RCM simulation.Adv.Atmos.Sci.26(4),763-772.
Xu,Y.L.,Huang,X.Y.,Zhang,Y.,et al.,2007.Validating PRECIS'capacity of simulating present climate over south China.Acta Sci.Nat.Univ.Sunyatseni 46(5),93-97.
Yang,H.,Jiang,Z.H.,Li,L.,2016.Biases and improvements in three dynamical downscaling climate simulations over China.Climate Dyn 47(9-10),3235-3251.
Yang,H.,Jiang,Z.H.,Li,Z.X.,et al.,2017.Applicability of a quantile-quantile(Q-Q)bias-correction method for climate dynamical downscaling at Beijing station.Acta Meteorol.Sin.75(3),460-470(in Chinese).
Yang,W.,Andr′easson,J.,Graham,L.P.,et al.,2010.Distribution-based scaling to improve usability of regional climate model projections for hydrological climate change impacts studies.Nord.Hydrol 41(3-4),211-229.
Yu,E.T.,Sun,J.Q.,Chen,H.P.,et al.,2015.Evaluation of a high-resolution historical simulation over China:climatology and extremes.Climate Dyn.45(7),2013-2031.
Zhang,X.Q.,Peng,L.L.,Lin,Z.H.,2008.Progress on the projections of future climate change with various emission scenarios.Adv.Earth Sci.23(2),174-185.
Zhang,Y.J.,Fu,L.,Pan,J.,et al.,2017.Projected changes in temperature extremes in China using PRECIS.Atmosphere 8(1),15.https://doi.org/10.3390/atmos8010015.
Zhao,Z.C.,2006.Latest advances in global climate projections.Adv.Atmos.Sci.2,68-70(in Chinese).
Zhou,L.,Jiang,Z.H.,2017.Future changes in precipitation over Hunan province based on CMIP5 simulations using the statistical downscaling method of transform cumulative distribution function.Acta Meteorol.Sin.75(2),223-235(in Chinese).
Zhou,L.,Pan,J.,Zhang,L.,et al.,2014a.Correction based on distribution scaling for precipitation simulated by climate model.J Appl Meteorol Sci.25(3),302-311(in Chinese).
Zhou,L.,Pan,J.,Zhang,L.,et al.,2014b.Analysis on statistical bias correction of daily precipitation simulated by regional climate model.J.Trop.Meteorol.30(1),137-144(in Chinese).
Zou,L.W.,Zhou,T.J.,2013.Near future(2016-2040)summer precipitation changes over China as projected by a regional climate model(RCM)under the RCP8.5 emissions scenario:comparison between RCM downscaling and the driving GCM.Adv.Atmos.Sci.30(3),806-818.
 Advances in Climate Change Research2018年1期
- Advances in Climate Change Research的其它文章
- Climate change projections for the Middle East-North Africa domain with COSMO-CLM at different spatial resolutions
- Future temperature changes over the critical Belt and Road region based on CMIP5 models
- A cautionary note on decadal sea level pressure predictions from GCMs
- Co-controlling CO2 and NOx emission in China's cement industry:An optimal development pathway study
- Carbon emission scenarios of China's power sector:Impact of controlling measures and carbon pricing mechanism
- Analysis on energy demand and CO2 emissions in China following the Energy Production and Consumption Revolution Strategy and China Dream target