Future temperature changes over the critical Belt and Road region based on CMIP5 models
DONG Tin-Yun,DONG Wn-Ji*,GUO Yn,c,CHOU Ji-Ming,c,YANG Shi-Li,TIAN Di,YAN Dong-Dong
a State Key Laboratory of Earth Surface Processes and Resource Ecology,Beijing Normal University,Beijing 100875,China
b School of Atmospheric Sciences,Sun Yat-Sen University,Guangzhou 510275,China
c Zhuhai Joint Innovative Center for Climate-Environment-Ecosystem,Future Earth Research Institute,Beijing Normal University,Zhuhai 519087,China
d Business School,Beijing Normal University,Beijing 100875,China e State Key Laboratory of Satellite Ocean Environment Dynamics,Second Institute of Oceanography,Hangzhou,310012,China
1.Introduction
The Beltand Road Initiative,where the Beltrefersto the Silk Road Economic Belt and the Road refers to the 21st Century Maritime Silk Road,is a call for new modes of regional economic cooperation in China under the development of economic globalization(NDRC et al.,2015).The initiative presents serious impacts on efforts to promote industrial investment,societal development,economic and trade cooperation,and ecological protection.The northern lines of Belt and Road run through arid and semi-arid region of northwest China,the southern linesrun though South China sea and Indian ocean.These regions are located in sensitive areas of climate change.Furthermore,promoting the Belt and Road construction initiative would be largely affected by climate change.Thus,the assessment and projection of future climate changes over the Belt and Road Critical Regions plays an important role in the sustainable developmental strategy of this endeavor.
Coupled climate models are able to provide relatively reliable simulations for climate changes.Researchers have recently assessed the performance of climate simulations worldwide,including China,based on several climate models(Zhou and Yu,2006;Jiang et al.,2012;Xu and Xu,2012b;Guo et al.,2013;Knutson et al.,2013;Kumar et al.,2013;Liu et al.,2014).Zhou and Yu(2006)analyzed surface air temperature(SAT)changes over China and the world in the 20th century by simulation with 19 coupled climate models.Xu and Xu(2012b)assessed the performance of simulations of the present climate over China based on 18 different global climate models.Guo et al.(2013)used Coupled Model Intercomparison Project Phase 5(CMIP5)models to assess the simulation of China's annual mean SAT.Some of these models are highly believed to be able to reproduce many features of the observed global and Northern Hemisphere(NH)mean temperature variance at the interannual to centennial time scales(IPCC,2013).
CMIP5(Taylor et al.,2012)presents an unprecedented level of information from which projections can be based;this project includes new Earth System Models containing a morecomplete representation of forcing,new RCP scenarios,and more outputs available for analysis.Coupled climate models have been used to project monsoon and future climate changes under different scenarios(Moss et al.,2010;Meinshausen et al.,2011;Xu and Xu,2012a;Zhang,2012;Kitoh et al.,2013;Wang and Chen,2013;Yang et al.,2014;Zhao et al.,2014;He and Zhou,2015;He et al.,2015,2017;Tian et al.,2015;Zou and Zhou,2015).Xu and Xu(2012a)projected temperature and precipitation changes over China based on 11 climate models.Zhang(2012)employed 17 CMIP5 models to investigate the temporal and spatial characteristics of 2°C warming over China under Representative Concentration Pathways(RCP)scenarios.Tian et al.(2015)evaluated climate changes and their uncertainties based on 22 CMIP5 models of climate in China in the next century.Yang et al.(2014)analyzed climatic extremes and their future changes over China using observations and 12 CMIP5 models.Zhao et al.(2014)projected changes in temperature and precipitation extremes in China by the end of the 21st century based on CMIP5 simulations.Zou and Zhou(2015)analyzed future changes of the onset of the Asian summer monsoon based on simulations and projections under the RCP scenario by using four Chinese climate models.CMIP5 models generally perform well and have future projection ability for climate change worldwide and China;however,few studies have analyzed the temperature change over critical Belt and Road regions.Hence,in this study,we apply trend analysis and comprehensive Taylor diagram methods for model assessment and selection,then use the selected models to project temperature changes in the 21st century over critical Belt and Road regions based on CMIP5 models.
The remainder of the paper is organized as follows.In Section 2,two critical portions of the Belt and Road region,the observations,CMIP5 model datasets,and methods are described.In Section 3,models are assessed by using trend analysis and Taylor diagrams.In addition,the models that can simulate temperature changes in the study areas well are selected.In Section 4,the selected models are used to project future temperature changes,including temporal and spatial changes in the future.Finally,a summary and discussion of the main findings are given in Section 5.
2.Data and methodology
The Belt and Road region is not a closed system and contains no absolute boundary(Liu,2015).Fundamentally,the Belt and Road Initiative is an open and inclusive international regional economic cooperation network.Any country that is willing to participate can attend,as the initiative is not an exclusive platform.Vision and actions on jointly building Silk Road Economic Belt and 21st-century maritime Silk Road(hereinafter called vision and actions)released by NDRC et al.(2015)has pointed out the positions of the Chinese provinces and direction of international cooperation in the Belt and Road Initiative.Xinjiang is identified as a core area of the Silk Road Economic Belt,mainly to promote communication and cooperation with Central,South,and West Asian countries.Fujian province is a critical position in the 21st Century Maritime Silk Road.Yunnan province is a pivot in China's unveiling to South and Southeast Asia,and Guangxi is an important gateway connecting the Silk Road Economic Belt and the 21st Century Maritime Silk Road.The vision and actions also intends to build Xi'an into a new focus of reform,speed up the development and unveiling of cities such as Lanzhou and Xining,and strengthen the port construction of coastal cities,such as Fuzhou,Quanzhou,Guangzhou,Zhanjiang,and Haikou.The northern lines of Belt and Road run through arid and semi-arid region of northwest China,the southern lines run though South China Sea and Indian Ocean.Therefore,we select core cities in the Silk Road Economic Belt as the northern region of interest(Fig.1;the scope of the upper red rectangle)and port cities in the 21st Century Maritime Silk Road as the southern region of interest(Fig.1;the scope of the lower red rectangle),then we project temperature changes in these two regions over the next 100 years.For convenience,we use NBR to represent the northern region of the Belt and Road and SBR to represent the southern part.
We focus our analysis on the annual mean SAT,and use three observation datasets.The observed temperature dataset CRU TS3.10(http://badc.nerc.ac.uk/data/cru/)is used in this study;this dataset covers global land and is a monthly mean gridded dataset maintained by the Climate Research Unit(CRU)at the University of East Anglia over the period 1901-2009 at high resolution(0.5°× 0.5°)(Harris et al.,2014).We used this dataset for the NBR which includes mostly land area.
In the SBR,which includes both land and ocean,we use the 20CR v2c dataset for analysis.The 20CR v2c dataset(http://www.esrl.noaa.gov/psd/data/gridded/data.20thC_ReanV2c.html)is a reanalysis dataset developed by the National Oceanic and Atmospheric Administration(NOAA)and Cooperative Institute for Research in Environmental Sciences(CIRES)(Compo et al.,2011).The dataset contains global land and ocean temperatures spanning the years from 1851 to 2014 on regular 2°× 1.75°grids.
To contrast and verify the reliability of the observational data,the GISSTEMP dataset was also chosen.GISSTEMP(http://www.esrl.noaa.gov/psd/data/gridded/data.gistemp.html)is a monthly mean gridded dataset developed by the Goddard Institute for Space Studies in the National Aeronautics and Space Administration(NASA)(Hansen et al.,2010)that covers the global land and ocean area from 1880 to 2015 on regular 2°× 2°grids.Because this dataset only contains temperature anomalies,we utilize it to analyze the temporal evolution of temperature only.
CMIP5 models are archived by the Program for Climate Model Diagnosis and Intercomparison(PCMDI)(http://cmippcmdi.llnl.gov/cmip5/index.html).Over 20 modeling groups perform CMIP5 simulations using more than 50 models.In the study,the outputs of 22 models(Table 1)are employed.CMIP5 models include a large number of long-term experiments,and this study uses historical experiments and future projection simulations of different RCPs.Herein,we focus on projections under the RCP2.6,RCP4.5 and RCP8.5 scenarios,and select only one ensemble member from each model.
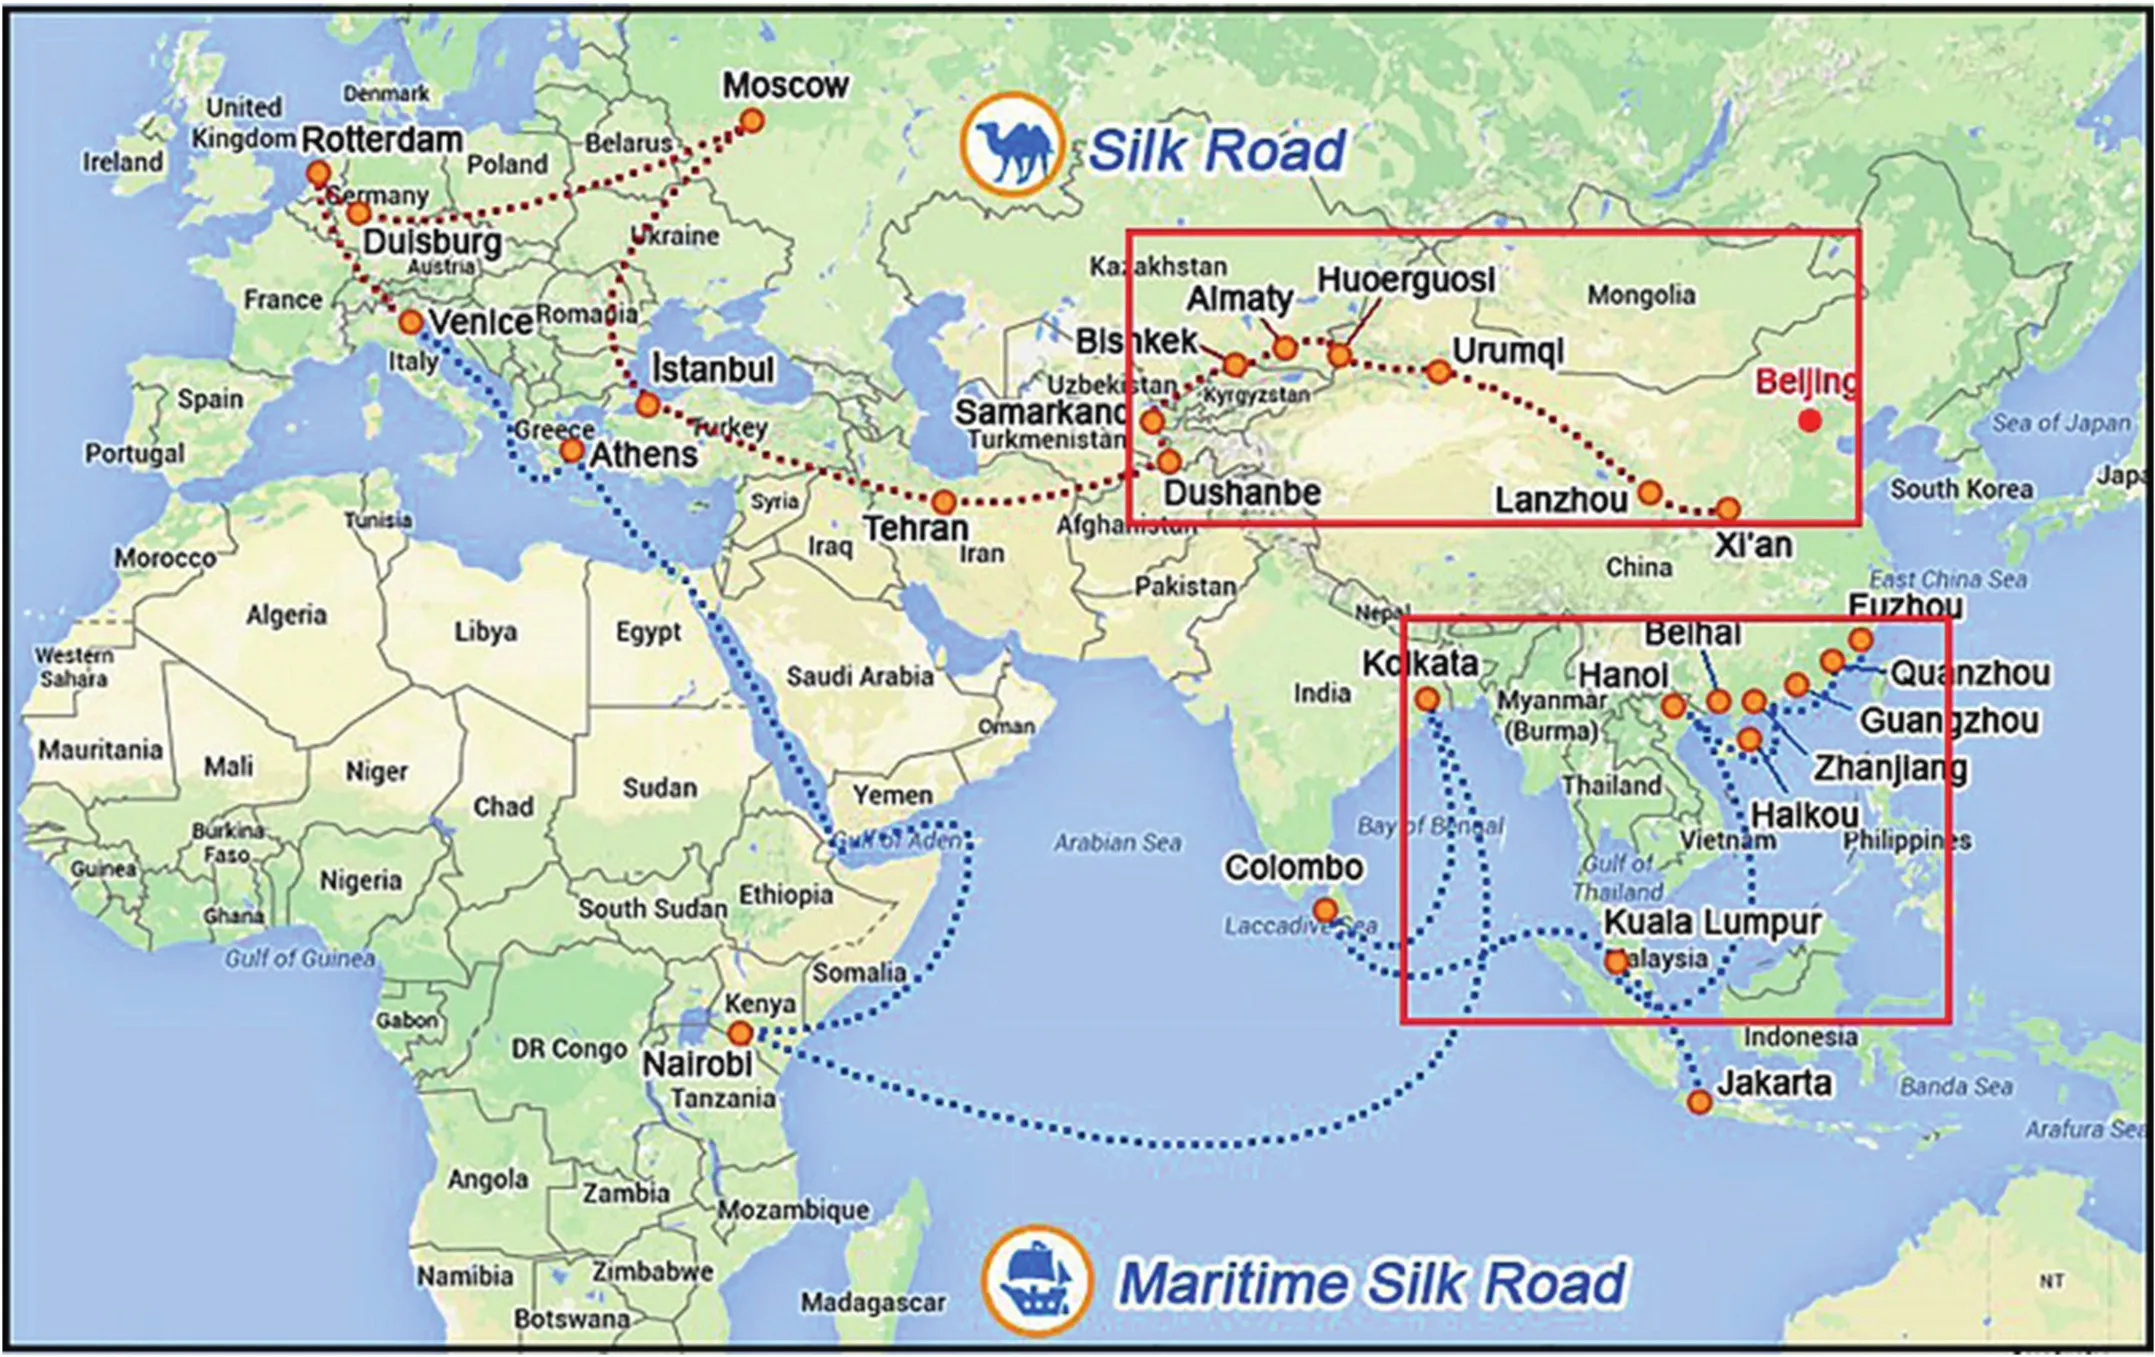
Fig.1.Study regions.Red rectangles delineate the southern and northern portion of the Belt and Road region(http://analysisias.com/wp-content/uploads/2016/02/OBOR.jpg).
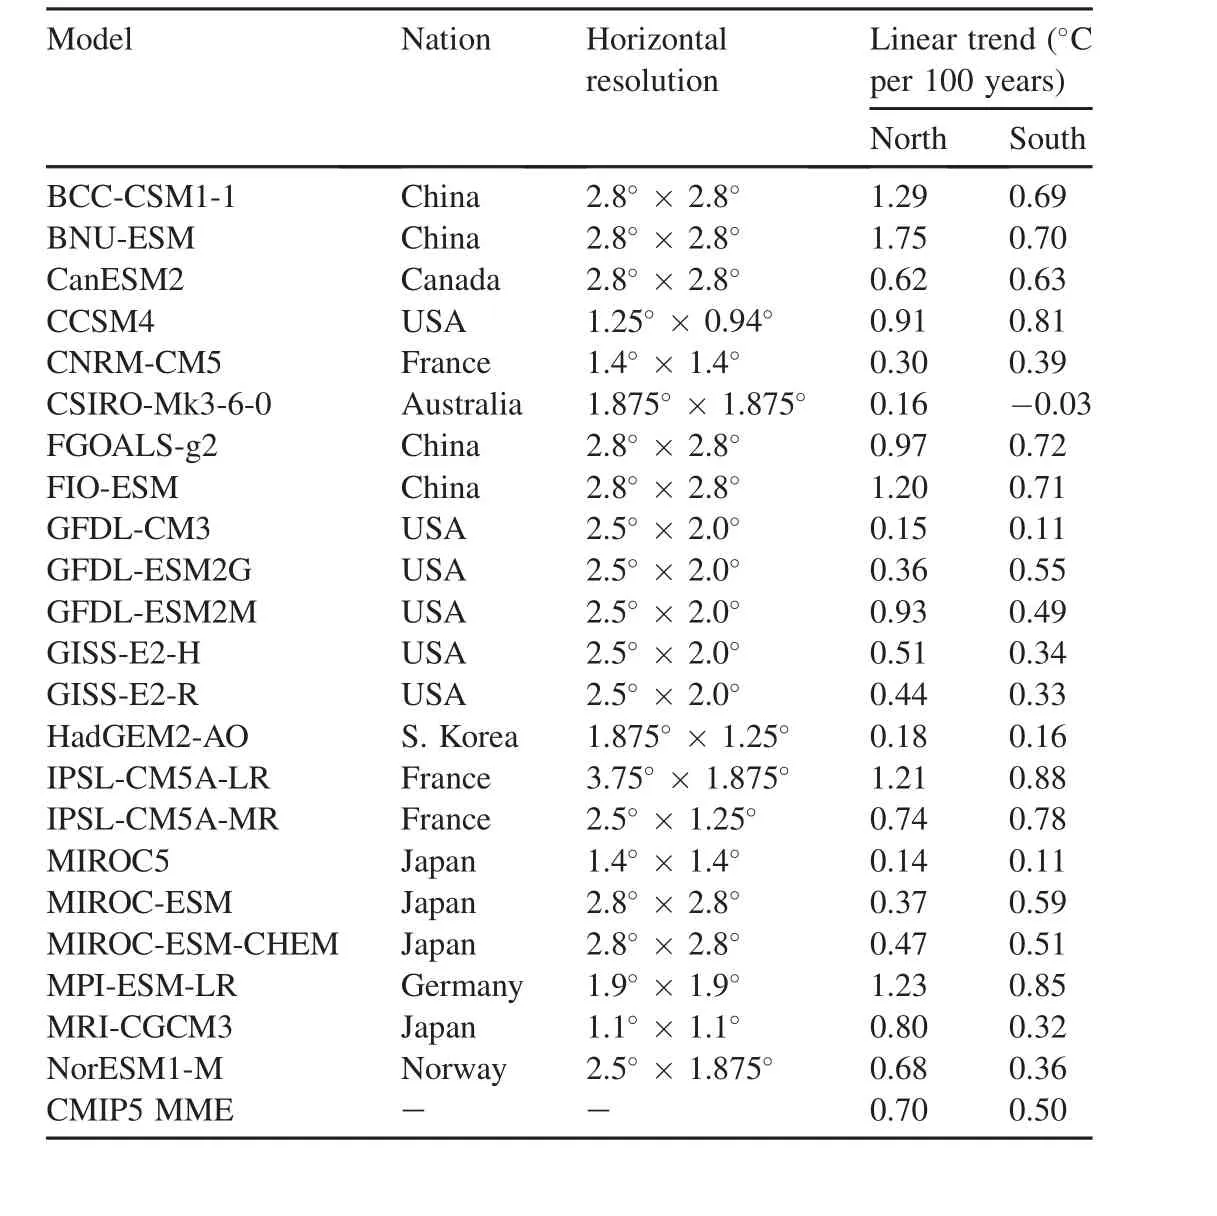
Table 1Details of the CMIP5 models and simulated linear trends.All trends are statistically significant at the 95%con fidence level based on Student's t-test.
Due to differences in spatial resolution among models and the observation data,for comparison,the bilinear interpolation method is used to interpolate outputs to 1°× 1°grids.The multi-model ensemble(MME)is calculated by the arithmetic ensemble means of the 22 CMIP5 model outputs,and models demonstrating good performance in the NBR and SBR are selected by using trend analysis and comprehensive Taylor diagram methods.In this study,we consider 1986-2005 to be the present climatology,as recommended by IPCC AR5,and three time periods of 20 years,i.e.,2016-2035(the early 21st century),2046-2065 (the middle 21st century),and 2081-2100(the end 21st century),to analyze future temperature changes in the study areas under the RCP2.6,RCP4.5,and RCP8.5 scenarios.
ATaylor diagram(Taylor,2001)is a plot that can summarize the degree of correspondence between simulated and observed fields.In this diagram,the spatial correlation coef ficient and root-mean-square(RMS)difference between two fields,along with the ratio of the standard deviations(STDs)of the two patterns,are simultaneously indicated by a single point on the plot.The diagram is particularly useful in assessing the relative merits of competing models and monitoring the overall performance of a model as it evolves.We use trend analysis and comprehensive Taylor diagram methods to select the models that show excellent performance in both time evolution and spatial distribution in our selected study regions.
3.Model assessment
To compare the temporal evolution of modeled and observed SATs,Fig.2 shows changes in SATs from 1901 to 2005 over the critical Belt and Road region.First,consistency was observed in the observational data.For the NBR(Fig.2a),long-term variations of the two observational datasets,CRU and GISS,are consistent.The line trend in 1901-2005 is 1.08°C per 100 years based on GISS and 1.14°C per 100 years based on CRU.Similarly,for the SBR(Fig.2b),the line trend is 0.78°C per 100 years based on GISS and 0.76°C per 100 years based on 20CR.Thus,the observational data may be concluded to present high consistency and reliability.
The observed SATs clearly show significant increasing trends in both the NBR and SBR throughout the 20th century.In particular,increases in SAT are more significant after 1971.Furthermore,most of the models can reproduce the time evolution of SAT.The model ensemble shows less interannual variability than that determined from observations,and the CMIP5 MME tendency is smaller than that of observations in both study regions(Table 1).In the NBR,the trend in 1901-2005 is 1.08°C per 100 years based on GISS and 1.14°C per 100 years based on CRU.The trend of CMIP5 MME is 0.70°C per 100 years.The relative error between CMIP5 MME and the observations is as high as 37%.While most models can reproduce the trend of warming,the linear trends produced by some models are smaller than those revealed by observations;these models include CNRM-CM5(0.30°C per 100 years),CSIRO-Mk3-6-0(0.16°C per 100 years),GFDL-CM3(0.15°C per 100 years),HadGEM2-AO(0.18°C per 100 years),and MIROC5(0.14°C per 100 years).After 1971,the relative error is reduced to 22%(the trend of CMIP5 MME is 0.32°C per 10 years,that of GISS is 0.42°C per 10 years,and that of CRU is 0.40°C per 10 years).In the SBR,the trend is 0.78°C per 100 years based on GISS and 0.76°C per 100 years based on 20CR.The trend of CMIP5 MME is 0.50°C per 100 years.Nine model trends do not extend beyond 0.40°C per 100 years,and the relative error between MME and the observations is as high as 35%.Similarly,after 1971,the relative error between models is reduced to 15%(e.g.,the trend of CMIP5 MME is 0.16°C per 10 years,that of GISS is 0.17°C per 10 years,and that of 20CR is 0.19°C per 10 years).
Figs.3 and 4 show the spatial distribution of the annual mean SATs during 1986-2005 in the NBR and SBR.The features of the spatial pattern of the simulated SAT are similar to those of observations in both study regions.In the NBR,the simulated SAT is about 2°C lower than observations in the Tibetan Plateau.Furthermore,the STD of CMIP5(Fig.3c),which refers to the intra-model spread,is lower than 2.5°C in most regions;however,the STD is greater than 4°C in Pakistan and Sinkiang.The root-mean-square error(RMSE)of CRU(Fig.3d),which re flects differences between models and observations,is much larger in Pakistan and Sinkiang than in other areas.In Fig.4a and b,the minimum SAT in the northern portion of the SBR (around 22°-26°N,98°-108°E)is captured well by CMIP5 MME and is about 12°C.The low SAT in Malaysia can also be simulated well.Fig.4c shows that the STD is lower than 1.4°C in most of the SBR,which indicates that the consistency of CMIP5 models is high.The RMSE of 20CR(Fig.4d)is also fairly small.

Fig.2.Annual mean surface air temperature anomalies in the(a)north(NBR)and(b)south(SBR)of the Belt and Road region relative to the 1986-2005 climatology from two observations(north:GISS and CRU;south:GISS and 20CR)and 22 CMIP5 models and their ensemble means(CMIP5 MME).
For a detailed evaluation of model performance,the mean SAT during the period of 1986-2005 is analyzed by Taylor diagrams(Fig.5).The radial distance from the origin is the normalized STD,and the angle indicates the spatial correlation coef ficient.The distance from the REF point is the RMSE.CMIP5 MME is evidently better than most of the models shown in Fig.5.On the one hand,the spatial correlation coef ficient of CMIP5 MME is 0.91/0.97 in the NBR/SBR,the spatial correlation coef ficient of IPSL-CM5A-MR(0.94)and MPI-ESM-LR(0.97)show higher performance in the two areas,respectively.On the other hand,the normalized STD(i.e.STD of the observed)(Taylor,2001)is better when it is closer to a value of one.As is evident from our findings,in the NBR(Fig.5a),MPI-ESM-LR(normalized STD=0.99)shows high performance,while BCC-CSM1(normalized STD=0.73)shows lower performance in simulating spatial distributions.In the SBR(Fig.5b),CanESM2 shows higher performance while BCC-CSM1 shows lower performance for simulating spatial distributions.
Taking the above factors(results of trend analysis and comprehensive Taylor diagram methods)together,we selected the models showing high performance in both time evolution and spatial distribution to project future SAT changes in the NBR and SBR.In the NBR,seven models,including CCSM4,FGOALS-g2,GFDL-ESM2M,IPSL-CM5A-LR,IPSLCM5A-MR,MPI-ESM-LR,and MRI-CGCM3,are selected to project future SAT changes under the RCP2.6,RCP4.5,and RCP8.5 scenarios.Likewise,in the SBR,nine models,including BNU-ESM,BCC-CSM1-1,CanESM2,CCSM4,FGOALS-g2,FIO-ESM,IPSL-CM5A-LR,IPSL-CM5A-MR,and MPI-ESM-LR,are selected.The MME is calculated by the arithmetic ensemble mean.
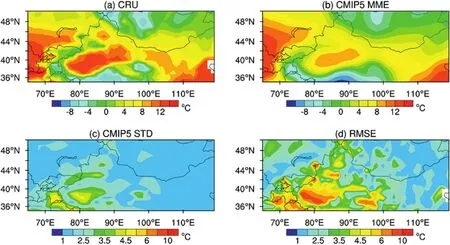
Fig.3.Annual mean surface air temperatures during 1986-2005 in the north of the Belt and Road region(NBR),(a)CRU,(b)CMIP5 MME,(c)STD of CMIP5,(d)RMSE with regard to CRU.
4.Future projection
The projection of annual mean SATs in the NBR and SBR under the different RCP scenarios from 1901 to 2100 is shown in Fig.6 based on the MME with one inter-model STD.SAT changes with one inter-model STD for the mean of each 20-year period in the NBR and SBR are given in Table 2.The results show that the projected annual mean SAT increases until the middle of 21st century under RCP2.6 and then begins to decrease slightly for 2081-2100.The SAT change is(1.16 ± 0.29)°C in the NBR and(0.72 ± 0.32)°C in the SBR.For RCP4.5,the SAT increases until the middle to late 21st century and remains stable thereafter;the SAT change for the end 21st century is(2.41 ± 0.54)°C in the NBR and(1.55 ± 0.44)°C in the SBR.The SAT continues to increase under RCP8.5 and reaches(6.04± 1.10)/(3.70± 0.69)°C in the NBR/SBR by 2100.In Fig.6,the gray shaded region becomes broader with increasing projection time,i.e.,the one inter-model STD becomes larger,which means the uncertainty increases with time under the three emission scenarios.
In Table 2,the SAT in the NBR is predicated to increase by(1.16± 0.29)°C,(2.41± 0.54)°C,and(5.23± 1.02)°C under RCP2.6,RCP4.5,and RCP8.5,respectively.The SAT is predicated to change by(0.72 ± 0.32)°C,(1.55 ± 0.44)°C,and(3.33 ± 0.65)°C under RCP2.6,RCP4.5,and RCP8.5 in the SBR.While the result of future warming in the NBR is similar to that in China(Tian et al.,2015),the predicted results in the SBR are lower.Warming is found in all regions,and greater warming is found in the NBR than in the SBR.In addition,the increase in SAT becomes larger in higheremission scenarios.
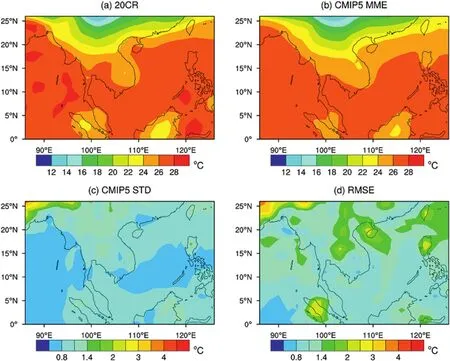
Fig.4.Annual mean surface air temperatures during 1986-2005 in the south of the Belt and Road region(SBR),(a)20CR,(b)CMIP5 MME,(c)standard deviation of CMIP5,(d)RMSE with regard to 20CR.
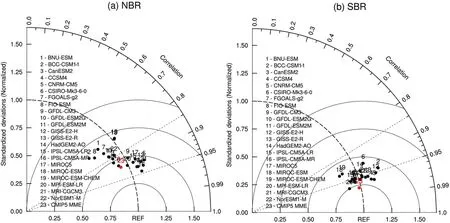
Fig.5.Taylor diagrams of the statistics of averaged surface air temperatures during 1986-2005(a)north,(b)south(1-22:22 CMIP5 models;red dot:CMIP5 MME;REF:observation).
In the NBR (Fig.7),greater warming is found in Kazakhstan and the Tibetan Plateau.In the early 21st century,the increase in SAT remains at the same level under the three different RCP scenarios,i.e.,the emission scenarios do not lead to SAT changes.In the middle 21st century,which can be considered as a transition period,greater warming is observed,but this warming is less than that at the end of the century.Under RCP8.5,the greatest warming is found in Kazakhstan(approximately 3.4°C).At the end of the century,warming increases and the emission scenarios prevail compared with the two former periods,here,the greatest warming is 6.2°C.

Table 2Surface air temperature changes with one inter-model standard deviation under different RCP scenarios in the north and south of the Belt and Road region(unit:°C).
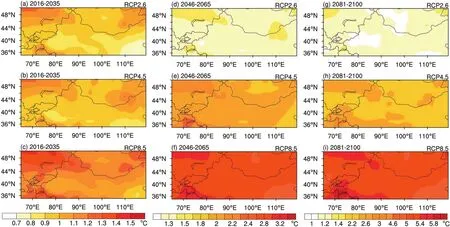
Fig.7.Spatial distribution of the changes in annual mean surface air temperature in the north of the Belt and Road at the(left to right)early(2016-2035),middle(2046-2065),and end(2081-2100)of the 21st century relative to 1986-2005 under the RCP2.6,RCP4.5,and RCP8.5 scenarios(top to bottom).
In the SBR(Fig.8),greater warming is found in the northern part of the region(around 20°-26°N,95°-105°E),and the emission scenarios do not lead to different SAT responses in the early period.Under the RCP8.5 scenario,the greatest warming(approximately 4.6°C)occurs in the northern portion of this region at the end 21st century.Temperature differences between the NBR and SBR are likely to decrease in the future.
5.Summary and discussion
Based on CRU,GISS,and 20CR observations,we assessed the simulation capabilities of 22 CMIP5 models in the NBR(35°-50°N,65°-119°E)and SBR(0°-26°N,86°-126°E).Seven/nine models were then selected by calculating the arithmetic ensemble means in the NBR/SBR to project future SAT changes under three RCP scenarios.
(1)In the NBR,the SAT trend in 1901-2005 is 1.08,1.14,and 0.70°C per 100 years for GISS,CRU,and CMIP5 MME,respectively.In the SBR,the corresponding trends are 0.78,0.76,and 0.50°C per 100 years for GISS,20CR,and CMIP5 MME,respectively.After 1971,the relative error is reduced to 22%in the NBR and to 15%in SBR.The observed SAT shows significant increasing trends in both the NBR and SBR over the past century.In particular,increases in SAT are more significant after 1971.
(2)Using trend analysis and comprehensive Taylor diagram methods to assess 22 CMIP5 models,seven models were selected for the NBR,CCSM4,FGOALS-g2,GFDLESM2M,IPSL-CM5A-LR,IPSL-CM5A-MR,MPIESM-LR,and MRI-CGCM3.Similarly,nine models were selected for the SBR,BNU-ESM,BCC-CSM1-1,CanESM2,CCSM4,FGOALS-g2,FIO-ESM,IPSLCM5A-LR,IPSL-CM5A-MR,and MPI-ESM-LR.
(3)In the NBR/SBRregion,the end 21stcentury(2081-2100)show warming of(1.16± 0.29)/(0.72± 0.32)°C,(2.41±0.54)/(1.55±0.44)°C,and(5.23±1.02)/(3.33 ± 0.65)°C for RCP2.6,RCP4.5,and RCP8.5,respectively.The annualmean SAT is projected to increase in the next 100 years,with greater warming in the NBR than in the SBR.And the uncertainty increases with time under the three RCP scenarios.
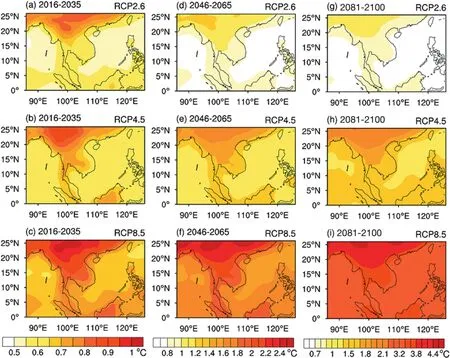
Fig.8.Spatial distribution of the changes in annual mean surface air temperature in the south of the Belt and Road region at the early(2016-2035),middle(2046-2065),and end(2081-2100)(left to right)of the 21st century relative to 1986-2005 under the RCP2.6,RCP4.5,and RCP8.5 scenarios(top to bottom).
(4)In the early 21st century,the emission scenarios do not lead to SAT changes.However,by the end of the 21st century,warming increases and the emission scenarios prevail.Under RCP8.5,the greatest warming observed for the NBR is 6.2°C in Kazakhstan while that for the SBR is approximately 4.6°C in the northern part of this region.In addition,increases in SAT become larger in higher-emission scenarios.
Although some results of future SAT changes over the Belt and Road region have been obtained,uncertainty may further arise due to the complexities of parameterization in physical processes,dynamic frameworks.More con fidence can be attained by using statistical downscaling techniques or improving the parameterization of physical processes.Furthermore,using different weighted average methods,such as multiple linear regression and Bayesian averaging,to determine ensemble means of CMIP5 model is needed.
Acknowledgments
We thank the Climate Research Unit for the CRU TS3.10 data,NOAA for the 20CR v2c data,and NASA for the GISS data.We also thank Dr.XU Chong-Hai for providing the model outputdata.Thiswork isfounded by the NationalKey Research and Development Program of China(2016YFA0602703 and 2016YFA0600704),and the National Natural Science Foundation of China(41330527).
References
Compo,G.P.,Whitaker,J.S.,Sardeshmukh,P.D.,et al.,2011.The twentieth century reanalysis project.Q.J.R.Meteorol.Soc.137,1-28.
Guo,Y.,Dong,W.J.,Ren,F.M.,et al.,2013.Surface air temperature simulations over China with CMIP5 and CMIP3.Adv.Clim.Change Res.4,145-152.
Hansen,J.,Ruedy,R.,Sato,M.,et al.,2010.Global surface temperature change.Rev.Geophys.48.
Harris,I.,Jones,P.D.,Osborn,T.J.,et al.,2014.Updated high-resolution grids of monthly climatic observations:the CRU TS3.10 Dataset.Int.J.Climatol.34,623-642.
He,C.,Zhou,T.J.,2015.Responses of the western north Pacific subtropical high to global warming under RCP4.5 and RCP8.5 scenarios projected by 33 CMIP5 models:the dominance of tropical Indian Ocean-Tropical Western Pacific SST gradient.J.Clim.28,365-380.
He,C.,Wu,B.,Zou,L.W.,et al.,2017.Responses of the summertime Subtropical Anticyclones to global warming.J.Clim.30,6465-6479.
He,C.,Zhou,T.J.,Lin,A.,et al.,2015.Enhanced or weakened western north Pacific subtropical high under global warming?Sci.Rep.5,16771.
IPCC,2013.Climate Change 2013:the Physical Science Basis.Contribution of Working Group I to the Fifth Assessment Report of the Intergovernmental Panel on Climate Change.Cambridge University Press,Cambridge and New York.http://www.ipcc.ch/report/ar5/wg1/.
Jiang,Z.H.,Song,J.,Li,L.,et al.,2012.Extreme climate events in China:IPCC-AR4 model evaluation and projection.Climatic Change 110,385-401.
Kitoh,A.,Endo,H.,Krishna Kumar,K.,et al.,2013.Monsoons in a changing world:a regional perspective in a global context.J.Geophys.Res.Atmos.118,3053-3065.
Knutson,T.R.,Zeng,F.,Wittenberg,A.T.,2013.Multi-model assessment of regional surface temperature trends:CMIP3 and CMIP5 20th century simulations.J.Clim.26,8709-8743.
Kumar,S.,Merwade,V.,Kinter,J.L.,et al.,2013.Evaluation of temperature and precipitation trends and long-term persistence in CMIP5 twentiethcentury climate simulations.J.Clim.26,4168-4185.
Liu,W.D.,2015.Scientific understanding of the Belt and Road Initiative of China and related research themes.Prog.Grogr.34,538-544.
Liu,Y.H.,Feng,J.M.,Ma,Z.G.,2014.An analysis of historical and future temperature fluctuations over China based on CMIP5 simulations.Adv.Atmos.Sci.31,457-467.
Meinshausen,M.,Smith,S.J.,Calvin,K.,et al.,2011.The RCP greenhouse gas concentrations and their extensions from 1765 to 2300.Clim.Change 109,213-241.
Moss,R.H.,Edmonds,J.A.,Hibbard,K.A.,et al.,2010.The next generation of scenarios for climate change research and assessment.Nature 463,747-756.
NDRC(National Development and Reform Commission),MFA(Ministry of Foreign Affairs),MCC(Ministry of Commerce of China),2015.Vision and Actions on Jointly Building Silk Road Economic Belt and 21st-century Maritime Silk Road.Foreign Languages Press,Beijing.http://en.ndrc.gov.cn/newsrelease/201503/t20150330_20669367.html.
Taylor,K.E.,2001.Summarizing multiple aspects of model performance in a single diagram.J.Geophys.Res.106,7183-7192.
Taylor,K.E.,Stouffer,R.J.,Meehl,G.A.,2012.An overview of CMIP5 and the experiment design.Bull.Am.Meteorol.Soc.93,485-498.
Tian,D.,Guo,Y.,Dong,W.J.,2015.Future changes and uncertainties in temperature and precipitation over China based on CMIP5 models.Adv.Atmos.Sci.32,487-496.
Wang,L.,Chen,W.,2013.A CMIP5 multimodel projection of future temperature,precipitation,and climatological drought in China.Int.J.Climatol.34,2059-2078.
Xu,C.H.,Xu,Y.,2012a.The projection of temperature and precipitation over China under RCP scenarios using a CMIP5 multi-model ensemble.Atmos.Oceanic Sci.5,527-533.
Xu,Y.,Xu,C.H.,2012b.Preliminary assessment of simulations of climate changes over China by CMIP5 multi models.Atmos.Oceanic Sci.5,489-494.
Yang,S.L.,Feng,J.M.,Dong,W.J.,et al.,2014.Analyses of extreme climate events over China based on CMIP5 historical and future simulations.Adv.Atmos.Sci.31,1209-1220.
Zhang,Y.,2012.Projections of 2.0°C warming over the globe and China under RCP4.5.Atmos.Oceanic Sci.5,514-520.
Zhao,T.B.,Chen,L.,Ma,Z.G.,2014.Simulation of historical and projected climate change in arid and semiarid areas by CMIP5 models.Chin.Sci.Bull.59,412-429.
Zhou,T.J.,Yu,R.C.,2006.Twentieth-century surface air temperature over China and the globe simulated by coupled climate models.J.Clim.19,5843-5858.
Zou,L.W.,Zhou,T.J.,2015.Asian summer monsoon onset in simulations and CMIP5 projections using four Chinese climate models.Adv.Atmos.Sci.32,794-806.
 Advances in Climate Change Research2018年1期
- Advances in Climate Change Research的其它文章
- Multi-model comparison of CO2 emissions peaking in China:Lessons from CEMF01 study
- Analysis on energy demand and CO2 emissions in China following the Energy Production and Consumption Revolution Strategy and China Dream target
- Carbon emission scenarios of China's power sector:Impact of controlling measures and carbon pricing mechanism
- Co-controlling CO2 and NOx emission in China's cement industry:An optimal development pathway study
- A cautionary note on decadal sea level pressure predictions from GCMs
- Climate change projections for the Middle East-North Africa domain with COSMO-CLM at different spatial resolutions
