
Analysis on energy demand and CO2 emissions in China following the Energy Production and Consumption Revolution Strategy and China Dream target
2018-05-24 07:48:09LIJiFengMAZhongYuZHANGXiongWENZhiCho
LI Ji-Feng*,MA Zhong-YuZHANG Y-XiongWEN Zhi-Cho
a Policy Simulation Laboratory,State Information Center,Beijing 100045,China
b School of Environment and Natural Resources,Renmin University of China,Beijing 100872,China
1.Introduction
In 2015,the Paris Agreement proposed a mean global temperature target(UNFCCC,2015)of no more than 1.5-2.0°C higher than pre-industrial levels.Studies should identify how much of the overall increase will be caused by China.
At the end of 2016,China issued the Energy Production and Consumption Revolution Strategy(2016-2030)(hereinafter referred to as the Energy Strategy)(NDRC,2017),which included several targets.By 2020,total primary energy(TPE)is expected to be less than 5 Gtce,whereas the proportion of non-fossil fuels(NFFs)used to produce TPE will total more than 15%.By 2030,TPE will measure less than 6 Gtce,the proportion of NFFs will approximate 20%,the share of natural gas will total 15%,and CO2emissions will have peaked.By 2050,TPE will stabilize,and the proportion of NFFs will reach higher than 50%.These targets provide a general picture of the Chinese energy system of the future,but much uncertainty remains in relation to estimates of future energy requirements and CO2emissions.The most significant uncertainties relate to forecasts regarding economic development.Thus,this study focuses on the social and economic development strategy known as the China Dream.The China Dream strategy was proposed in 2012 by General Secretary Xi Jinping,who stated that“the target of building China into a modern socialist country that is prosperous,strong,democratic,culturally advanced,and harmonious can surely be achieved by 2049.”Expectedly,China must pursue this strategy in the future and thus must also embrace implementation of the Energy Strategy.
Numerous domestic and international studies have researched China's future trends.Earlier studies focused on estimating the possible timing of peak carbon emissions in China.Jiang et al.(2009)and 2050 CECERG(2009)showed that under a baseline scenario,China's carbon emissions will peak in 2040,and under the enhanced low-carbon scenario,the peak will reach in 2030.The China Human Development Report 2009-2010,issued by the United Nations Development Program(UNDP,2010),states that China's carbon emissions will not peak by 2050 under the baseline scenario,but the peak under the emission reduction scenario will occur in 2030 albeit at a huge socioeconomic cost.After the Paris Conference,the focus of studies has gradually shifted to analyzing ways in which peak carbon emissions can be achieved prior to 2030.Ma and Chen(2016)studied China's probable peak carbon emissions and future pathway and observed that under the 2030 peak scenario,large amounts of new and renewable energy sources should be developed,and energy-saving and emission reduction technologies should be promoted for energy-intensive industries.These conditions will result in peak carbon emissions of 10.0-10.8 Gt by 2030.However,some recent studies have shown that China should reach peak emissions before 2025(RGCEPCEC,2017).
In general,most of these studies focus on energy system analysis and calculation of carbon emissions rather than undertaking a detailed,systematic analysis of macroeconomic growth and industrial changes.Few studies showed the appropriate pathway for economic development that will ensure achievement of China's targets by 2050.
This study strengthens the research on China's future economic and social development strategy targets and pathways and provides recommendations regarding optimum economic and social development scenario after conducting an in-depth analysis of the Energy Strategy targets.A combination of a computable general equilibrium(CGE)model and an energy supply and demand system model(ESDM)is used for quantitative study.
The rest of this paper is organized as follows.Section 2 brie fly introduces the model that is used.Section 3 introduces China's economic and social development pathway toward 2050.Section 4 analyzes the pathway necessary to meet the Energy Strategy target based on the recommended scenario and its CO2emissions trajectory.Section 5 concludes this paper.
2.The model
Studies on CO2emissions mitigation must cover long time periods and examine a wide range of economic and social development factors.The models that are used can generally be divided into two categories.One category comprises topdown economic models,which include the CGE model used by Li et al.(2010,2012,2014),Liu et al.(2014),Lou(2014),and Peng and Yu(2017).The other consists of bottom-up ESDM such as the TIMES model(Loulou et al.,2005)and the Model for Alternative Energy Supply Systems General(MESSAGE)(Messner and Schrattenholzer,2000).In China,one of the most popular models is the IPAC model(Jiang et al.,2009).
This study adopts a similar approach to existing studies and uses models based on China's independently developed largescale dynamic CGE model and medium-and long-term ESDMs.
2.1.State Information Center General Equilibrium(SICGE)model
SICGE model is a dynamic national CGE model that has been jointly developed by China's State Information Center and the Centre of Policy Studies at Monash University in Australia since 2007.The model is operated in GEMPACK software.After 10 years of development using the main theoryand structure of the MONASH model(Dixon and Rimmer,2002),the SICGE model has fully absorbed and integrated the characteristics and data of the Chinese economy(Li et al.,2012,2014).
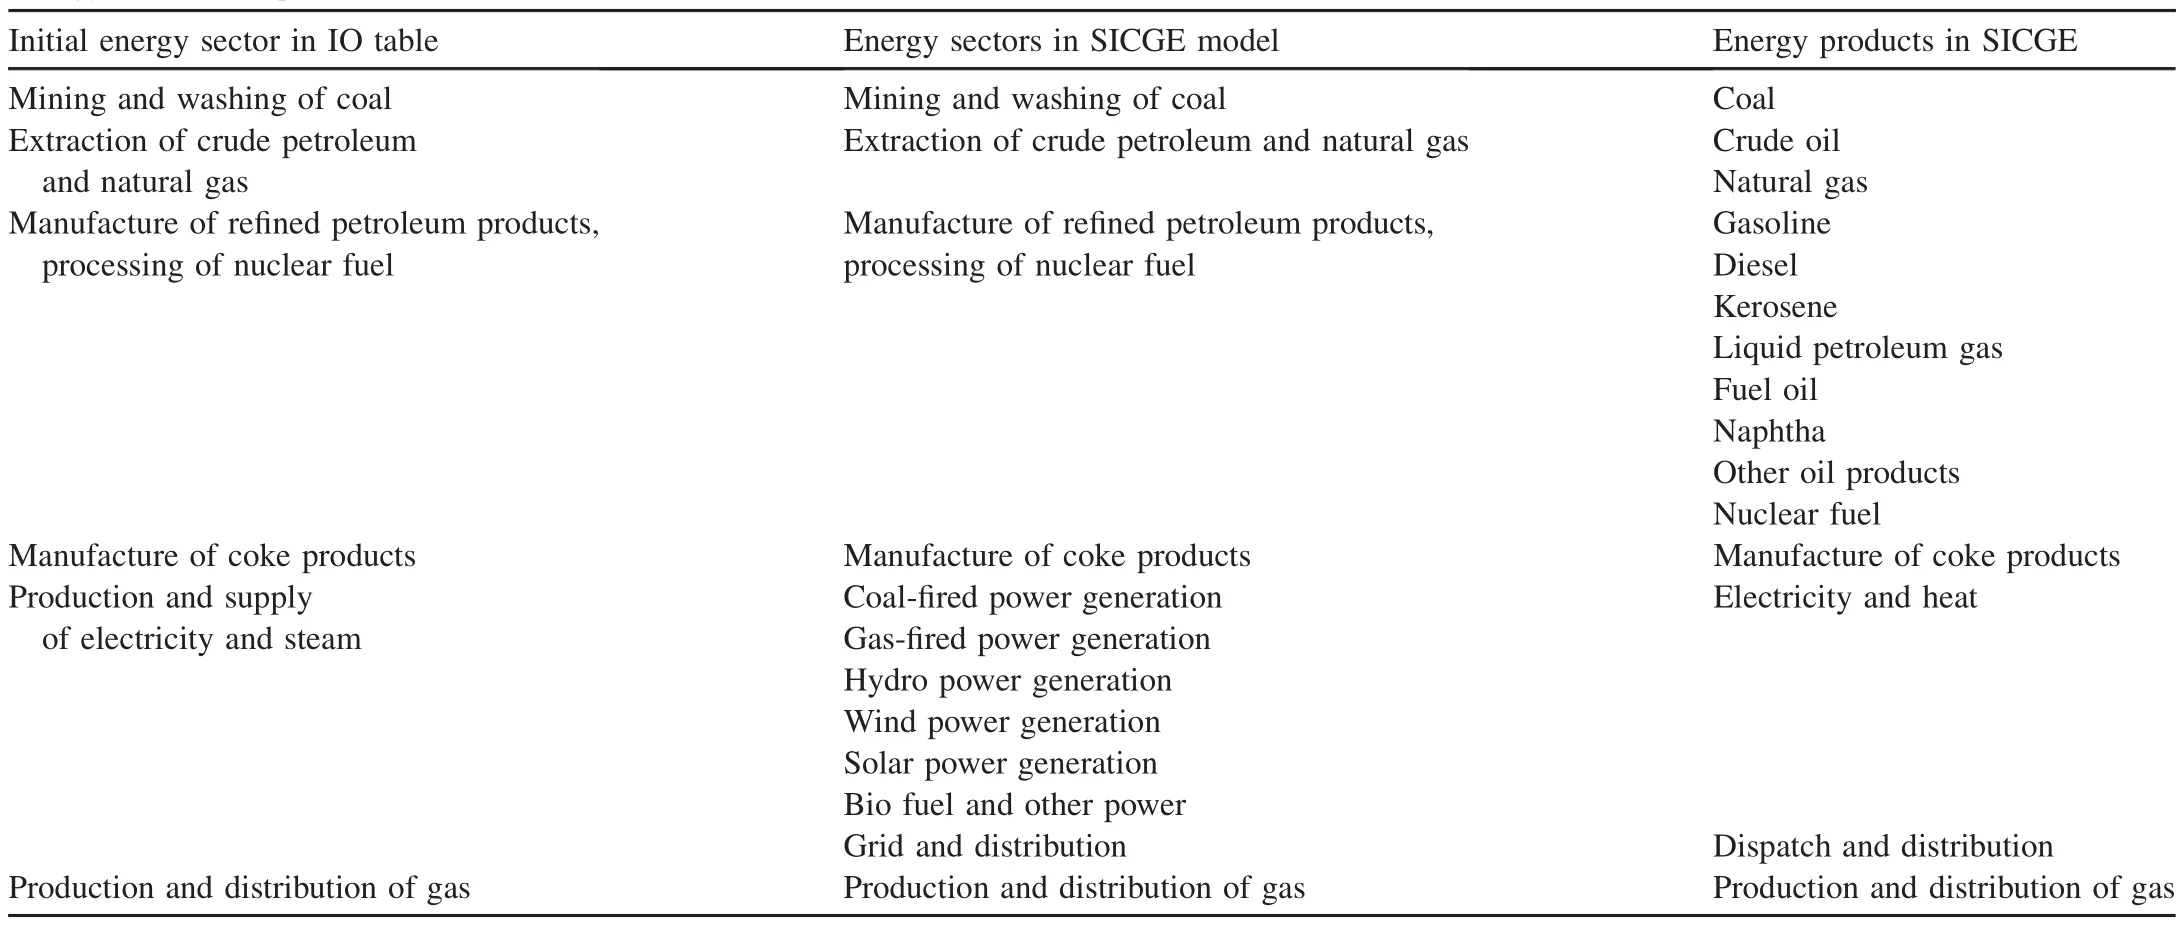
Table 1Energy sectors and products in SICGE.
In the updated version of SICGE,the initial database was built based on the most detailed 2012 Input-Output Table(NDRC,2017),which included 139 sectors.To facilitate the link with ESDM,the initial five energy sectors are split into 12 sectors and 15 energy products,as shown in Table 1.
In the general production function for each sector,a multilevel nested production function has been adopted,as shown in Fig.1.By nested CES function,we also introduce a substitution between energy and capital,between coal product and oil/gas and electricity,and between different sources of electricity,as studied by Zhang et al.(2011).We adopt an annual recursive dynamic mechanism in SICGE;thus,substitution elasticity will re flect short-term substitution effects.
2.2.ESDM
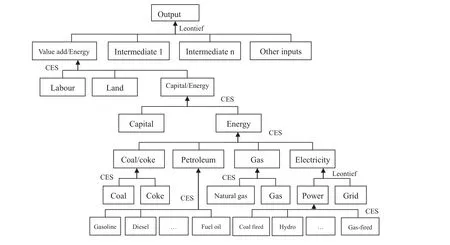
Fig.1.Nested production function in SICGE.
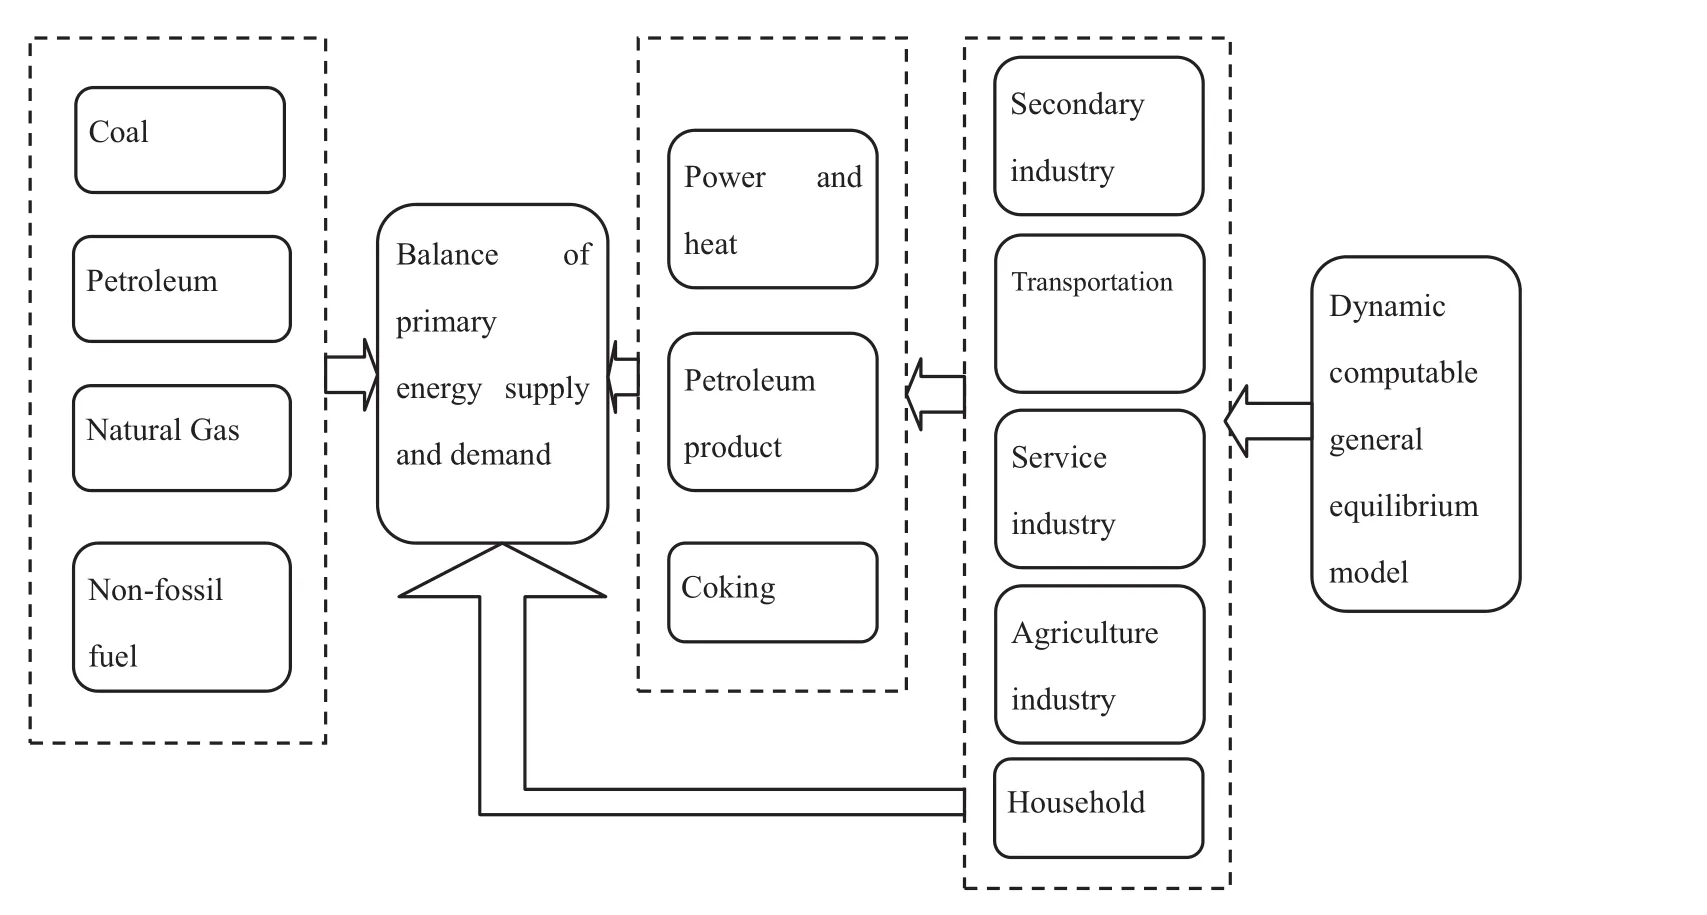
Fig.2.Framework of ESDM.
Using economic and social development indices as driving variables,we build an energy system demand model by EXCEL(Fig.2).ESDM measures and calculates final energy(FE)demand(demands of coal,all kinds of petroleum products,natural gas,electricity,heating,and other energy)in five sectors,including agriculture,industry and construction,transportation,services(excluding transportation),and residential living.Then,the primary energy(PE)requirements are calculated according to FE demand using power and heat conversion module settings.Numerous technological parameters in the ESDM have been developed through extensive consultations with experts in the energy sector and upstream and downstream industrial sectors.
2.3.Connection mechanism between CGE models and ESDMs
The connection mechanism between CGE models and ESDMs has been the subject of several studies,and we revisit this subject using the methods proposed by Zhang and Li(2007)and Zhang et al.(2011).Following the soft-link method,the CGE model is used to estimate future trends in various economic sectors as input variables for the ESDM,which is then used to calculate FE and PE demand trends and associated outcomes,such as levels of CO2emissions.In this study,four linkages are built:
1)For energy-intensive sectors,such as ferrous metal,nonferrous metal,and nonmetallic mineral product sectors,we forecast the manufacture of the main products in base case by consulting sectoral experts in ESDM,estimate the elasticity between changes in quantity of ESDM and changes in value added in SICGE,and allow for exogenous elasticity under the policy scenario.
2)For most non-intensive sectors,we usually estimate the energy demand by the forecast of value-added in SICGE and the energy intensity,which is calculated with historical energy demand and sectoral value-added.
3)The energy demand in building covers most of household living and service industry (excluding transportation)and is mainly driven by the increase in building area rather than directly linked with the value added of tertiary industry in SICGE.
4)Meanwhile,changes in unit energy consumption coefficient for each economic activity are obtained from the ESDM and are inputted into the CGE model for parameter calibration.Although we opt not to use any software to fully achieve hard linkage and automatic iteration between the two models,changing trends in the two models in terms of comparable energy consumption coef ficient per unit value added synchronize after three or four rounds of manual iteration.
3.Economic and social development targets and paths in China until 2050
At present,China Dream is only a strategic,qualitative target for China's future development rather than a detailed roadmap.Thus,China Dream targets must be transformed into quantitative indices.Some important indices include GDP growth rate and the industrial mix.In this study,we attempt to estimate these two indices.The results are then used as main inputs to estimate FE and TPE demand in the ESDM.We decide not to examine different scenarios to allow for uncertainty of economic growth but apply target-oriented logic to determine the path necessary to realize China Dream.
3.1.Macro GDP growth rate estimation for 2016-2050
O'Neill and Stupnytska(2009)studied China's future medium-and long-term macroeconomic development and suggested that China's GDP growth rates in 2011-2020,2021-2030,2031-2040,and 2041-2050 will reach 7.9%,5.7%,4.4%,and 3.6%,respectively.In the scenario of rapid economic growth following implementation of“supply side structural reform”,Li and Lou(2016)suggested that China's economic growth during the 13th Five-Year Plan(2016-2020)and 14th Five-Year Plan(2021-2025)will total 6.5%and 5.8%,respectively.Based on these studies,we summarize the experiences of developed countries and strengthen the forecast in terms of the main factors underpinning economic development.The results are then inputted into the SICGE model to create the economic forecast scenario.
3.1.1.International experience in relation to long-term GDP growth rates
We examine GDP growth rate in several developed countries over the past few decades using data from the World Bank's database.Fig.3 shows the results.
The following conclusions can be drawn from Fig.3.
(1)During the period when GDP per capita rose from US$5000 to US$18,000,two development patterns were observed.One development was identified in Japan and South Korea and showed a continuous decline from double digits to just over 5%.Both countries are considered examples of a successful promotion to the ranks of developed countries and thus are worthy of further examination.The other development pattern was observed in western developed countries,in which GDP growth rates approximated 2%-5%.
(2)For most developed countries,when GDP per capita rose above US$20,000,GDP growth rate varied from 4%to 2%.Average GDP growth rate in Japan and the U.S.reached more than 3%,whereas those for UK,Germany,and France ranged from 1%to 3%.
(3)Notably,Japan's Lost Decades,starting from 1996,GDP per capita fell from US$59,000 to US$36,000,and longterm GDP growth rate hovered around 1%.Japan's lesson should be well learned for China to maintain long-term development.
(4)To meet the China Dream targets,by considering that China GDP per capital approximates US$10,000 at the present period,between these two patterns,China will aim to follow the path of Japan and South Korea.That is,GDP growth rate should not fall below 5%until GDP per capita has reached US$18,000.Afterward,average GDP growth rate will decline but should not fall below 3%.
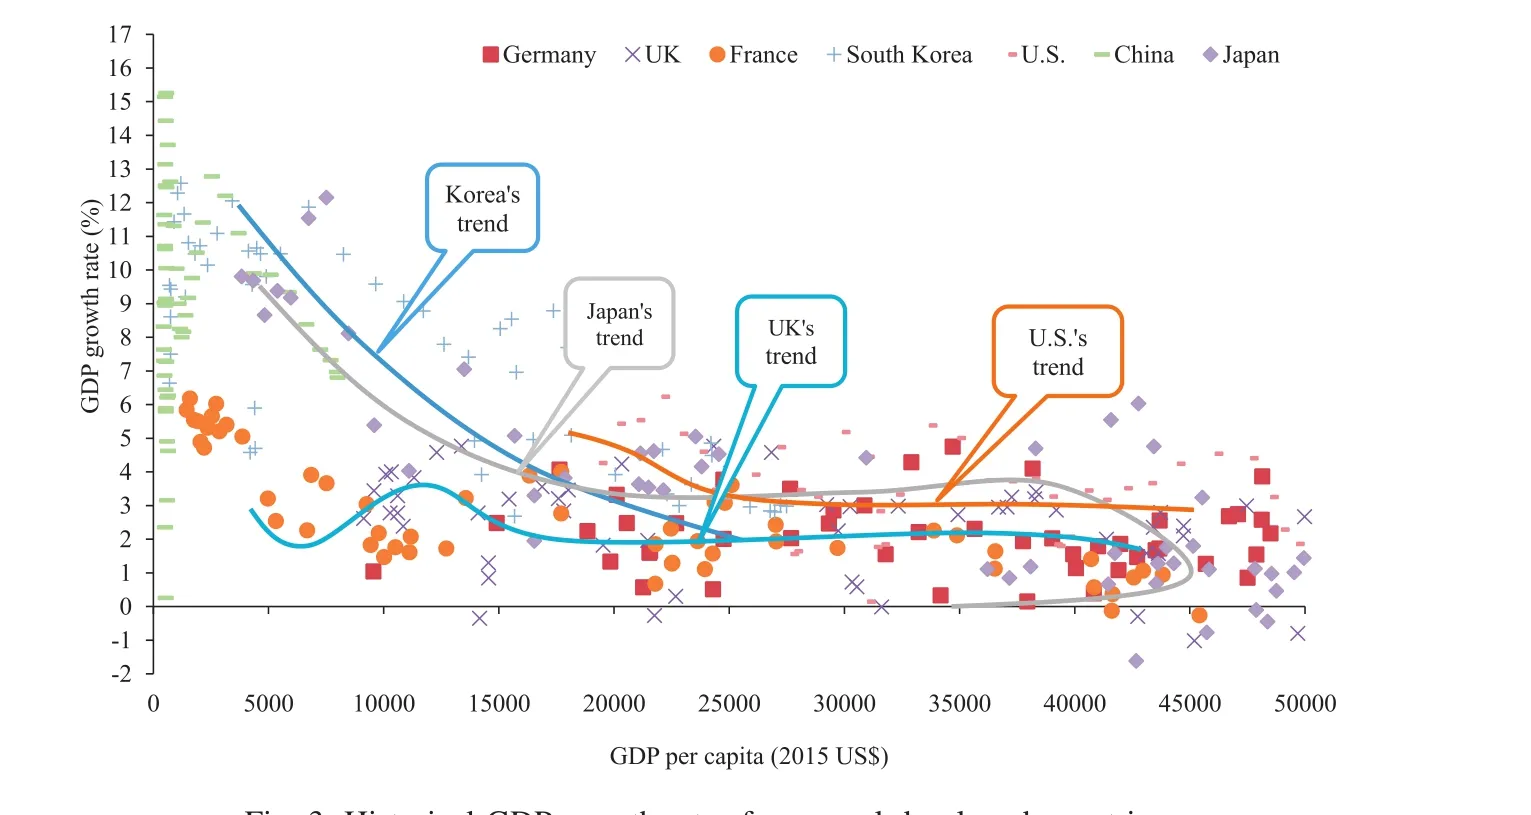
Fig.3.Historical GDP growth rates for several developed countries.
3.1.2.Important factor analysis
China has entered a New Normal period since 2012,and several important factors that will significantly impact future economic development trends must be examined.In this study,three factors that are easily quantified and closely related to energy consumption are examined:population growth,construction and real estate development,and the number of cars.
(1)Population and aging trends
Population and aging trends will significantly in fluence China's future economic development.The latest data from the Population and Family Planning Commission1http://www.nhfpc.gov.cn/xcs/s3574/201510/b03bbb9da18044c299f673f0b84eeab1.shtml.show that China's population will peak at 1.45 billion before 2030;this value is almost the same as that predicted by the United Nations(UN,2017).Population will decline to less than 1.4 billion by 2050,whereas the number of elderly people in China will continually increase.The number of people aged 65 and above is expected to reach 350 million in 2050,which is 2.4 times the number in 2015 and will account for 25%of the total population.Related to this aging trend,labor supply will decline to 830 million in 2050,down by 170 million compared with that in 2015.Following the aging trend,rates of social savings will decrease,and share of final consumption,especially tertiary services,will increase.
(2)Building and real estate development trends
Existing studies(SQRIMHURD,2016)show that in 2015,China's construction area stock will approximate 60 billion m2,including residential area stock of 17.6 billion m2for urban residents and 27.6 billion m2for rural residents and urban commercial construction area stock of 14 billion m2.By assuming the per capita urban residential construction area should approach 40 m2,whereas the per capita public construction area should be about 20 m2when China's construction area reaches its peak,the peak construction area was expected to reach 92 billion m2at 2040(SQRIMHURD,2016).Although production capacity of the construction industry in recent years has totaled 3-4 billion m2per year,from the perspective of ensuring a stable and sustainable development path for the real estate industry,we suggest that the rapid expansion of China's real estate industry will cease,and construction area will decline from an annual average of 3-4 billion m2during the 13th Five-Year Plan to 2.3 billion m2during the 14th Five-Year Plan and 1.7 billion m2during the 15th Five-Year Plan and will then fall to 0.3-0.4 billion m2per year.Considering that one-quarter of total annual capital formation has been in real estate in recent years,this future reduction in investment will reduce economic growth,and the role of the real estate industry in driving the economy will continually weaken.
(3)Car ownership
Private car ownership is another important measure of final consumption, re flecting the development of various manufacturing sectors.Since the beginning of the 21st century,China's car population has risen dramatically,increasing from 14.5 million to 162.8 million in 2015 at an average annual growth rate of 16%.Growth in car population usually follows an S-shape trend(Dargay et al.,2007);however,considering that China's per capita GDP only reached US$8000 in 2015,high growth rate is expected to continue for a long time.Numerous studies have examined the growth of car ownership in China(Wu et al.,2014;Huo and Wang.,2012),and based on these studies,we expect continual rapid growth until 2035,with the level of car ownership in China eventually reaching a peak of 350-400 cars per 1000 people by 2050,at which point car population will reach more than 500 million(Fig.4).
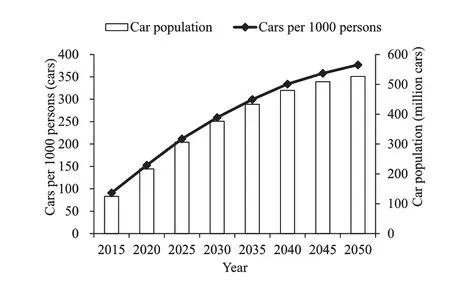
Fig.4.China's projected car population.
3.1.3.Macroeconomic forecasts
The China Dream strategy provides qualitative targets for the future,and in this study,we aim to quantify these targets.First,we quantify the GDP growth rate based on international experiences over different historical periods.Considering the growth trends in relation to population and car ownership and the smooth reduction in annual construction area,the period until 2030 will be the last opportunity for China to maintain a relatively high rate of economic growth.GDP per capita is expected to reach US$15,000-20,000 by 2030.Thus,we assume that GDP growth rate will total 6.5%from 2016 to 2020,6.2%from 2021 to 2025,and 5.3%from 2026 to 2030,resulting in an average GDP per capita of US$17,000 by 2030.After 2030,we assume that GDP growth rate will reach 4.4%from 2031 to 2040 and 3.5%from 2041 to 2050,with average GDP per capita reaching US$40,000 in 2050(Fig.5).
3.2.Changes in the industry mix between 2016 and 2050
The China Dream strategy involves not only maintaining macro GDP growth at a medium to high rate but also optimizing the industrial structure.According to the SICGE model theory,changes in the industrial structure will re flect the downward trend in annual construction area and the rising demand for cars and other services based on standard input-output rules.We also examined the government's Made in China 2025 plan and sought the opinions of several industrial experts regarding possible trends in the development of a range of energy-intensive products.All the information we obtained are inputted into the SICGE model to analyze changes in the industry mix in accordance with projected GDP growth.The following discuss some important findings in relation to the industry mix.
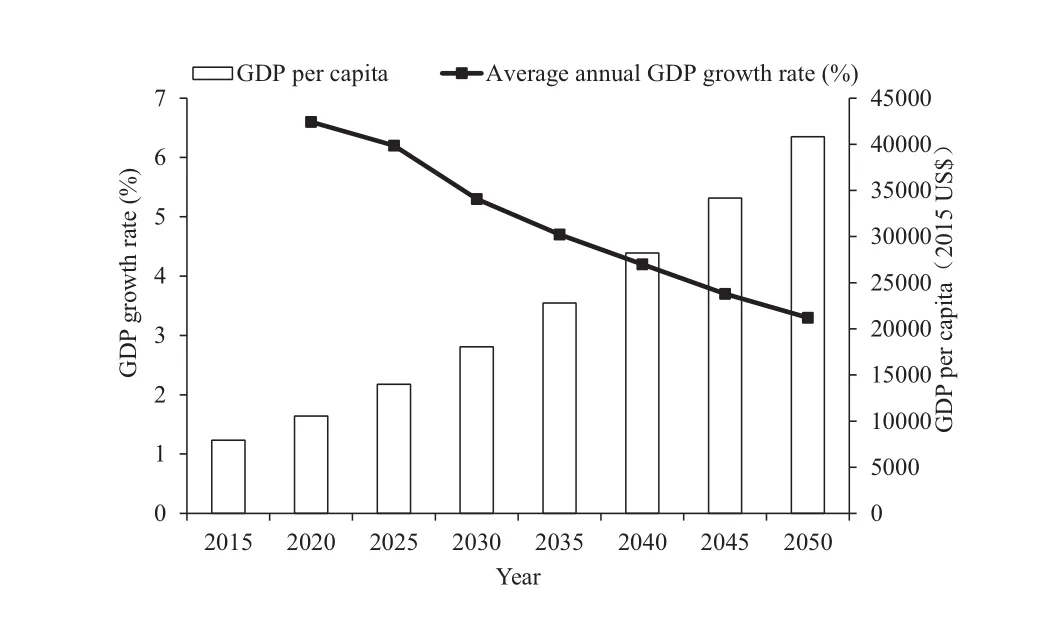
Fig.5.Forecast GDP growth in China.
(1)Steel production is expected to continuously decline.Currently,more than 50%of China's crude steel is used in the construction industry.With the expected continuous and gradual decline in average annual construction area in the future,the demand for crude steel will gradually decline and is expected to fall to 630 Mt by 2020 and 520 Mt by 2030 before gradually stabilizing at 200-250 Mt by 2040;such stable value will suf ficiently meet the needs of machinery and equipment,household appliance,and automobile manufacturing industries.Meanwhile,the proportion of electric steel will gradually increase as China's accumulation of scrap steel rises.This proportion is expected to reach 20%by 2025,25%in 2030,and 40%-70%in 2050 with reference to developed countries.
(2)Growth in consumption of nonferrous metals will remain stable until 2030.Nonferrous metals are important raw materials in the energy,transportation equipment manufacture,machinery,electronics,aerospace,and other equipment manufacturing industries.With the widespread promotion of the Made in CECERG,2009 plan in the future,the nonferrous metal industry is expected to continually grow at 3%per annum until 2030,which will drive the continual increase in energy consumption.After 2030,ore smelting will gradually be replaced by increased use of scrap nonferrous metals,and energy consumption will significantly reduce.
(3)Demand for traditional building materials will gradually decline,but demand for new building materials will increase.Increasing demand in diversification and the development of a low-carbon economy will gradually lead to a decline in demand for traditional building materials.The demand for cement and wallbuilding materials will peak during the 13th Five-Year Plan and then decline afterward.Cement production is expected to fall from 2.35 Gt in 2015 to 1.8 Gt in 2030 and then to 1 Gt in 2050;the final estimated value will suf ficiently meet the country's needs in relation to construction and maintenance of public infrastructure.Meanwhile,the continual increase in construction area until 2040 will result in a continual increase in maintenance and renovation industries,and thus,the demand for glass,ceramics,and various new materials will grow continuously.
(4)Overall,from now until 2050,the proportion of investment will gradually decline,whereas the proportion of consumption will steadily grow.China's future economic development will shift from production-driven to consumption-driven expansion,leading to a significant adjustment in the overall industry mix.The proportion of secondary industry will continually decline,whereas the proportion of tertiary industry will increase from 50.5%in 2015 to 60%(price in 2015,similarly hereinafter)in 2030,eventually rising to about 70%in 2050.The combined proportion of industrial,equipment manufacturing,and light industries will increase from 46%in 2015 to 58%in 2030 and then to 65%in 2050.
4.Energy supply and demand trajectory related to Energy Strategy
4.1.Scenario design
Applying economic and social development trend analysis,ESDM is used to predict China's future energy demands and carbon emissions.We only examine the Energy Strategy scenario using economic development data based on the China Dream strategy.To achieve the nominated strategic targets,transformation of the overall energy system must be accelerated,and the entire industry chain must be upgraded from energy exploitation,processing transition and terminal use,and considering construction of a clean,low carbon,safe,and ef ficient modern energy system as fundamental purposes.In accordance with the input-output mechanism in the energy system model,we first measure the future trend of varietyspecific FE demand in five sectors,including agriculture,industry and construction,transportation,services(excluding transportation),and residential living,and then establish the optimal design in terms of power generation and heating to obtain PE requirements and CO2emissions.
4.2.Results of China's energy production and consumption transformation
4.2.1.Results in relation to FE demand
(1)Agriculture
Agriculture accounted for 2%of FE consumption in 2015,and energy consumption per CN¥10,000 of value added was 0.1 tce.China's agricultural growth will stabilize over the long term,and modernization is the major factor impacting energy consumption.Since 2015 China's agricultural modernization has largely been manifested in continuous improvement in the degree of mechanization.Total power use by agricultural machinery reached 1.12 GkW in 2015;such value is twice thefigure obtained in 2005.Increasing use of agricultural machinery leads to growth in energy consumption;however,energy consumption per unit of value added has fallen by 17%over the past 10 years.In the future,when mechanization reaches saturation point,agricultural modernization will gradually shift to biotechnology and informatization enhancement,and energy consumption per unit of value added is expected to fall much further.Accordingly,the total volume of agricultural machinery will continuously expand during the term of the 13th Five-Year Plan,and total energy consumption will continually increase until it approximates 66 Mtce by 2020.Then,continual improvements in agricultural ef ficiency should cause FE consumption to gradually decline to 51 Mtce by 2030 and 36 Mtce by 2050(Fig.6a).
From the point of view of FE consumption,scattered use of coal will be eliminated,and fossil-fuel-powered machinery will be replaced by machinery powered by either electricity or biomass fuels.The use of electric power and renewable energy will gradually increase,with the combined usage increasing from 28%of all energy sources in 2015 to 54%in 2030 and then 87%in 2050.
(2)Industry and construction sector
Main FE was consumed by the industry and construction sector.In 2015,it accounted for 88%,36%,55%,and 71%of the total FE consumption of coal,oil,natural gas,and electricity and heat,respectively.Based on the assessment of future trends in traditional energy-intensive products,including steel,cement,glass,electrolytic aluminum,synthetic ammonia,ethylene,and methanol,and the Made in CECERG,2009 plan outlining the direction of China's future industrial development,we perform a bottom-up analysis of future FE consumption in the industry and construction sector.Fig.6b displays the total results.It shows that FE consumption in the industry and construction sector is expected to peak in 2025-2030 at around 2.2-2.3 Ttce,which is slightly higher than the current level(2.2 Ttce at 2015),after which it is expected to gradually decline to 1.9 Gtce by 2050.Energy consumption per unit value added in the industry and construction sector also shows a steady and downward trend and is expected to fall to 80%less than the 2015 level by 2050.
The increase in volume of scrap steel that will be recycled in the future implies that the main technology used in the steel industry will gradually shift from the traditional lengthy steelmaking process using iron ores and coke as the starting point to their combination and the shorter electric furnace steelmaking process using scrap steel as starting point.We have assumed that the shorter process will gradually assume a higher proportion of the overall steelmaking process,reaching 60%by 2050.In addition,substitution of small industrial coal- fired boilers with small kilns will lead to a significant decline in the currently scattered use of industrial coal.Given the ongoing improvement in people's living standards,the continuous increase in demand for chemical products is expected to remain the only positive contribution to the demand for coal and oil.Overall,the proportion of energy that is generated using coal will decrease significantly in the future,from 55%in 2015 to 45%in 2030 and 29%in 2050;this value is 570 Mtce or 610 Mtce less than the amount used in 2015.Meanwhile,the proportion of FE consumption of natural gas,electricity and heat will increase from 32%in 2015 to 50%in 2050.
(3)Transportation sector
Energy consumption in the transportation sector includes energy used in the transportation industry and the majority of gasoline and diesel fuel used in residential living,wholesale and retail trading,and general public services.In addition,energy consumption includes some of the gasoline that is used in the industry and construction sector.In the future,as the popularity of cars and air travel rises,transport-related demand will continually grow.However,improvements in fuel economy and the increasing popularity of public transport indicate that energy consumption per unit of travel is expected to continually decline.In the energy system analysis model,future energy demand is predicted by separately forecasting the level of car ownership and traf fic volume in relation to roads,railways,waterways,and air travel.Shown as in Fig.6c,results showed that prior to 2030,as the population and car ownership both increase continuously,energy consumption in the transportation sector will continually grow until a peak of about 700 Mtce is reached by 2030.Then,introduction of different fuels and improvements in fuel ef ficiency will lead to a slow decline in FE demand in the transportation sector to around 640 Mtce by 2050.In areas where fossil-based fuels,such as gasoline,diesel,and kerosene,remain the most important source of energy,demand will remain as high as 410 Mtce in 2050,but the proportion of all types of fuel used will have fallen from 87%in 2015 to 65%in 2050.Meanwhile,FE use of electricity,natural gas,and biomass fuels will increase significantly to 200 Mtce by 2050,accounting for 35%of overall energy consumption.By 2050,200 million electricpowered cars will be in use in China,accounting for 40%of all cars,and annual consumption of electricity will reach 400 TW h.
(4)Service industry(excluding the transportation sector)
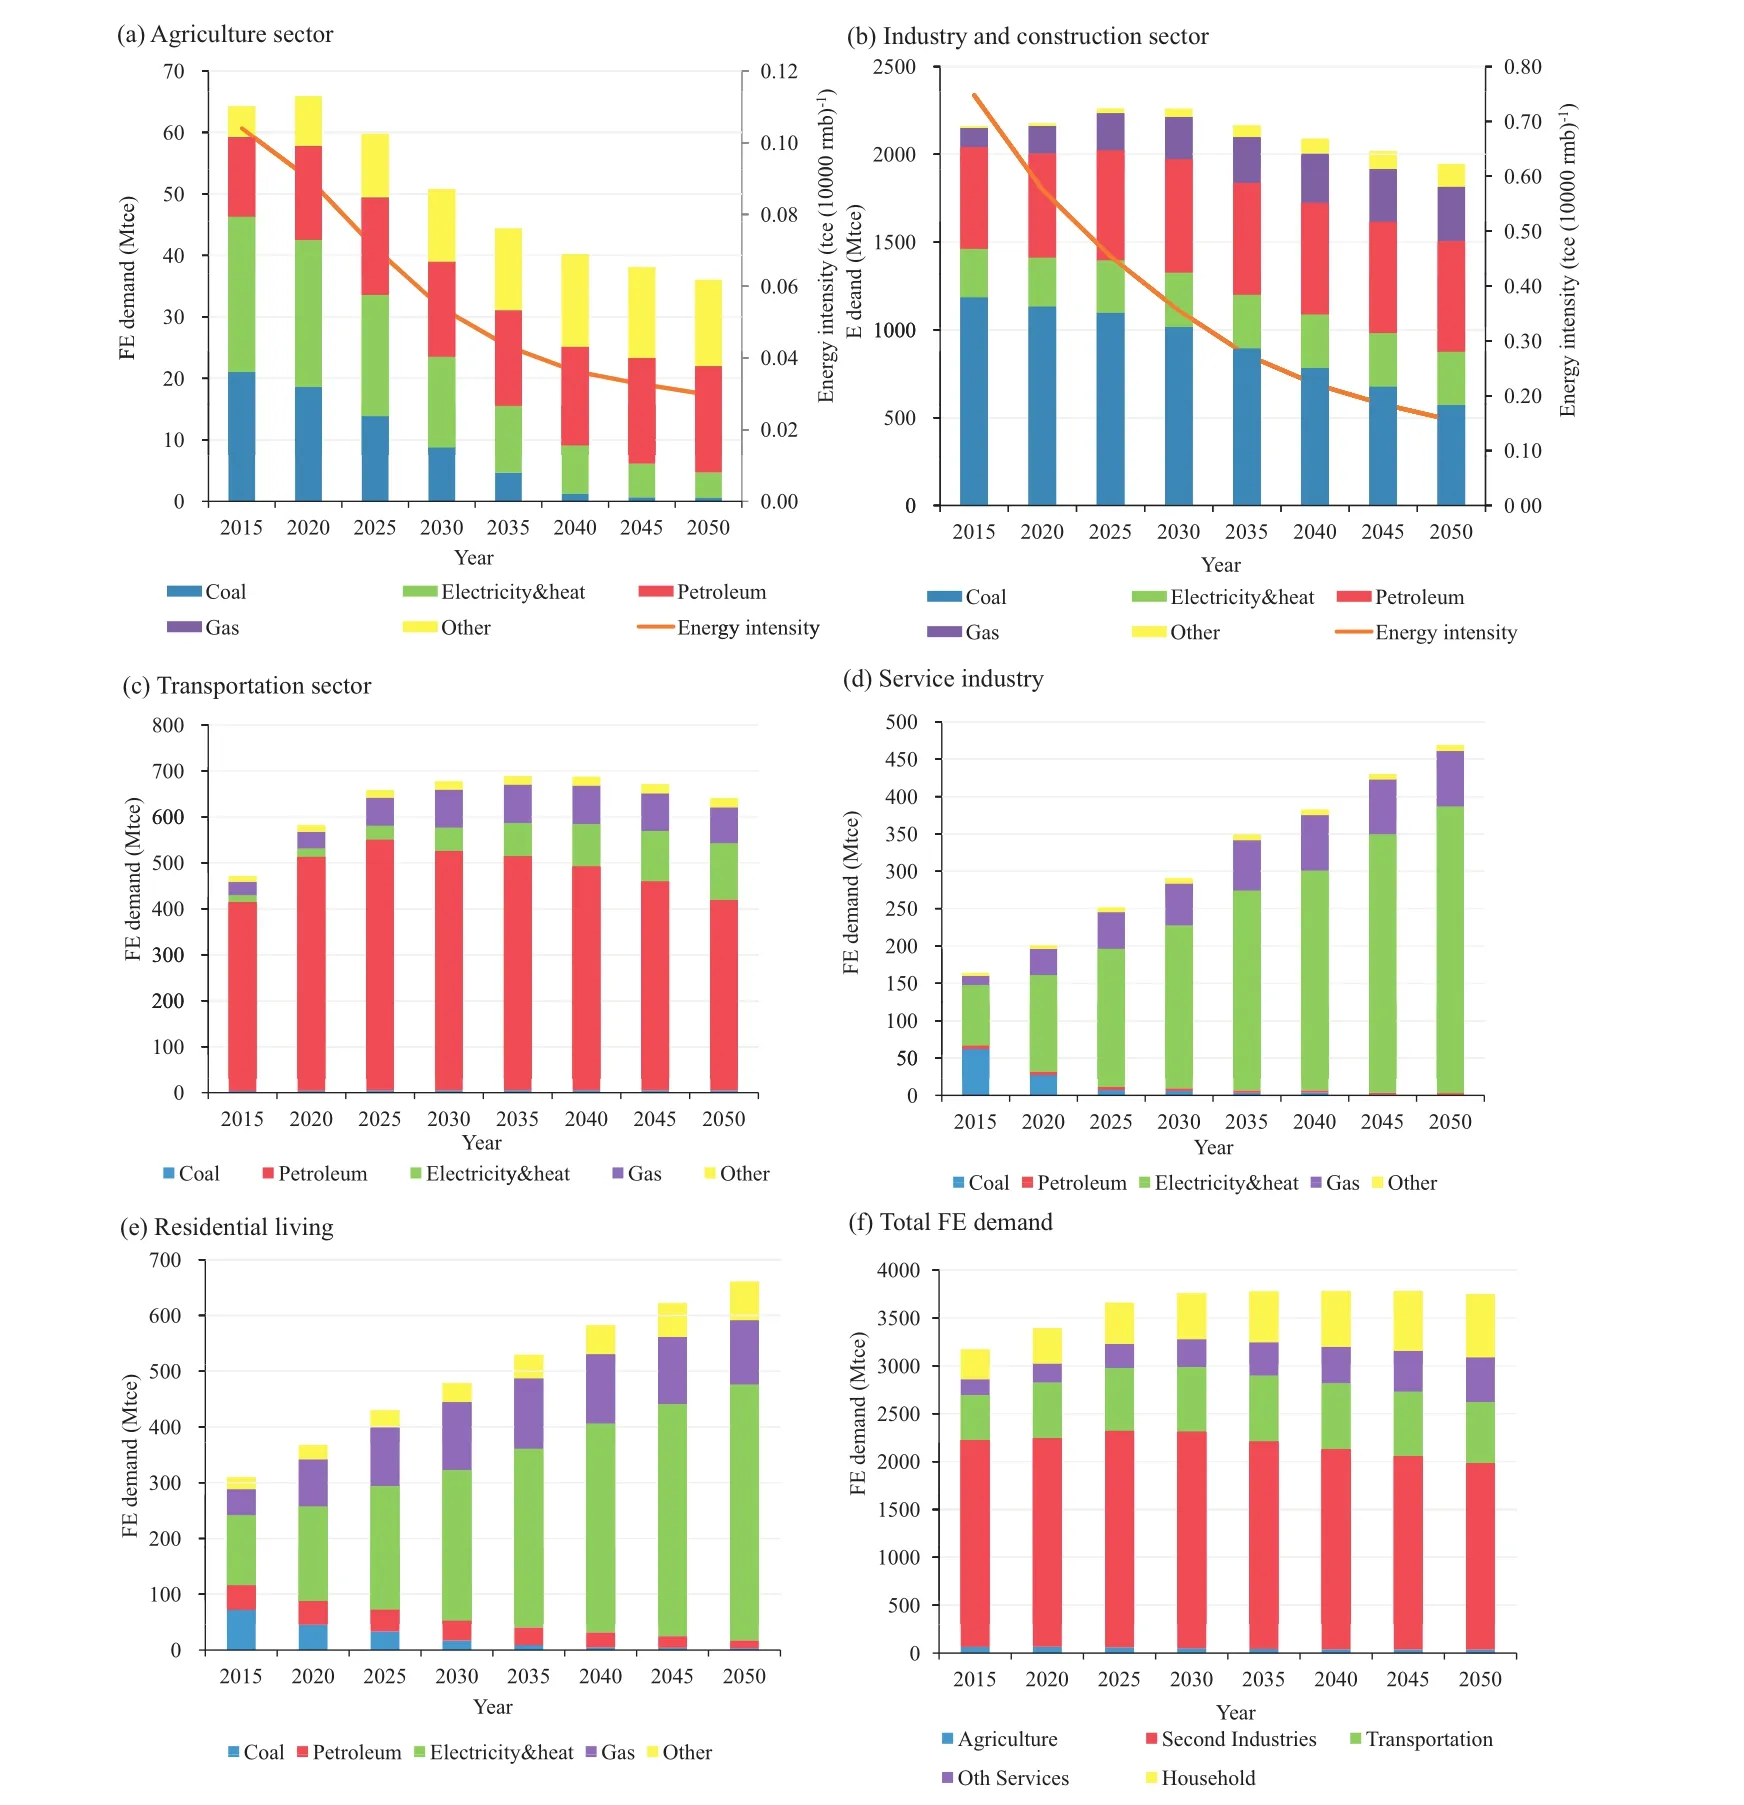
Fig.6.FE demand in different sectors.
The development of the service industry is extremely important if China is to optimize its industrial structure and to realize continuous growth.Energy consumption in the service industry will increase as the industry grows,but it will be subject to the constraint imposed by the total commercial area.Based on forecast added value for the tertiary industry sector and the forecast commercial construction area,FE consumption is expected to continually increase,reaching 470 Mtce by 2050(Fig.6d).Ongoing upgrades in the service sector and replacement of the scattered use of coal will cause the proportion of coal used for energy generation to fall rapidly to 2%by 2030.Based on the experiences of developed countries in terms of the development of the service industry,the demand for electricity in the sector will be approximately the same as that in the residential sector.Accordingly,energy demand in China's service industry is expected to rise to 2.4 TkW h by 2050,whereas the proportion of energy used in the service industry will also steadily increase to 82%of overall energy use by 2050.The development of a distributed energy supply system using natural gas as the main energy source will steadily increase demands for natural gas in large-scale buildings.Gas consumption in the service industry will steadily increase to 75 Mtce by 2050,accounting for 16%of all energy used in the sector.
(5)Residential living
Shown as in Fig.6e,continuous improvement in the quality of life of residents implies that FE consumption for residential living will continually grow and is expected to reach 660 Mtce by 2050.Continued advances in substitution of cleaner energy sources in place of the scattered use of coal will cause a rapid decline in coal consumption prior to 2030,and the proportion of total FE consumption will decline from 23%in 2015 to 4%in 2030 and 1%in 2050.Liquefied petroleum gas will also gradually be replaced by natural gas,with consumption falling from 44 Mtce in 2015 to 14 Mt in 2050,with the proportion of total FE consumption declining from 14%in 2015 to 2%in 2050.China's per capita electricity consumption for residential living will gradually increase from 540 kW h in 2015 to 1100 kW h in 2030 and 2000 kW h in 2050,whereas the proportion of overall FE demand will increase from 40%in 2015 to 69%in 2050.Consumption of natural gas will reach 120 Mtce by 2050,accounting for 17%of FE consumption in the residential sector.
(6)Total demand for FE
In summary,China's future FE demand in the agriculture,industry and construction,transportation,service,and residential living sectors features the following characteristics:1)China's FE demand will peak in 2030-2050,with peak consumption of 3.9 Gtce in 2040(Fig.6f);2)FE demand will peak in 2020 in the agriculture sector,in 2025-2030 in the industry and construction sectors,and in 2030-2040 in the transportation sector but will not peak before 2050 in the service and residential living sectors;3)Energy intensity in secondary industries decreased by 51%,which is much higher than that in third industry(39%)from 2015 to 2030;however,from 2031 to 2050,in both secondary and third industries,energy intensity will decrease by 55%(Fig.7);and 4)Shown as Fig.8,from an FE structure point of view,the proportions of coal and petroleum products will gradually decline from 42%and 24%in 2015 to 15%and 20%,respectively,by 2050.In terms of volume,FE demand for coal and petroleum product will reach 580 Mtce and 740 Mtce,respectively,in 2050,a decline of 760 Mtce and 20 Mtce from 2015 levels(Fig.8).Consumption of electricity and heat will increase significantly from 810 Mtce in 2015 to 1.16 Gtce in 2050,whereas the proportion of total consumption will also increase from 26%to 43%.In addition,although the absolute amount of NFF-based energy used by terminal sectors is not large,a significant growth ensues,with the consumption expected to increase from 55 Mt in 2015 to 240 Mt in 2050,indicating an increase from 2%of overall consumption to 6%.
4.2.2.Analysis of energy structure for intermediate transformation
To complete the strategic outlook requirements,the power sector must vigorously optimize power structure,especially wind power and photovoltaic need for vigorous development.The development of nuclear power,which plays an important role in the future power supply structure,must also be accelerated under the highest safety standards.As shown in Fig.9,the proportion of overall power supplied using nuclear power,hydropower,wind power,and solar power will reach 22%,16%,15%,and 10%.Meanwhile,in 2050,power generation using coal and natural gas will account for 24%and 9%,respectively,of total power generation,indicating that in the future,these sources will be used to add flexibility to the overall power supply to meet demands of peak load regulation and ancillary services.The installed capacities for coal and natural gas will total 800 and 270 GW,respectively,in 2050.
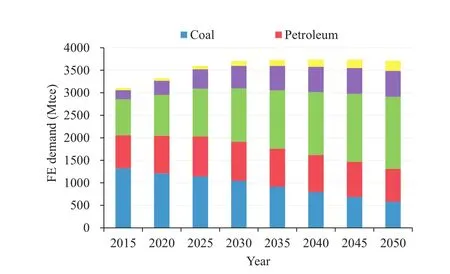
Fig.8.Total FE demand by energy source.
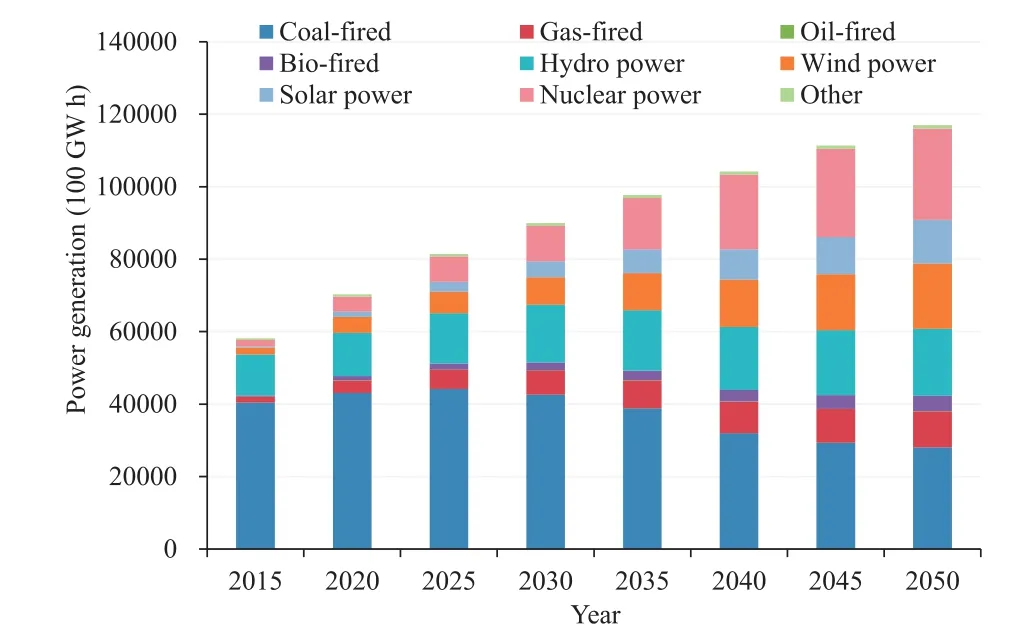
Fig.9.Total power generation by source structure.
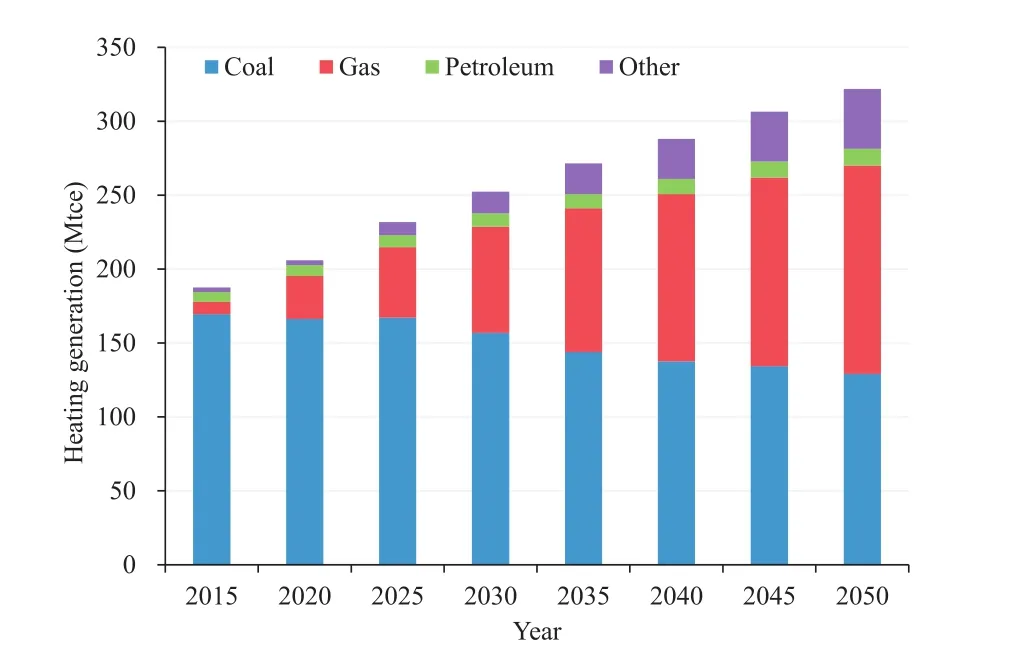
Fig.10.Total heating generation and source structure.
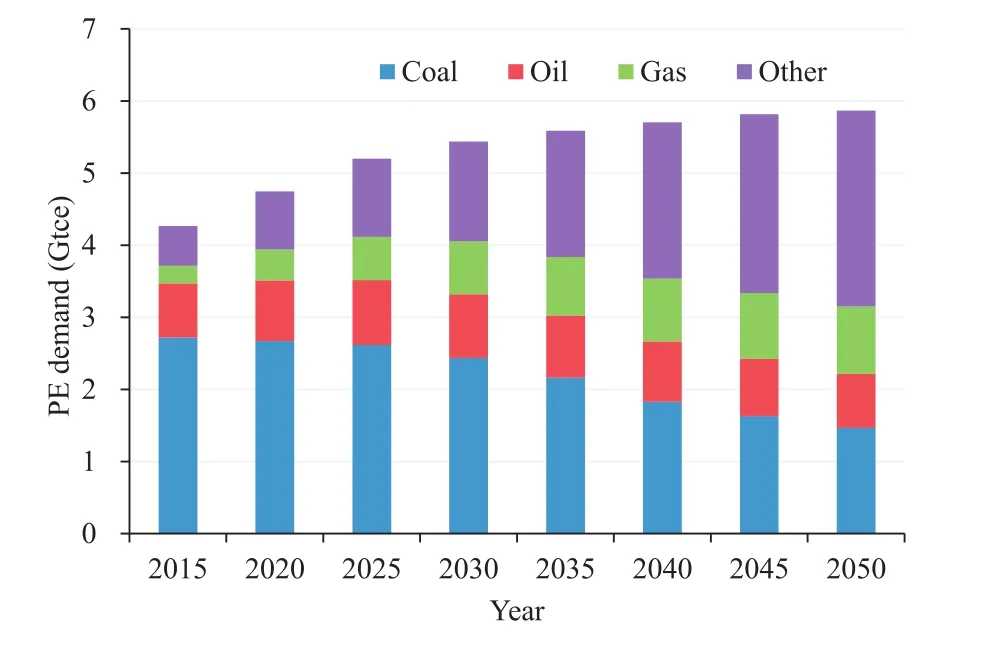
Fig.11.Total primary energy demand perspective.
Different from massively using non-fossil energy to replace coal in power structure,the built cogeneration unit remains an important way to meet heating demand,and coal consumption can only be slightly reduced in the future.As shown in Fig.10,demand for coal will remain at 140 Mt in 2050.Meanwhile,heating will mainly be provided by natural gas and geothermal energy.The demand for natural gas and renewable energy is expected to reach 140 and 40 Mtce,respectively,by 2050.
4.2.3.Analysis of PE demand
By integrating forecast results for FE demand and intermediate transformation energy demand,we can forecast PE demand.TPE will reach 4.8 Gtce by 2020,5.5 Gtce by 2030,and 5.8 Gtce by 2050(Fig.11).In 2016-2020,natural gas will experience the largest increase,followed by NFF,whereas coal consumption will remain stable.From 2021 to 2030,the increase in TPE will mainly come from NFF,which will contribute about 460 Mtce.Natural gas will steadily increase,whereas coal consumption will fall by 210 Mtce.After 2030,consumption of NFFs will replace consumption of various types of fossil fuels,such as coal,oil,and even natural gas to some extent,with the total amount of NFFs set to increase by 1.1 Gtce from 2031 to 2050(Fig.12).
In terms of the share of TPE,the shares of coal and oil will fall significantly,accounting for only 25%and 13%,respectively,of TPE by 2050.Meanwhile,the share of natural gas will rise to 15%,which is 9%higher than the share in 2015.NFF-based energy will be close to 50%of TPE,which meets requirements of the Energy Strategy.Emissions of CO2will peak at 9.6 Gt in 2025-2030 before falling to 6.7 Gt by 2050,showing a reduction of 31%.
5.Conclusions and suggestion
In this study,we used a simple soft-linked quantitative model to describe the energy development path and to estimate the related CO2emissions based on an analysis of the economic and social development path,which is necessary if China aims to realize the China Dream targets by 2050.The scenario that was developed was based on China's Energy Production and Consumption Revolution Strategy(2016-2030).We estimate FE and PE demand in China through to 2050 and the corresponding trends in CO2emissions.
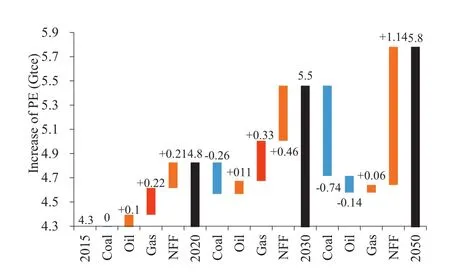
Fig.12.The decomposition of increase of PE from 2015 to 2050.
However,with reference to the Paris Agreement target of limiting global temperature increases to less than 2°C,by 2050,China's CO2emissions should be 50%lower than the 2015 levels(RGCEPCEC,2017);the value should approximate 4.6 Gt compared with the 6.7 Gt identified in our Energy Strategy scenario.Thus,CO2emissions in China must reduce by an additional 2-3 Gt.Considering that the scattered use of coal has been reduced by 80%,and the remaining coal is mainly used for production of chemicals and raw materials,an additional reduction of 2 Gt of CO2emissions is equivalent to a further reduction of 85%of coal used for power generation and heating.Hence,reaching such target poses extreme dif ficulty.Thus,the development of carbon capture and storage(CCS)technology,other carbon-negative technologies(such as bio-energy with CCS),and other CO2mitigation policies are extremely important despite the economic availability of this technology currently being unproven.
Acknowledgment
We thank National Key R&D Program of China(2016YFA0602601),National Natural Science Foundation of China(71573062),China Energy Modeling Forum(CEMF),for support of the study.
References
2050CECERG(2050 China Energy and Carbon Emissions Research Group),2009.2050 China Energy and CO2Emissions Report.China Science Publishing&Media Ltd(in Chinese).
Dargay,J.,Gately,D.,Sommer,M.,2007.Vehicle ownership and income growth,worldwide:1960-2030.Energ.J.28,143-170.
Dixon,P.B.,Rimmer,M.T.,2002.Dynamic General Equilibrium Modeling for Forecasting and Policy.North-Holland.
Huo,H.,Wang,M.,2012.Modeling future vehicle sales and stock in China.Energy Pol.43,17-29.
Jiang,K.-J.,Hu,X.-L.,Zhuang,X.,et al.,2009.China's low carbon scenarios and roadmap for 2050.Sino-Global Energy 14(6),1-7(in Chinese).
Li,J.-F.,Wang,X.,Zhang,Y.-X.,2012.Is it in China's interest to implement an export carbon tax?Energy Econ.https://doi.org/10.1016/j.eneco.2012.02.012.
Li,J.-F.,Wang,X.,Zhang,Y.-X.,2014.The economic impact of carbon pricing with regulated electricity prices in China:an application of a computable general equilibrium approach.Energy Pol.75,46-56.
Li,N.,Shi,M.-J.,Yuan,Y.-N.,2010.Impacts of carbon tax policy on regional development in China:adynamic simulation based on a multi-regional CGE model.Acta Geograph.Sin.65(12),1569-1580(in Chinese).
Li,P.,Lou,F.,2016.Supply side structural reform and China's potential economic growth rate.China Econ.11(4),4-21(in Chinese).
Liu,Y.,Cai,S.,Zhang,Q.,2014.The economic impact of China's carbon dioxide emissions to peak in 2025,2030 and 2040:based on the dynamic GTAP-e model.Manag.Rev.26(12),3-9(in Chinese).
Lou,F.,2014.Simulation study on the carbon tax impact on China's macro economy and carbon emission reduction.J.Quant.Tech.Econ.10(84-96),109.
Loulou,R.,Remne,U.,Kanudia,A.,et al.,2005.Documentation for the TIMES Model-PART I,pp.1-78.
Ma,D.,Chen,W.-Y.,2016.Study on Chinese 2030 carbon emissions peak and peak path.China Popul.Res.Environ.26(S1),1-4(in Chinese).
Messner,S.,Schrattenholzer,L.,2000.MESSAGE-MACRO:linking an energy supply model with a macroeconomic module and solving it iteratively.Energy 25,267-282.
NDRC(National Development and Reformation Commission),2017.Energy Production and Consumption Revolution Strategy(2016-2030)(in Chinese).
O'Neill,J.,Stupnytska,A.,2009.Goldman Sachs Global Economics,Commodities and Strategy Research:the Long-term Outlook for the BRICs and N-11 Post Crisis.Global Economics Paper No.192.http://www.goldmansachs.com/our-thinking/archive/brics-at-8/brics-the-long-termoutlook.pdf.
Peng,S.-J.,Yu,L.-L.,2017.Economic and carbon emission effects of different emission reduction schemes under the open system:simulation analysis based on the GTAP-E model.J.Xiamen Univ.(Arts Soc.Sci.)1,1-12(in Chinese).
RGCEPCEC(Research Group for China to Earliest Peak the Carbon Emission of China),2017.Earliest Peaking the Carbon Emission of China.China Economic Publishing House(in Chinese).
SQRIMHURD(Standard Quota Research Institute of the Ministry of Housing and Urban-Rural Development),2016.Energy Consumption Control Strategy of Civil Buildings.China Architecture&Building Press(in Chinese).
UN(United Nations),2017.World Population Prospects:the 2017 Revision.DVD Edition.
UNDP,2010.UNDP Human Development Report 2009/10.China Translation&Publishing Corporation(Chinese version).
UNFCCC,2015.The Paris Agreement.United Nations Framework Convention on Climate Change,Paris,France.
Wu,T.,Zhao,H.,Ou,X.,2014.Vehicle ownership analysis based on GDP per capita in China:1963-2050.Sustainability 6(8),4877-4899.
Zhang,A.-L.,Li,J.-F.,2007.Building of Chinese integrated energy-economyenvironment assessment model.J.Tsinghua Univ.(Sci.Tech.)47(9),1537-1540(in Chinese).
Zhang,C.-L.,Li,J.-F.,Zhang,A.-L.,et al.,2011.SICGE extensions and their linkage with IESOM.J.Tsinghua Univ.(Sci.Tech.)51(2),234-240(in Chinese).
 Advances in Climate Change Research2018年1期
- Advances in Climate Change Research的其它文章
- Bias correction and projection of surface air temperature in LMDZ multiple simulation over central and eastern China
- Climate change projections for the Middle East-North Africa domain with COSMO-CLM at different spatial resolutions
- Future temperature changes over the critical Belt and Road region based on CMIP5 models
- A cautionary note on decadal sea level pressure predictions from GCMs
- Co-controlling CO2 and NOx emission in China's cement industry:An optimal development pathway study
- Carbon emission scenarios of China's power sector:Impact of controlling measures and carbon pricing mechanism