Layer-Constrained Triangulated Irregular Network Algorithm Based on Ground Penetrating Radar Data and Its Application
Zhenwu Wang and Jianqiang Ma
(Department of Computer Science and Technology, China University of Mining and Technology (Beijing), Beijing 100083, China)
With the rapid development of visualization technology in scientific computing, three-dimensional (3D) geological modelling technology has increasingly attracted more and more attention, and has been widely used in the fields of digital geology, petroleum exploration and geotechnical engineering. The 3D geological modelling is the abstract reconstruction and reproduction for the geological bodies through 3D visualization technology[1]. The complexity of geological spatial relation increases the complicacy of data structure, topological relation and corresponding algorithms, which makes geological modelling very difficult[2], and the 3D modelling and visualization of geological data is the hotspot in the domain of geosciences. Surface element model[3]is widely applied to represent the digital geological surface, including regular rectangular grid and triangular irregular network (TIN).Compared with regular rectangular grid, the TIN method can change the size and number of triangular patches according to the complexity of the geological surface, which eliminates the data redundancy in visualization step, and maintain a high fitting accuracy[4]. The current research work[4-16]of TIN construction assumes that the discrete data point set is static and does not discuss how to handle dynamic data points in different levels. From the application view, the research of TIN application in geology field focused on terrain and stratum information, and almost all of them do not involve the 3D modelling of geological disease information according to our knowledge. Geological disease is a disaster phenomenen in geological environment, such as underground cavity, stagnant water and loose soil, and it has a great destructive effect on railway subgrade[17], highway tunnel lining[18]and cultural relics[19-20].
According to the hierarchical division of the discrete data points, the paper proposes a layer-constrained TIN (named LC-TIN) algorithm, which can construct a closed or non-closed 2D/3D surface model, and the construction procedure is dynamic from layer to layer, which can realize high precision and arbitrary shape. In addition, a detection platform of geological disease has been developed which adopted the LC-TIN algorithm, and the practice proved its validity.
The rest of this paper is organized as follows. Section 1 presents the related work about TIN algorithm and geological disease detection based on GPR data, some preliminary definitions are given in Section 2 and Section 3 discusses the details of the LC-TIN method. In Section 4, the experimental results are analyzed, and the application of LC-TIN in the detection platform of geological disease is discussed in Section 5, Section 6 concludes this work.
1 Related Work
The principle of TIN algorithm is to construct scattered and non-duplication points to form a continuous and non-overlapping irregular triangle network according to certain rules (such as Delaunay criterion) in order to simulate the 2D/3D object surface, and many scholars studied the TIN algorithm. Aiming at dealing with the inefficiency of network construction, Miao[8]rapidly constructed TIN in linear time by making virtual grid, and then adopted a local optimization method to handle the redundancy problem; Zheng[13]proposed a constrained lines embedding method in the TIN model, which first checked the influence domain of every constrained line and then extracted the influence domain boundary; Xuan[14]gave a new method(the sum of the quadratic distance from three vertices to the gravity center) to determine the skinny triangle for LiDAR data, in which the edge points cannot be detected only by the triangle shape variable; Longtin[15]gave a representation method for density elevation data, which transforms digital evaluation data to a TIN expression in order to reduce the quantity of terrain data; Chen[16]proposed a high precision model of digital elevation, which is based on 3D TIN method.
The TIN method has been widely used to model terrain and stratum information[4-7,9].Xiong[3]used TIN to realize 3D modelling for the fault information, and adopted VTK (Visualization Toolkit) to implement the prototype system; Tan[5]proposed an automatic triangulation algorithm based on the triangular topological relation, and applied this algorithm to develop a 3D TIN platform; Wang[6]used the improved TIN algorithm to merge the adjacent convex shell blocks, which can optimize the sub-TIN data to form a complete topographic data for underwater navigation. Huang[7]emphatically discussed the robustness of Delaunay mesh generation based on the Bowyer-Watson incremental point insertion technology,and also addressed the stripping algorithm of TINs; Mao[9]proposed a new method of morphological analysis for geological interfaces based on TIN model, which used 3D TIN model to simulate geological interfaces and calculate the general geometry parameters. From the view of geological disease, most of research work[17-20]focused on the detailed diagnosis and preventive measures, and didn’t concern how to model them in 3D platform.
From the above discussion it is obvious that the above algorithms do not constrain discrete data points in TIN model, and do not illustrate how to use TIN algorithm to model geological disease data. This paper gives a layer-constrained TIN method, which can construct TIN layer by layer dynamically, and the proposed algorithm has been applied to detect geological disease information, the details of LC-TIN are described in Section 2.
2 Preliminaries
In order to describe the LC-TIN algorithm, some basic conceptions have been given as follows.
Def1Geological data pointδ=<ζ,γ>
The geological data pointδis a tuple,ζrepresents a 3D coordinate value, andζ=
Def2Geological data sliceζ
(1)

Def3Pickup line l

Def4Pickup line setψ

Def5Adjacent pickup line pairη

Def6Base line ϑ

Def7Base edgeσ

Def8Pickup triangleT

Def9Pickup triangle setΦ

Def10Pickup 3D bodyΩ
The 3D body constructed byΦb={Φbc|c=1,2,…,Nb} is defined asΩb, andΩ={Ωb|b=1,2,…,t}.
Def11Cosine value and circumcircle radius


(2)
The lengths of the other two edges (A and B) are defined as follows
(3)
(4)

(5)

(6)
The above conceptions can be summarized in Tab.1.

Tab.1 Basic conceptions in LC-TIN algorithm
3 Principles of LC-TIN Algorithm
In order to triangulate the finite point sets in three-dimensional space, the Delaunay criterion should satisfy the following rules.


According to closeness, 3D bodies can be classified into closed and non-closed types, and corresponding toηthere are 4 cases, which are described in Fig. 1.

Fig.1 Closeness of ηbc
The LC-TIN algorithm is the greedy algorithm based on Delaunay rules, which is also a local optimum algorithm. The algorithm input isψ, the output isΩ, step (2) represents traversing all theζ, steps (3) and (4) indicate to traverse all the geological disease bodies and their l, and steps (5)(6) can generate the currentηand select ϑ, step (7) traverses all the points on the ϑ, steps (8)-(10) selectσand constructTthrough choosing the third point following some rules (such as the sum of circumcircle areas is minimum or the maximum angle), at lastΦis generated and formedΩ. The LC-TIN algorithm, which constructstgeological bodies, is described as follows.
Algorithm: LC-TIN
Input:Ψ
Output:Ω
(1) ifΨ≠NULL{
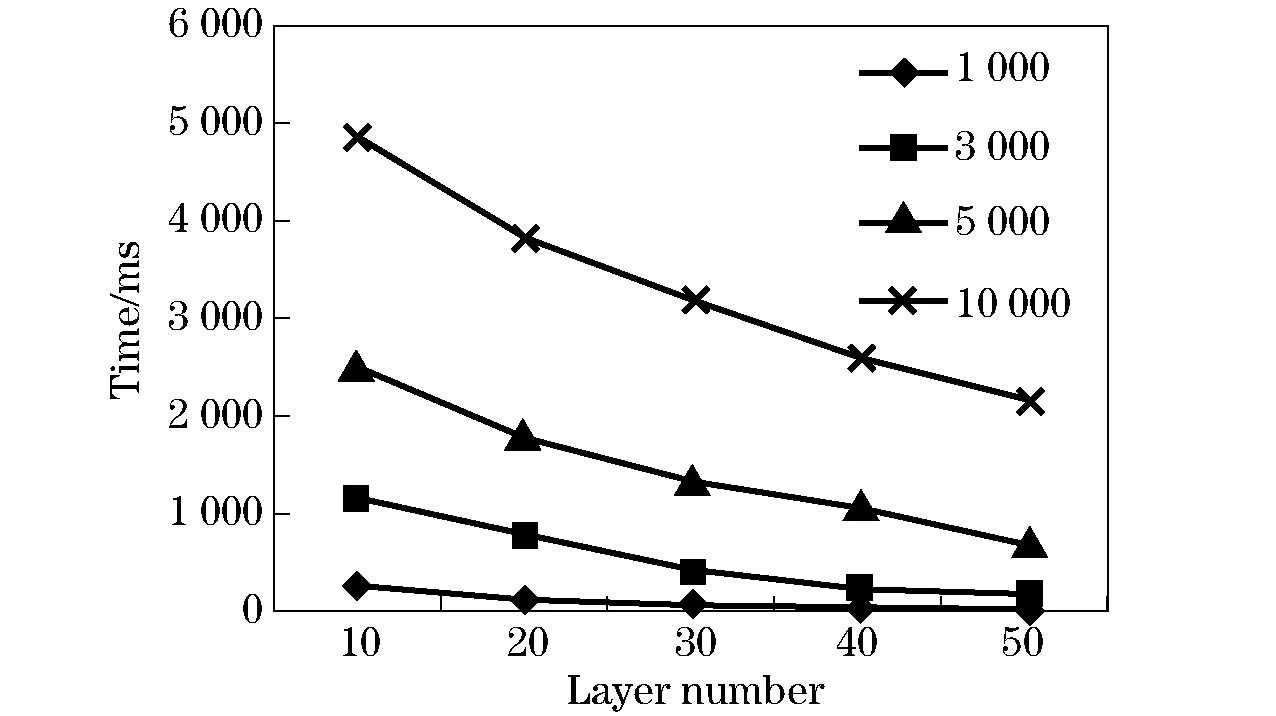
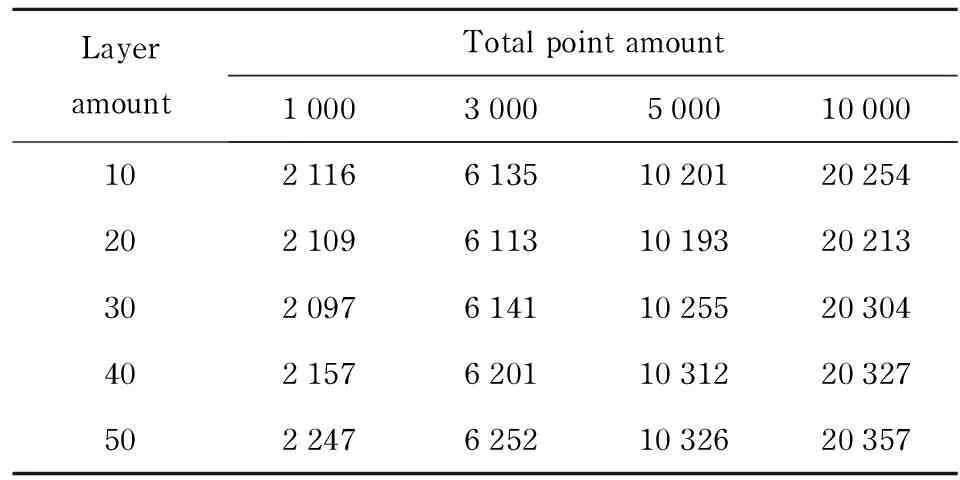
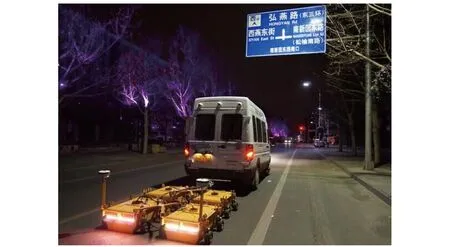
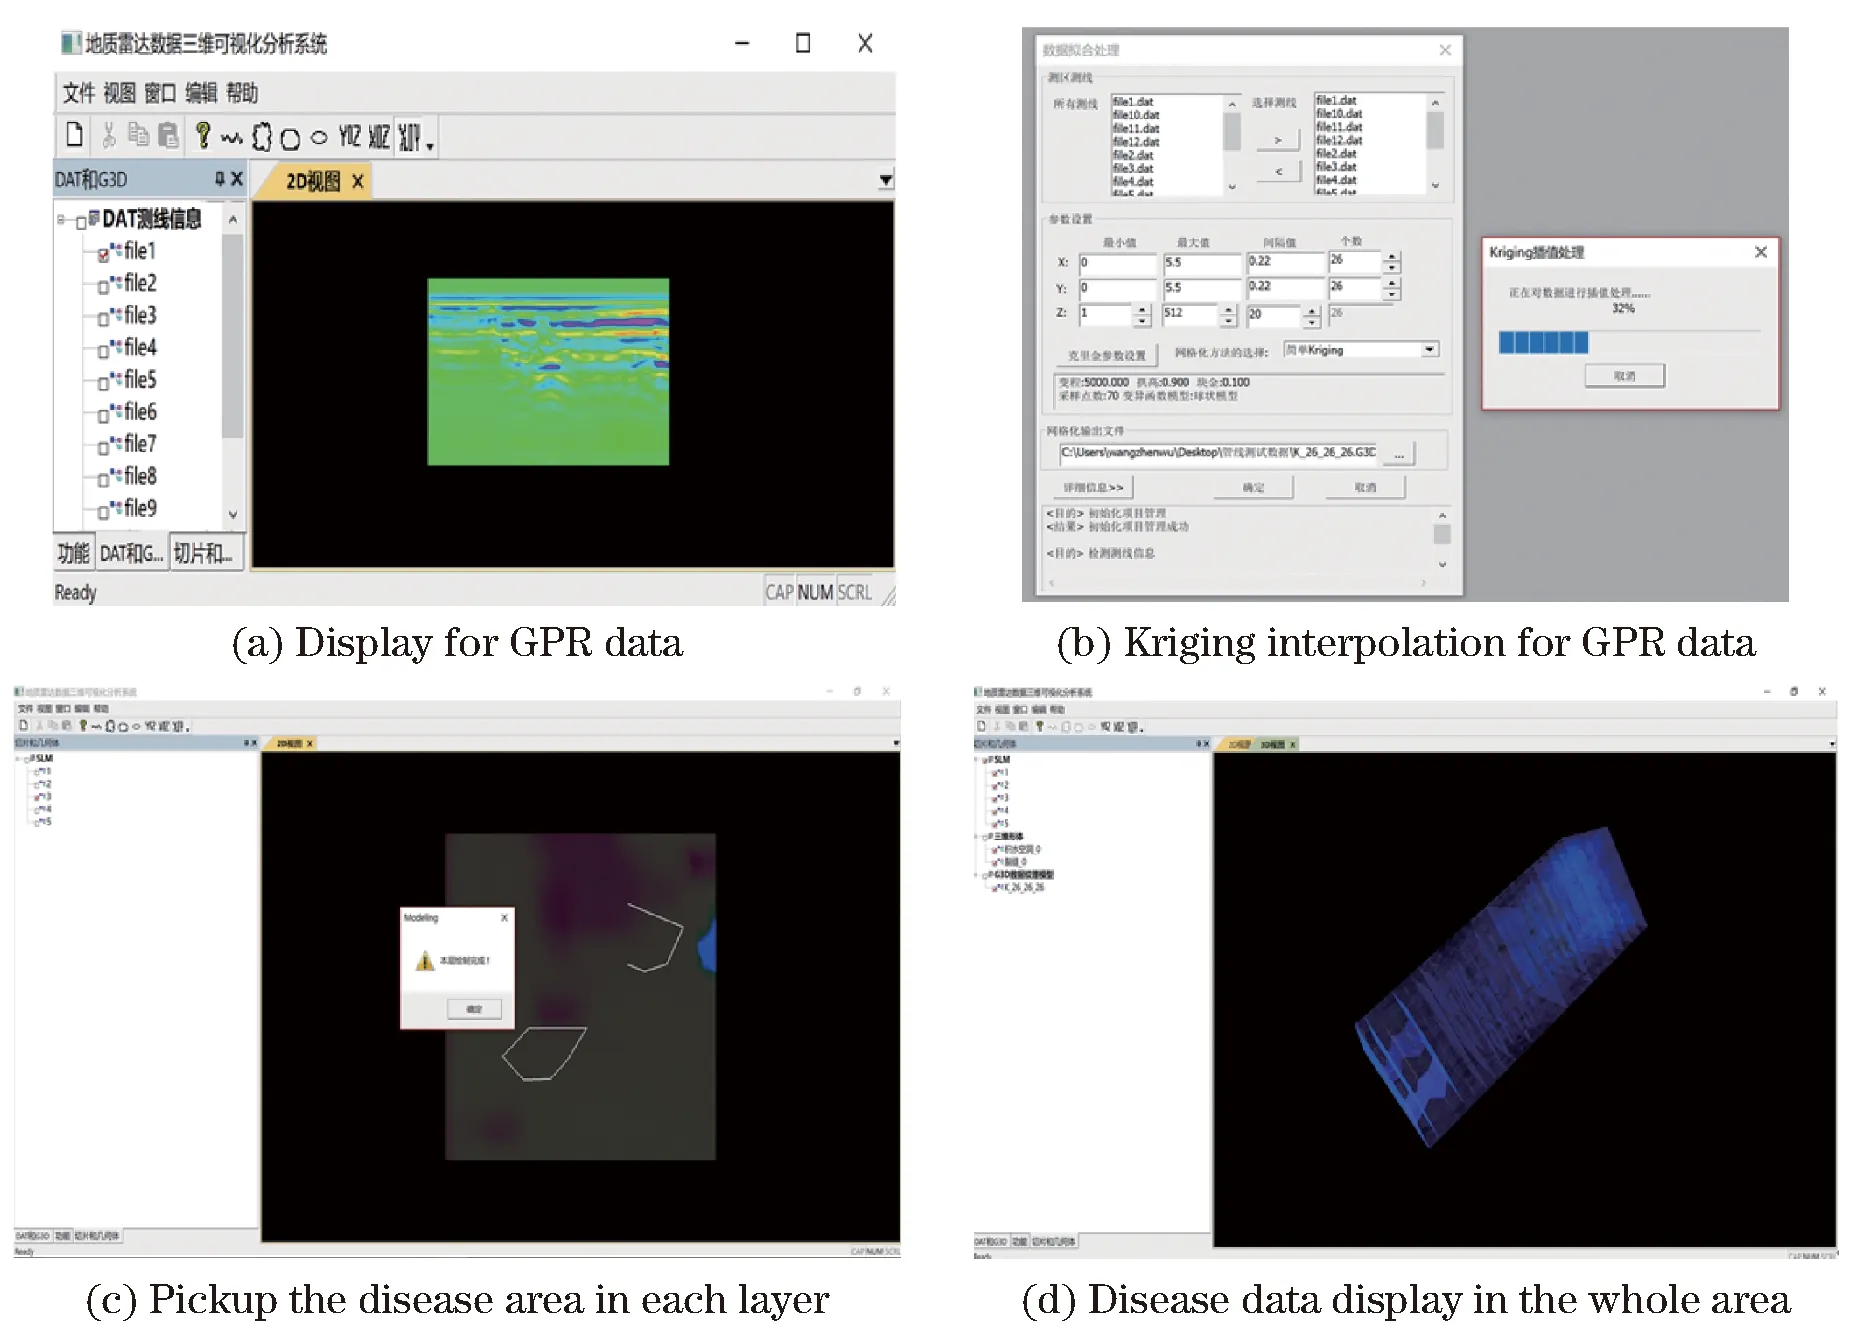
(2) for(b=1;b (3) for(c=1;Nb-1;c+){ (4) for (p=1;p (6) select ϑbcfromηbc (7) for (i=1;Nηbc;i++) { (11) Handle other special points to formT (12) } ∥end for (7) (13) }∥ end for(4) (14) }∥end for (3) (15) addΦbctoΦb (16) }∥end for (2) (17) generate the wholeΦand form the wholeΩ (18) } ∥ end if Fig.2 Application of LC-TIN Described in Fig. 2, the LC-TIN algorithm can construct a triangle network under the constraint of triangle non-overlap and satisfy the Delaunay criterion. Fig.2b and Fig.2c show the details of 3D body 1 and 2 in Fig. 2a respectively, and they compare with the corresponding 3D bodies (described by Fig. 2d and Fig.2e) which adopt the method of connecting triangles sequentially and layer by layer.Obviously,the LC-TIN algorithm can draw the 3D body more smoothly and naturally than the compared method. Different experiments have been conducted according to differentζamounts, differentσnumbers, no matter whether data points are allocated equally on differentζor not, in order to test the runtime of the LC-TIN algorithm. The hardware and software running environments are specified as follows: CPU is Intel(R) Core(TM) i5-4210H 2.90 GHz, memory is RAM 4.00 GB, the operating system is Windows 8 64 bit, the development platform is VS.NET 2013, programming language is C++, and the rendering method is OpenGL. For the construction of one geological body, the amount of total data points is supposed to beN, the number of total layers isM, the amount of data points allocating to every layer ismi,i∈[1,m]. Shown in Fig. 3, this paper gave the running time of LC-TIN algorithm when data points are allocated equally on every layer, andN=1 000, 3 000, 5 000,10 000 andM=10, 20,30,40,50 respectively (m=mi=N/M). From Fig. 3 it can be noted that the data point number is reduced and running time is decreased with the increasing layer amount under the constraint of the same data point amount. DifferentNdescribes the same trend and biggerM, more running time. The running time deceases with the layer increasing on the premise that the total data point amount does not change, the reason is that the time complexity of the LC-TIN isO(Mm2) andM Fig.3 Runtime of LC-TIN (points average distribution) LayeramountTotalpointamount100030005000100001021166135102012025420210961131019320213302097614110255203044021576201103122032750224762521032620357 Shown as Tab.2, with the increasing of total points, the generated triangles rise continuously under the same layer amount, with the increasing of total layers, the generated triangles have little changes and the running time decreased under the same total point amount, described as Fig. 3, the decreased point number on each layer leads to the reduced running time, and this characteristic is useful to construct a complex 3D body. The amount of triangles is described in Tab. 3 under the inequality allocation situation. Similar to Tab. 2, with the increasing of total points amount, the generated triangles rise gradually at the same layer number, and for the same total point amount, with the increasing of total layer number, the generated triangles little changed, but if the total layer amount increases, the running time reduces at the same data points, described as Fig. 4. Fig.4 Runtime of LC-TIN (points non-average distribution) TotallayerTotaldatapoints100030005000100001021146145102212023120211661251017920230302127616810273203194021376232103012023950219062401031720336 For geological engineering application, it has important significance that how to quickly identify the geological diseases (such as underground water or empty) and underground landfill (such as underground pipeline), which can prevent and diagnize the public disasters. The paper verified the validity of LC-TIN algorithm based on GPR data, and the GPR instrument is MTGR-4F vehicle borne geological radar which is independently developed by our research team. Its detailed parameters are shown as follows: the detection depth is 5 m, the time window is 100 ns, the sampling number is 512, and the antenna frequency is 200 MHz. The experimental data is obtained from Middle East Third Ring Road, Chaoyang District, Beijing City. The survey targets include: ① the layered structure of the underground; ② whether there are underground pipelines or not; and ③ whether there are empty cavities or not. The value ranges of experimental data is in [-23 679, 15 421], the number of measured lines is 3, the number of sampling paths is 18 632, 18 088 and 18 838 respectively, the experimental data collection work is shown in Fig.5. Fig.5 Acquirement of experiment data C++ programming language and OpenGL have been adopted to develop the 3D visualization platform based on GPR data, which used LC-TIN algorithm to construct 3D model for geological diseases. Shown in Fig. 6a, the GPR data should be organized firstly, which are the original survey line data generated by our MTGR-4F GPR instrument, then the Kriging algorithm has been adopted to interpolate the GPR data, which can generate the spatial data covered all the detection area and is described by Fig. 6b,the paper utilized the disease information on the 1-5 slices in Fig. 6c, which based on geological expert experience through human-computer interaction model, and the LC-TIN algorithm has been used to construct the 3D model of geological diseases in Fig. 6d, this method can not only compute the total or partial volume of disease body accuracy and flexibly, but also can project the 3D disease object onto any 3D plane, which can provide a reliable basis for the prevention and diagnosis of the geological disaster problems. As described in Fig.6d, the geological diseases can be displayed in the detection area totally or partially, which is generated by visualizing different parts between two slices. Fig.6 3D visualization platform based on LC-TIN The TIN algorithm is widely used in digital geology, petroleum exploration, geotechnical engineering and other fields, which solves a series of problems, such as the formation of terrain modelling, the drainage network extraction, the routes design, and so on. At present, the automatic extraction of geological disease information is very difficult, while it is necessary for geological experts to recognize and extract the information in the process of human-computer interaction. In this process, discrete data points are dynamically changing at different levels. To solve this problem, the paper proposed a layered-constrained TIN algorithm for 3D modelling , and the algorithm is adopted to construct a geological disease model, which can calculate geological diseases (such as underground cavity or water) information conveniently, and provide a reliable basis for accurate treatment of geological disasters. In the future, how to deeply analyze the inner information of 3D geological bodies is an important research topic, which needs to design proper volume element models. In addition GPU-based rendering technology is another research hotpot which can enhance the graphics processing efficiency. [1] Wu C L, He Z W, Weng Z P, et al. Property, classification and key technologies of three-dimensional geological data visualization[J]. Geological Bulletin of China, 2011,30(5):642-649. (in Chinese) [2] Wu Q, Xu H. Research of three-dimensional geological modeling and visualization method [J]. Science in China Ser.D Earth Sciences, 2004,34(1):54-60. (in Chinese) [3] Li Fangxing, Wu Pingdong, Sun Huafei, et al. 3D object recognition based on linear Lie algebra model[J]. Journal of Beijing Institute of Technology, 2009, 18(1): 46-50. [4] Xiong Z Q, He H J, Xia Y H. Study on technology of 3D stratum modeling and visualization based on TIN[J]. Rock and Soil Mechanics, 2007,28(9):1954-1958. (in Chinese) [5] Tan R C, Du Q Y, Yang P F, et al. Optimized triangulation arithmetic in modeling terrain[J]. Geomatics and Information Science of Wuhan University, 2006,31(5):436-439. (in Chinese) [6] Wang L H, Gao X Z, Liang B B, et al. Optimized method of building underwater terrain navigation database based on triangular irregular network[J]. Journal of Chinese Inertial Technology, 2015,23(3):345-349. (in Chinese) [7] Huang Z G, Chen J J, Zheng Y. Triangulated irregular network based chunk griddling algorithm for terrain render-ing[J]. Journal of Zhejiang University(Engineering Science), 2009, 43(10):1939-1944. (in Chinese) [8] Miao Q G, Shi J J, Liu T G, et al. New efficient DSM gener-ating algorithm based on TIN[J]. Systems Engineering and Electronics, 2014,36(9):1868-1973. (in Chinese) [9] Mao X C, Zhao Y, Tang Y H, et al. Three-dimensional morphological analysis method for geological interfaces based on TIN and its application[J]. Journal of Central South University(Science and Technology),2013, 44(4):1493-1499. (in Chinese) [10] Liu X J, Wang Y J, Ren Z, et al. Algorithm for extracting drainage network based on triangulated irregular network[J]. Journal of Hydraulic Engineering, 2008, 39(1):27-34. (in Chinese) [11] Chen H F, Ye S P, Huang Z C, et al. Ocean scientific sur-vey route designing method syncretizing triangulated ir-regular networks and genetic algorithm[J]. Journal of Zhejiang University(Engineering Science), 2009,43(11) :1951-1957. (in Chinese) [12] Ma C H, Dai Q, Wang J M, et al. Based on clump organi-zation rules to construct Triangular Irregular Networks[J]. Computer Engineering and Applications, 2012,48(3):169-172. (in Chinese) [13] Zheng J T, Zhang T , He H H, et al. Embedding of a con-strained line into a triangulated irregular network[J]. Journal of Tsinghua University(Science & Technology), 2014,54(12):1155-1159. (in Chinese) [14] Xuan H J, Miao Q G, Liu R Y, et al. A novel algorithm based on triangulated irregular network for edge detection from LiDAR data[J]. Acta Optica Sinica, 2014, 34(12):1-7. (in Chinese) [15] Longtin, Michael J. Efficient representation of dense ele-vation grids via triangulated irregular networks[C]∥Fall Simulation Interoperability Workshop, Orlando, United States,2014:162-170. [16] Chen B S, Fu Z, Ouyang H Y. High accuracy regular grid digital elevation model modeling based on 3D triangulated irregular network using total station measured points[J]. Sensor Letters,2014,12(3-5):499-508. [17] Yang X A, Gao Y L. GPR inspection for Shanghai-Nanjing railway trackbed[J]. Chinese Journal of Rock Mechanics and Engineering, 2004,23(1):116-119. (in Chinese) [18] Qian R Q, Yang X Y, Wang X H. Control of geological disaster in Huayingshan highway tunnel[J]. Coal Geology & Exploration, 2003,31(2):48-50. (in Chinese) [19] He Y. A study of geological disease analyses and renova-tion methods in Lingquan Temple Grotto of Henan, China[J]. Rock and Soil Mechanics, 2000,21(1):56-59. (in Chinese) [20] Li Y R, Chen Z X, Zhou L Z. Research on prevention countermeasure and main geoenvironmental cause of large-scale ancient sites in South China[J]. Chinese Journal of Rock Mechanics and Engineering, 2009,28(Supp.2):3795-3800. (in Chinese)

4 Experimental Results Analysis
4.1 Comparison of 3D modelling effects

4.2 Comparison of time complexity


5 Application in Geological Disease Recognition
6 Conclusion
 Journal of Beijing Institute of Technology2018年1期
