
Quantitative analysis with plastic strain indicators to estimate damage induced by fault-slip
2018-03-01 03:16AtsushiSainokiHaniMitri
Atsushi Sainoki,Hani S.Mitri
aInternational Research Organization for Advanced Science and Technology,Kumamoto University,Kumamoto,860-8555,Japan
bDepartment of Mining and Materials Engineering,McGill University,Montreal,H3A 0E8,Canada
1.Introduction
Stress redistribution caused by mining activities,such as stope extraction,drift development,and production blasting,leads to the reactivation of a pre-existing fault(Alber and Fritschen,2011;Hofmann and Scheepers,2011;Sainoki and Mitri,2014a,2016).As a result,fault-slip can occur,producing intense seismic waves(Ortlepp,2000).When the seismic waves hit underground openings,rockbursts,i.e.violent rock ejection and massive collapse,could take place(Ortlepp and Stacey,1994).In order to ensure safe working environments and stable production,it is paramount to gain a better understanding of the mechanism of mining-induced fault-slip and to elucidate the relation between the seismic waves and the damage to mine openings.
It is common that numerical modeling of mining-induced faultslip is conducted with the conventional Mohr-Coulomb failure criterion in static conditions(Alber and Fritschen,2011;Hofmann and Scheepers,2011;Sjöberg et al.,2012).Unfortunately,the method does not replicate the actual mechanism of mininginduced fault-slip.In reality,the surface of faults in underground mines is undulating and has asperities that interlock with each other(Wallace and Morris,1986;Sagy et al.,2007).Instantaneous stress drop caused by the shearing of such asperities(Ryder,1988),which is related to the occurrence of mining-induced fault-slip,cannot be accurately modeled with the conventional method.Furthermore,the numerical analysis in static conditions is incapable of producing seismic waves arising from fault-slip.Therefore,it is impossible to evaluate the damage to nearby mine openings inflicted by the seismic waves.
Recently,Sainoki and Mitri(2014b)developed a methodology to simulate mining-induced fault-slip with Barton’s shear strength model(Barton,1973)in dynamic conditions,considering the stress drop induced by asperity shear.The methodology is capable of modeling mining-induced fault-slip in a more robust way than the use of the Mohr-Coulomb failure criterion.Furthermore,as the analysis is performed in dynamic conditions,the propagation of seismic waves can be simulated(Sainoki and Mitri,2014b).Although a number of studies have been undertaken concerning the effect of seismic waves on the stability of an underground opening,studies especially focused on the effect of seismic waves arising from mining-induced fault-slip have been rarely reported.Recently,Wang and Cai(2015)examined the effect of seismic waves on an excavation while considering a point source of a fault-slip event,but the magnitude of fault-slip is an input parameter,that is,it may fail to estimate the damage induced by fault-slip that could take place under ambient stress state.
Another important aspect to be considered is a failure criterion for an opening where stress state is biaxial.It has been demonstrated that consideration of the intermediate stress is required(Yun et al.,2010)in order to predict the failure of rock under biaxial stress conditions,where spalling resulting from extension fractures is expected(Palmström,1995;Diederichs, 2007).Numerical analysis is capable of incorporating such failure criterion to analyze specific stress fields generated as a result of mine development and ore extraction in underground mines.
In light of literature review,the present study focuses on estimating the damage around an underground opening induced by seismic waves arising from mining-induced fault-slip whilst considering the failure of rock mass under biaxial stress conditions.The fault-slip is modeled in static and dynamic conditions whilst considering the asperity shear as its source mechanism.The damage induced by seismic waves to a stope in a deep hard rock mine is evaluated whilst considering the failure under biaxial stress conditions.
2.Methodology
2.1.Constitutive model for fault
As discussed in Introduction,the effect of fault surface asperities needs to be taken into consideration.A number of advanced shear strength models have been proposed by many researchers to estimate the shear behavior of a rock joint with asperities(Ladanyi and Archambault,1970;Saeb and Amadei,1992;Kulatilake et al.,1995;Homand et al.,2001;Indraratna et al.,2005,2008;Lee et al.,2006).Amongst such shear strength models,the present study employs Barton’s shear strength model(Barton,1973)because the model is widely accepted and can be used after estimating a few physicomechanical parameters that represent the degree of surface asperities and the strength.Barton’s model is expressed as follows:

whereτmaxand σnare the maximum shear strength and the normal stressacting on a fault,respectively;andJRC,JCSand φbare the joint roughness coefficient,the joint wall compressive strength,and the angle of friction,respectively.Comparison of Barton’s shear strength model with the classical Mohr-Coulomb model is shown in Fig.1.As can be seen in the figure,the shear strength calculated from Barton’s model is invariably greater than that of Mohr-Coulomb model.
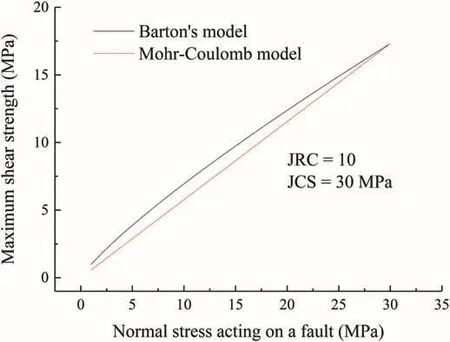
Fig.1.Barton’s shear strength model.
The Barton’s shear strength model is implemented into the joint model of FLAC3D.The implementation procedure is based on the plastic flow rule,i.e.the increment of plastic strain is determined with the derivative of potential function with respect to its stress components and a scalar variable derived from the consistency condition.The detailed procedure of the implementation is provided in Sainoki and Mitri(2014c).In order to simulate fault-slip triggered by the shearing of fault surface asperities,JRC is instantaneously decreased during a dynamic analysis,which is described in more detail later.
2.2.Failure criterion under biaxial stress state and its implementation to FLAC3D
Yun et al.(2010)performed biaxial tests for several types of rocks and established a failure criterion under biaxial stress conditions,which are the stress conditions that take place on the surface of underground openings.The failure criterion is expressed as follows:

where σ1,σ2and σcare the maximum compressive stress,intermediate stress and uniaxial compressive strength(UCS),respectively;andA,B,andCare material constants.In order to implement the equation as a yield criterion into FLAC3D,compression needs to be defined as negative and the equation is multiplied by UCS,consequently giving the following equation:

Note that compression has a negative quantity in Eq.(3).Following the same procedure shown in Sainoki and Mitri(2014a),the scalar variable that determines plastic strain increments is expressed as follows:
where[D]is an elastic matrix that relates strain with stress,{Δε}is a strain increment vector,andgis a potential function.
In the present study,an associated flow rule is assumed.The derivatives of the yield function with respect to each stress component are
Then,the increments of plastic strain follow the plastic flow rule:
where{Δεp}is a plastic strain increment vector.As the plastic strain increments do not contribute to the stress increments,the stress correction to be made at each step during the iterative analysis of FLAC3D is expressed as follows:

Fig.2 shows the failure criterion of granite under biaxial stress conditions derived from regression analysis(Yun et al.,2010).The material constants,A,BandC,in Eq.(3)are 0.998,1.873,and-1.533,respectively.The present study uses the material constants of granite,although the rock type to which the failure criterion is applied is norite.This is because the mechanical properties of norite are quite similar to those of granite(Malek et al.,2009)and because both norite and granite are hard rocks and can be the cause for rockburst.
2.3.Numerical model description
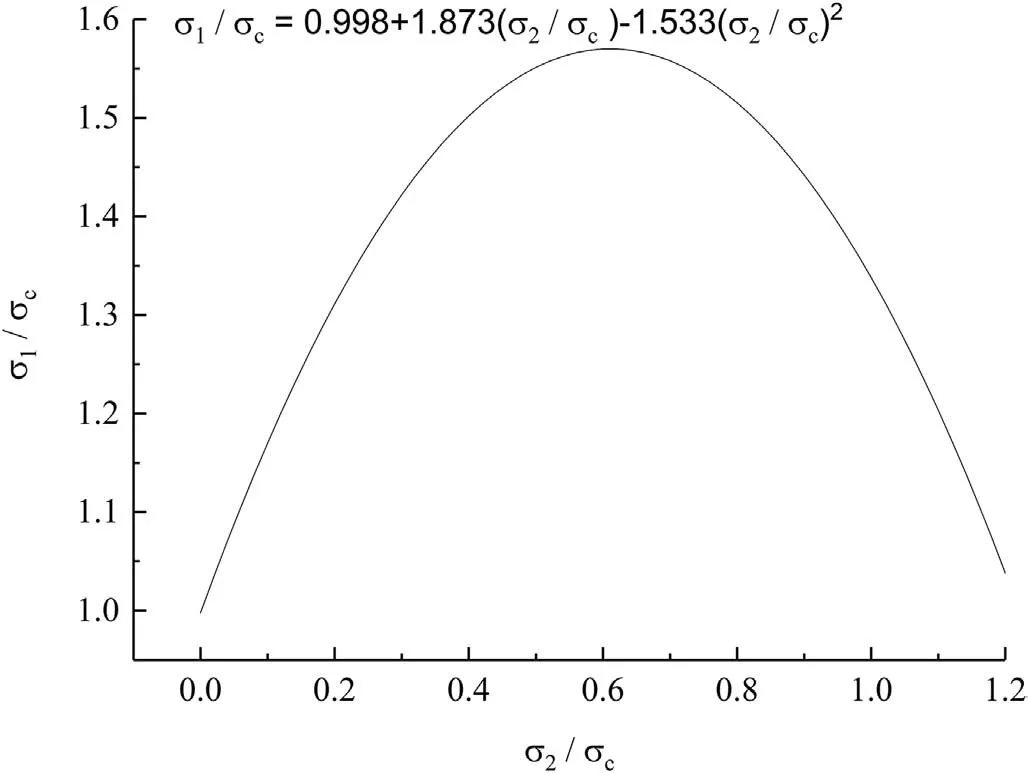
Fig.2.Failure criterion of granite under biaxial stress conditions.
The present study focuses on an underground mine with a fault running parallel to a steeply dipping,tabular orebody.Such tabular orebodies are frequently encountered in hard rock mines in Canada and extracted with sublevel stoping methods(Zhang and Mitri,2008).Fig.3a depicts the perspective view of a numerical model encompassing such geological structures.As can be seen in this figure,the dimensions of the model are 300 m×332 m×300 m(height×width×length).The dimensions are basically the same as that analyzed by Sainoki and Mitri(2014b),in order that the effect of the external boundaries on the stress state around the orebody and the fault is negligible.The fault runs parallel to the orebody and steeply dips at 80°.Dense meshes are generated near the orebody and the fault in order to simulate stress redistribution caused by mining activities as accurately as possible.The mesh density decreases towards the model outer boundaries.The total numbers of zones and grid points in the model are 215,040 and 230,643,respectively.
Stopes(mining blocks)are modeled in the orebody from the 1st to the 9th level as shown in Fig.3b.The distance between each level is 30 m,and the strike length of the orebody extracted on each level is 200 m.The stopes are extracted according to the mining sequence as per sublevel stoping method with delayed backfill.The mining method is widely employed when a steeply dipping tabular orebody is extracted.Fig.4 shows the stope dimensions and mining sequence.It can be seen from this figure that on each sublevel there are two stopes.Stope1H and Stope1F denote the stopes located on the 1st level on the hanging wall and footwall sides,respectively.In total,18 stopes are designed.The mining sequence starts from the bottom and proceeds upwards according to the numbers illustrated in Fig.4.For each sublevel,the stopes on the hanging wall side are extracted first.As for the dimensions of the stopes,the height is 30 m and the strike length is 200 m as shown in Fig.4a and b,respectively.As a large amount of extraction of orebody induces regional stress redistribution that eventually triggers fault-slip,such long stope strike length is adopted rather than extracting numerous stopes on each level.Note that the stopes are backfilled immediately after extraction.
2.4.Analysis procedure
First,as shown in Fig.5,static analyses are performed,in which the stopes in the orebody are extracted and backfilled in accordance with the mining sequence after simulating in-situ stress state.When the stopes are extracted,the biaxial failure model is applied to the stope boundary to a depth of 1 m in the hanging wall as the stress state in the vicinity of the stope wall becomes biaxial.The stope extraction continues until Stope7H where the fault is adequately unclamped,consequently increasing potential for faultslip sufficiently as shown in Sainoki and Mitri(2014d).Subsequently,based on the stressstate after extracting Stope7H,dynamic analysis is conducted.At the beginning of the dynamic analysis,the boundary condition is changed to viscous in order to prevent seismic waves arising from fault-slip from reflecting on the boundaries.At the same time,the stress state on the fault is examined,and then for the area where plastic shear movements are taking place along the fault,the JRC and angle of friction of the fault are decreased,thereby inducing an instantaneous stress drop that drives fault-slip.The decrease in JRC represents shearing of fault surface asperities,while the reduction in angle of friction denotes the transition from static to kinetic friction.At each step during the dynamic analysis,the stress state on the fault is checked and the change in the mechanical properties is performed if the conditions are satisfied.In this way,fault-slip is driven during the dynamic analysis.
2.5.Mechanical properties of rock mass and fault

Fig.3.Isometric view of numerical model analyzed encompassing a hanging wall fault running parallel to the orebody.
Mechanical properties of the rock masses are derived from the case study(Henning,1998).According to the study,rock types for the hanging wall,orebody,and footwall are rhyolite tuff,massive sulphide,and rhyolite,respectively.The mechanical properties estimated from laboratory experiments are converted to those for rock masses with the rock mass rating(RMR)system proposed by Bieniawski(1989).Table 1 lists the deformation modulus,E,cohesion,c,angle of friction,φ,unit weight,γ,tensile strength,σT,and dilation angle,ψ.Note that the tensile strength is assumed to be one-tenth of UCS calculated from the cohesion and angle of friction(Tesarik et al.,2003),and the dilation angle is assumed to be one fourth of the angle of friction(Hoek and Brown,1997)except that for the backfill(Traina,1983).In the absence of data about the post peak behavior of the rock mass,a perfect elastoplastic material was adopted.In the present study,deterministic analysis is performed with the derived rock mass properties,although in recent years,probabilistic analysis is occasionally performed to account for the uncertainties of geotechnical data with normal distribution(Abdellah et al.,2014).
The physico-mechanical properties of the fault applied to the ubiquitous joint model are listed in Table 2.Assuming that fractures and cracks contribute to the softening of the fault material,the modulus of elasticity is set to one-tenth that of the hanging wall.According to Barton and Choubey(1977),the basic angles of friction of typical rocks range from 21°to 38°.The adopted value is an intermediate value of the range.Likewise,JRC typically ranges from 0 to 20(Barton,1973),thus giving the intermediate value of 10.Regarding the dynamic angle of friction,φd,the same value as that used by Sainoki and Mitri(2014b)is applied.It should be noted that the dynamic angle of friction is applied to zones where the shear stress acting on the fault reaches the maximum value during dynamic analysis.
Regarding the material constants in Eq.(2),the influence of geological conditions is taken into account with RMR.Specifically,the equation proposed by Mitri et al.(1994)is applied to the two parametersBandC.As a result,the two parameters,BandC,are decreased to0.79 and-0.65,respectively.Regarding the parameter,A,it remains the same because UCS in Eq.(2)is directly decreased with the Hoek-Brown’s parameter,s(Hoek and Brown,1997).
2.6.Damage evaluation method
The present study employs two types of evaluation methods for damage induced by seismic waves arising from simulated fault-slip.The first one is the ratio of plastic strain increment to elastic strain and is expressed as follows:
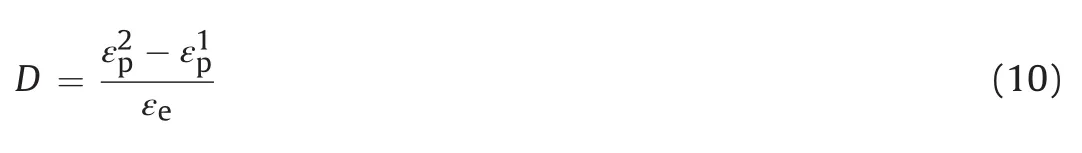
whereDis a damage index;andare respectively the plastic strains at the beginning of the dynamic analysis and at a target time when the instantaneous damage is evaluated;and εeis the elastic strain.Schematically,the strains used in Eq.(10)are illustrated in Fig.6.As can be seen from Eq.(10)and Fig.6,the damage inflicted by only seismic waves(dynamic plastic strain increment)is evaluated,meaning that the damage associated with the evolution of plastic strain caused by stope extraction during the static analysis is precluded.Eq.(10)is intended to assess the damage occurring at the moment when the most intense seismic wave that causes high peak particle velocity reaches the rock mass in the proximity of Stope7H.The quantity expressed with Eq.(10)or its variations is widely employed to evaluate damage.For instance,its inverse is used as the elastic damage model(Zhu et al.,2013).
The aforementioned method can be used to calculate momentary damage.However,seismic waves induce cyclic or random loadings to the rock mass,and as a result energy is accumulated in the rock mass.In order to evaluate the damage,the method proposed by Lachowicz(2001)is also employed as an alternative approach in the present study.According to Lachowicz(2001),the plastic strain energy density accumulated in the rock mass subjected to cyclic or random loading is calculated as follows:

Fig.4.Stopes modeled within the orebody and mining sequence as per sublevel stoping method:(a)Cross-section,and(b)Plan view at z=150 m.

whereEplis the plastic strain energy density accumulated during cyclic loading;σijand εijare the stress and strain,respectively;andp(t)is called instantaneous power function.Fig.7 schematically represents stress change in the rock mass subjected to seismic waves.According to the stress change,the instantaneous power functionp(t)varies as shown in Fig.7.The areas,EIandEIII,denote strain energy density accumulated by loading due to an external force,whileEIIandEIVrepresent strain energy accumulated by unloading due to an internal force(Lachowicz,2001).As indicated in this figure,in the case of an elastic material,the summation ofEIandEIIIis equal to that ofEIIandEIV,while inequality occurs when the material undergoes failure and shows plastic behavior.The difference between the works associated with internal and external forces is defined as plastic energy density under cyclic loading,which can be obtained from the integral expressed with Eq.(11).
3.Results and discussion
3.1.Seismic wave propagation
Before evaluating damage with Eqs.(10)and(11),the propagation of seismic waves arising from simulated fault-slip is examined in terms of particle velocity(PV)caused by the seismic waves.Fig.8 shows the PVs of grid points during the dynamic analysis in the sectional view aty=150 m.Note that the white-colored region in the figure is Stope7H.The propagation of seismic waves arising from the fault-slip can be clearly seen from the figure.Fig.8a shows the distribution of PV att=0.01 s after onset of the dynamic analysis.It is found that extremely high PV exceeding 1 m/s takes place in the vicinity of the fault.As time elapses,regions with relatively high PV move away from the fault,indicating the propagation of seismic waves.Aftert=0.04 s,ground motion occurs in extensive regions as a result of wave propagation.At the same time,the maximum PV in the section decreases to 0.5 m/s due to wave attenuation.
Comparison of PV amongst different stages suggests that the most intensive PV takes place near the stope aftert=0.02 s.Afterwards,the magnitude of PV near the stope continuously decreases due to the wave attenuation and propagation.Thus,for evaluating the instantaneous damage calculated using Eq.(10),PV afteran elapsed time of 0.02 s is used,so that the most conservative result would be obtained for the rock mass in the vicinity of Stope7H.
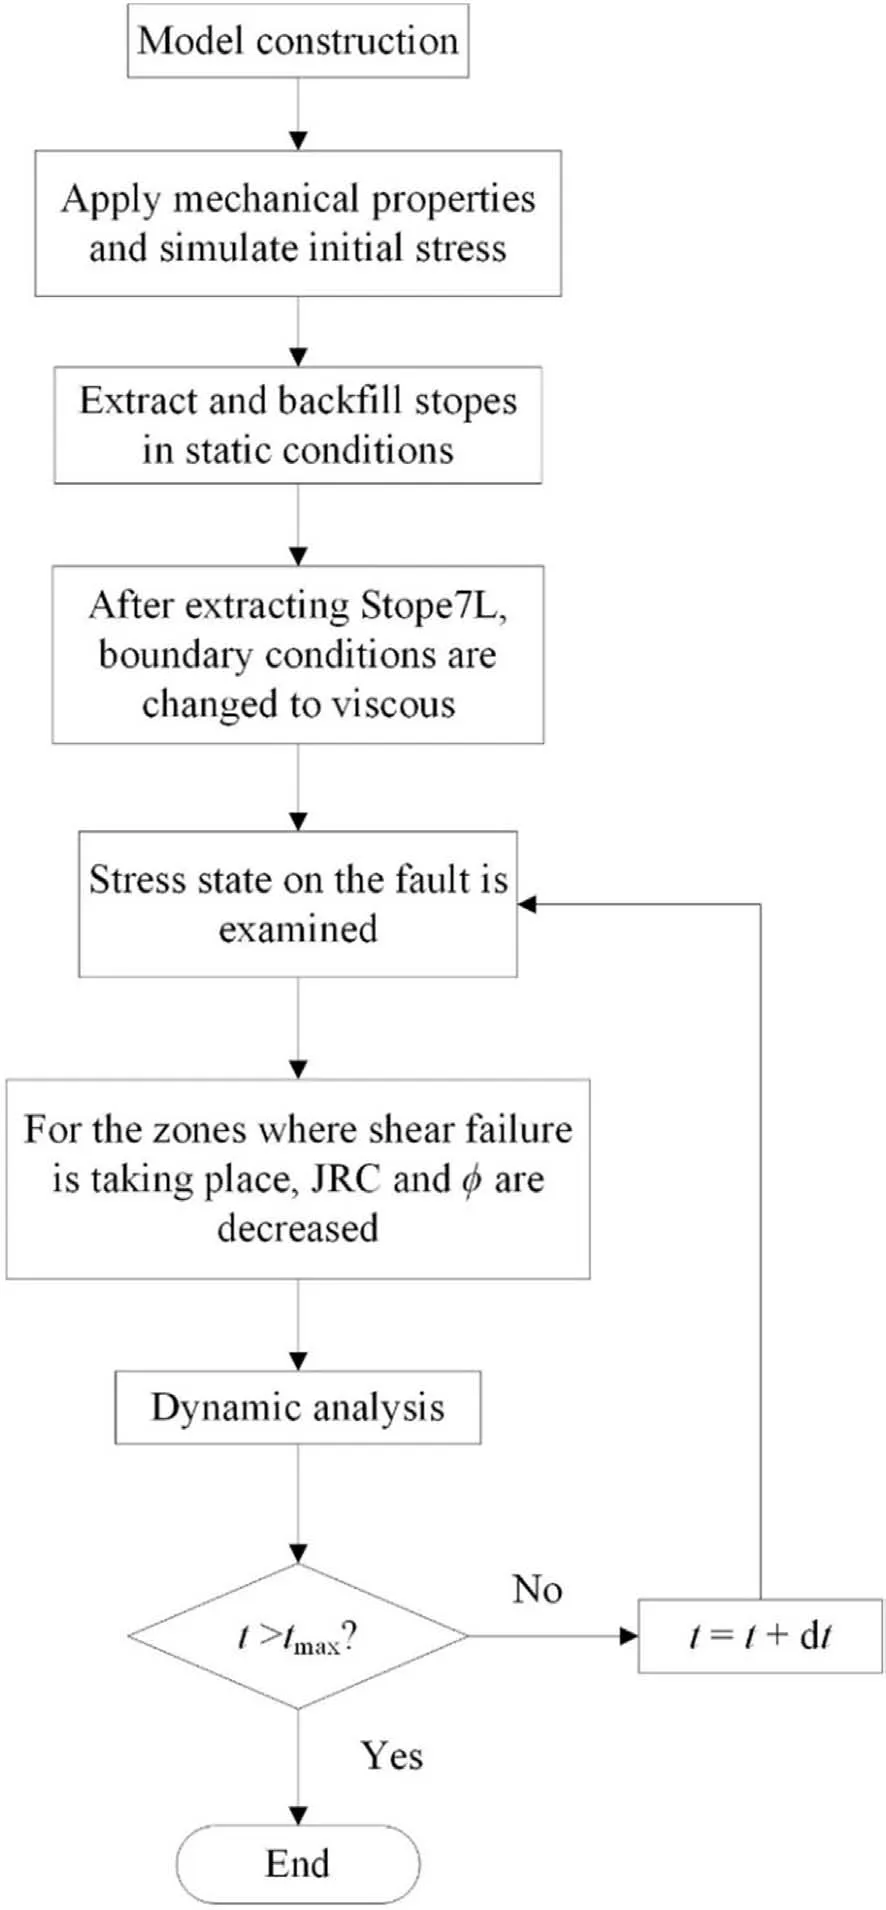
Fig.5.Analysis procedure for static and dynamic analyses.
3.2.Damage to stope wall induced by the seismic waves
Fig.9 shows the damage indexcalculated with Eq.(10),based on effective shear strain increment.As discussed earlier,in thecalculation,plastic strain att=0.02 s after onset of the dynamic analysis is used,and the damage inflicted by the stope extraction is subtracted.As shown in Fig.9,it is interesting that the damage is not uniformly distributed in the region between the stope and the fault.For instance,noticeable increase in damage can be observed within the following three locations:backfill under the stope(Damage A),the hanging wall(Damage B),and the upper part of the stope(Damage C).The damage that took place in the backfill would be attributed to the difference in impedance between the rock mass and backfill.As shown in Table 1,the elastic modulus of the hanging wall is 12 times larger than that of backfill,meaning that the impedance of the hanging wall rock mass is much greater than that of backfill.Thus,a transmitted wave from the hanging wall to the backfill has large amplitude,and the transmitted wave remains inside the backfill while reflects at the boundary between the backfill and the hanging wall.In reality,there would be a small gap between the hanging wall and backfill material.Therefore,the simulated resultis considered as an extreme case assuming that the boundary is continuous,but the analysis result implies that backfill may undergo relatively severe damage in comparison to the surrounding rock mass when a large seismic event occurs.The high value of the damage index above the stope is assumed to be caused by the arrival of a seismic wave with large amplitude and stiffness of the orebody.As shown in Table 1,the orebody is much stiffer than the surrounding rock masses,meaning that the rock mass in the orebody undergoes failure with smaller strain.As Eq.(10)denotes the ratio of plastic strain increment to strain at elastic limit,it is supposed that the damage index increases in the region above the stope.As for the region with a large damage index in the hanging wall,discussion will be made in conjunction with another damage index.
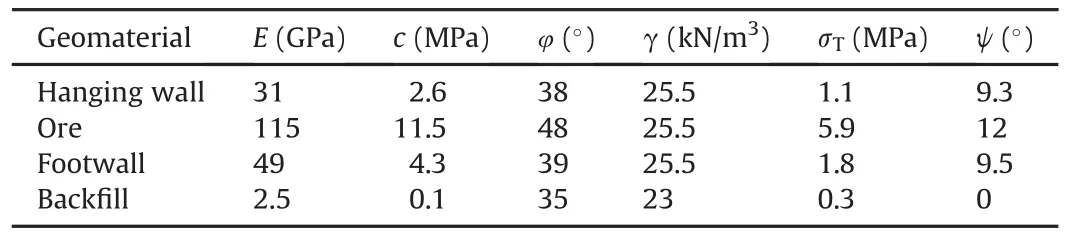
Table 1Mechanical properties of rock mass and backfill.

Table 2Physico-mechanical properties of the fault.

Fig.6.Schematic illustration of damage calculation.
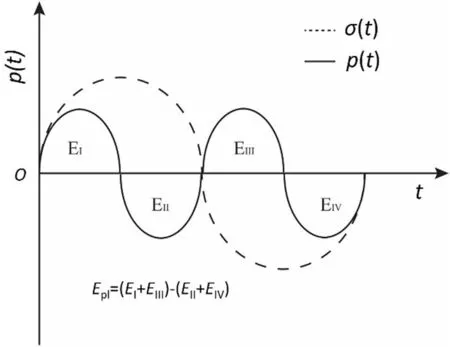
Fig.7.Schematic illustration of calculation of plastic strain energy density under cyclic or random loading.

Fig.8.Particle velocity(PV)in the sectional view of the model at y=150 m:(a)0.01 s after onset of the dynamic analysis,(b)0.02 s,(c)0.03 s,and(d)0.04 s.

Fig.9.Instantaneous damage calculated using Eq.(10)on the basis of effective shear strain increment for PVs at t=0.02 s after onset of the dynamic analysis.
Fig.10 represents the contours of plastic strain energy density computed using Eq.(11);Fig.11 shows the change in instantaneous power recorded at the observation points 1 to 4 as shown in Fig.10.Note that in the calculation ofEplandp(t),tensile stress is treated as positive.Comparing Fig.10 with the contours of the damage index in Fig.9,there are both similarities and discrepancies.First,it is found from Fig.10 that plastic strain energy density can take into account damage accumulation.In Fig.9,the damage index is partially greater than zero in the vicinity of the fault,indicating that there is no damage except the area of interest,whereas Fig.10 clearly indicates the extensive area subjected to the damage inflicted by the movement of the fault.On both hanging wall and footwall sides of the fault,damage associated with tension and compression takes place,colored in red and blue,respectively,in response to the downward movement of the hanging wall and upward movement of the footwall of the fault.It is noted that the blue-colored area subjected to compression damage in the upper right part of the fault extends to the orebody.This indicates that the incurred damage might have an influence on the stability of a sill drive in the orebody above the stope.Also,it can be inferred from the damage zone that rockburst potential increases in the hanging wall.Similar to Fig.9,the damage taking place in the backfill is also manifested in Fig.10.On the other hand,Fig.10 does not show damage immediately above the stope.This means that the damage accumulated occurs in the backfill due to seismic waves continuously reflecting on the boundaries between the backfill and the surrounding rock masses,while the damage immediatelyabove the stope shown in Fig.9(Damage C)is considered instantaneous and vanishes when the seismic wave passes the location.In Fig.11d,p(t)calculated at observation point 4 in the backfill does not significantly attenuate even after an elapsed time of 0.01 s,whereas for the other locationsp(t)reaches almost zero with elapsed time.The damage in the hanging wall shown in Fig.9(Damage B)is similarly reproduced in Fig.10,indicating that at that location the damage is being accumulated and is not instantaneous.However,according to Fig.8,it appears that there is no seismic wave causing high PVs at that location during the propagation of seismic waves.In order to investigate the reason that damage accumulation takes place at the location in the hanging wall,effective shear strain rate at the end of static analysis is shown in Fig.12.The figure indicates that shear strain continues toincrease in the area(Damage B)in Fig.9,and it is found that the rate is relatively high compared with the surrounding regions,although the rate is infinitesimal.Therefore,regarding the damage in the hanging wall in Figs.9 and 10,it can be concluded that the highEpland the damage index computed at the location in the hanging wall are not ascribed to seismic waves.Rather, shear strain accumulation resulting from stress redistribution due to rock mass failure in a quasi-static condition is its direct cause.Thus,Damage B in Fig.9 should not be considered as damage caused by simulating mining-induced fault-slip.

Fig.10.Plastic strain energy density calculated with Eq.(11).The numbers in the figure represent observation points for the instantaneous power in Eq.(11).
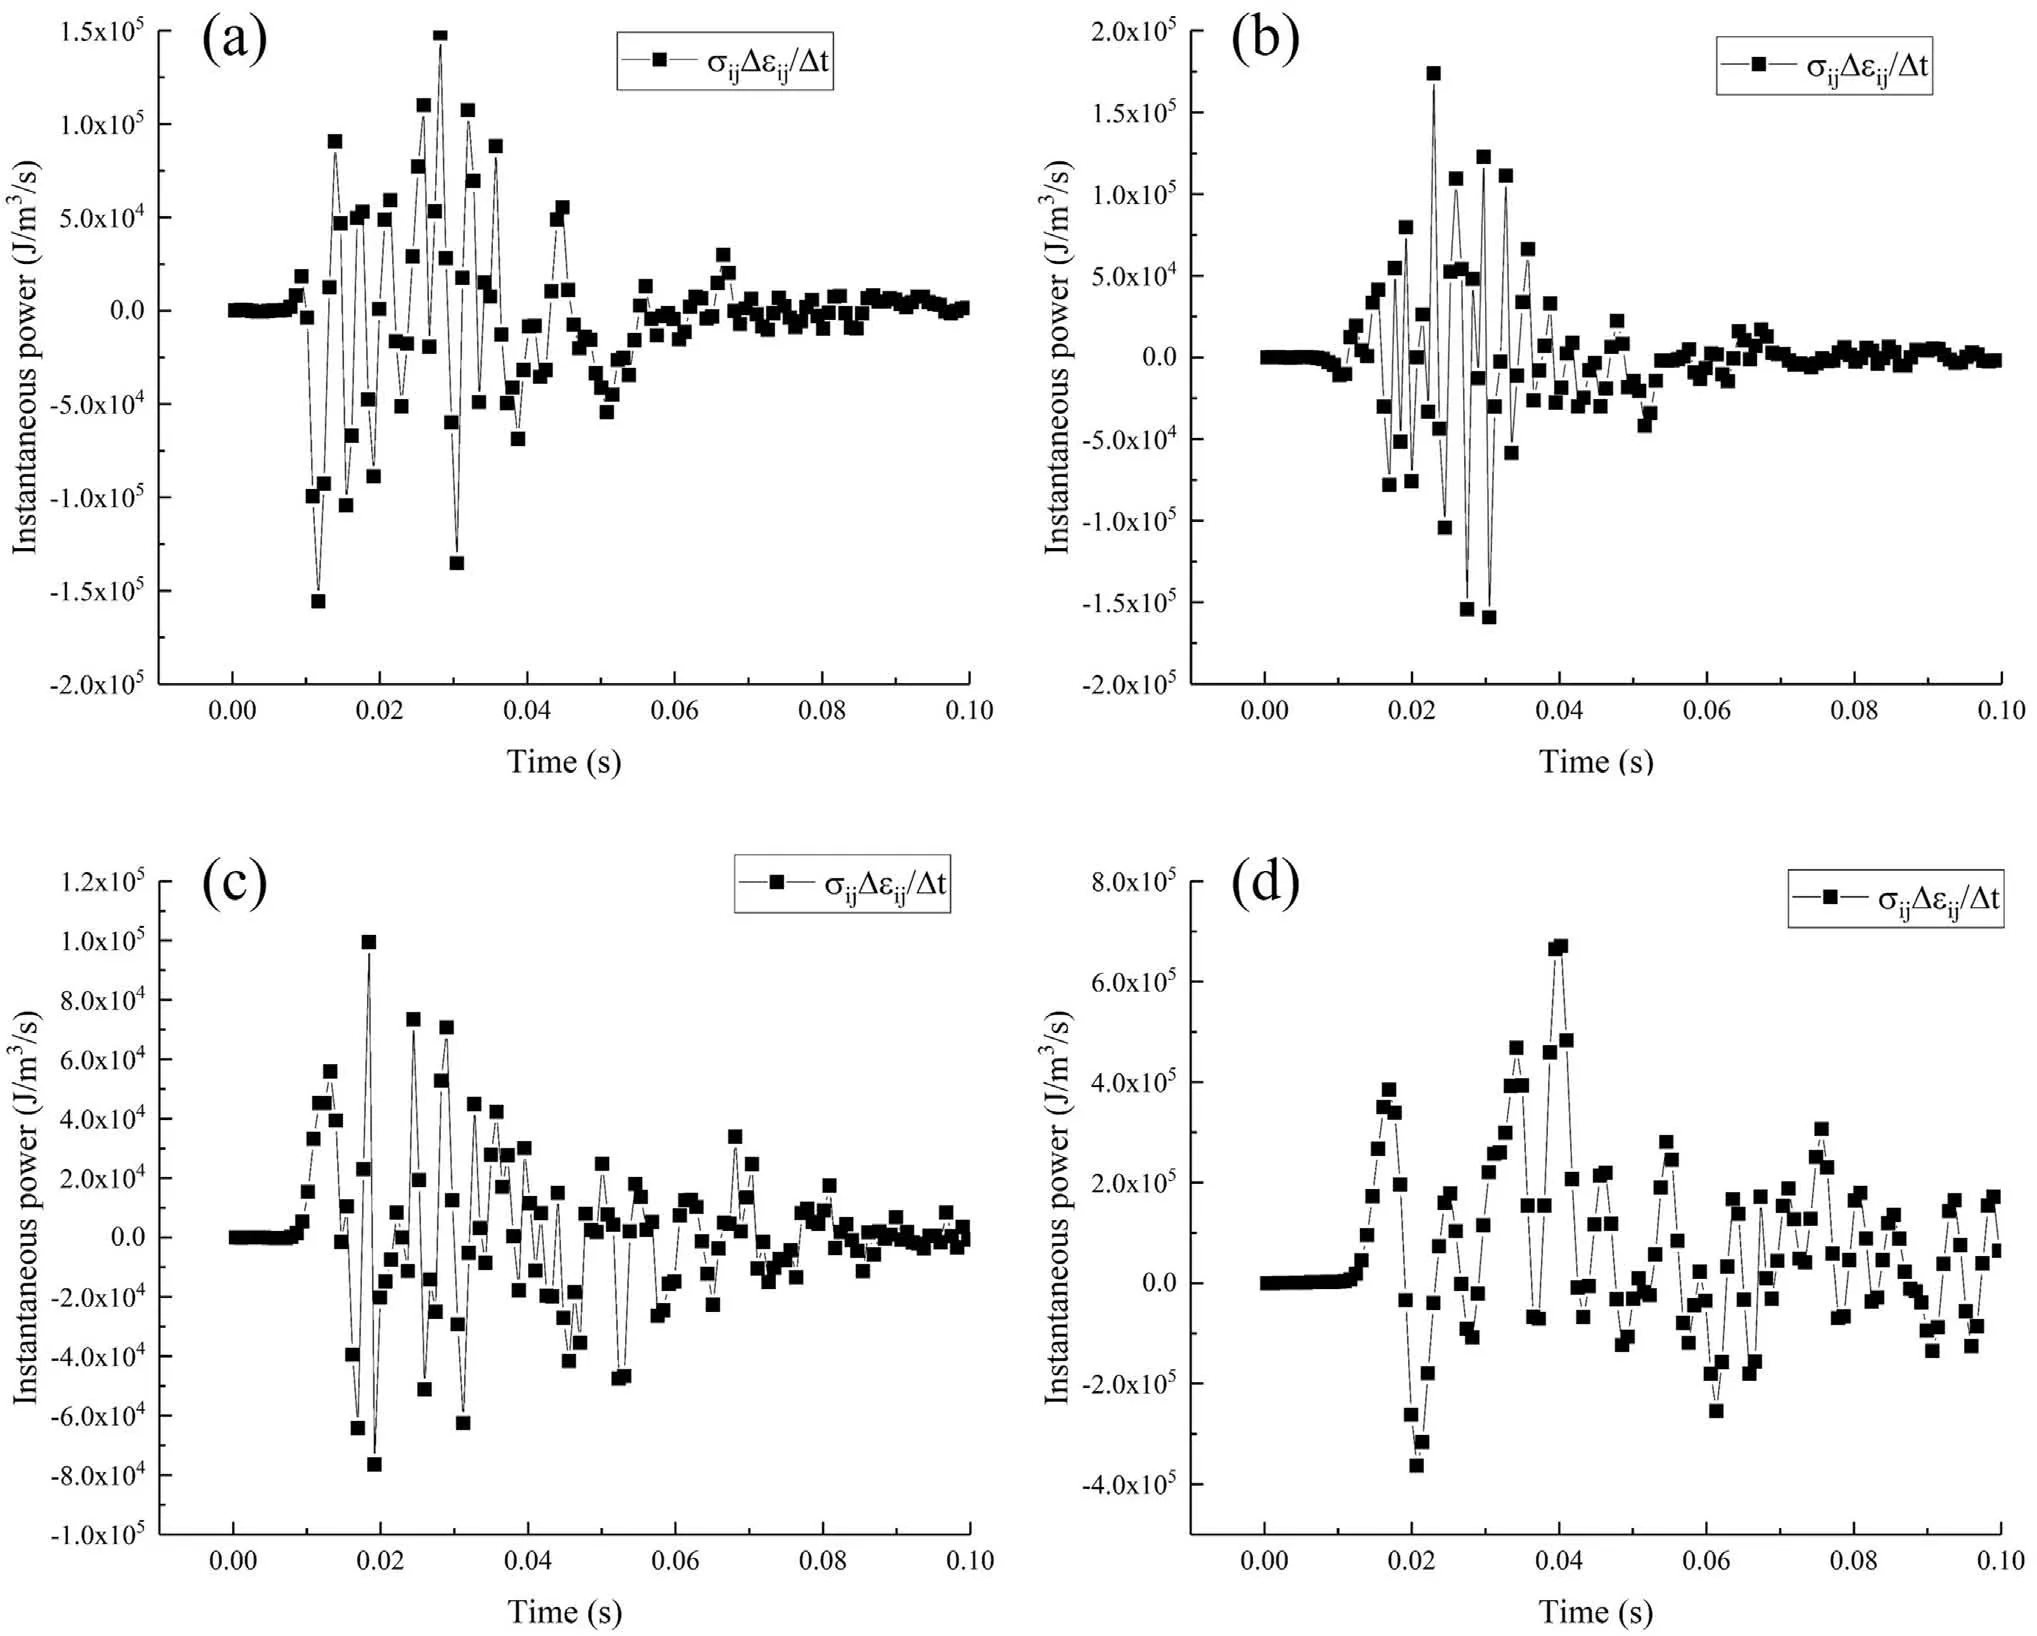
Fig.11.Change in instantaneous power during the seismic event observed at the observation points shown in Fig.10:(a)Observation point 1,(b)Observation point 2,(c)Observation point 3,and(d)Observation point 4.

Fig.12.Effective shear strain rate output at the end of static analysis.
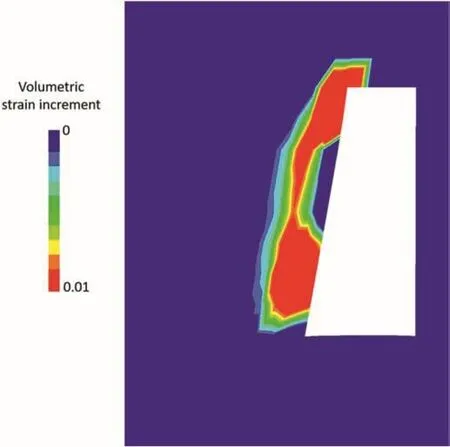
Fig.13.Damage index calculated with Eq.(10)based on volumetric strain increment at t=0.02 s after onset of the dynamic analysis.
Finally,damage index is calculated with Eq.(10)only for zones that have undergone tensile failure.In the calculation,volumetric strain increment att=0.02 s after onset of the dynamic analysis is used instead of effective shear strain increment because shear strain is not a representative index to determine the progression and evolution of tensile failure.The calculated result is shown in Fig.13.Comparing the damage contours in Fig.13 with those in Figs.9 and 10,it is found that the damage index based on the volumetric strain increment shows contours that completely differ from the others.In Fig.13,the damage index increases only in the vicinity of the stope wall,and seismic waves reflecting on a free boundary cause a tensile stress zone.Therefore,the increase in damage index near the stope wall is attributed to the reflected seismic waves.It is well-known that seismic waves arising from mining-induced fault-slip can cause damage to mine openings in forms of rock ejection and collapse of a drift wall(Ortlepp,2000).Hence,it is reasonable that the damage contours calculated with volumetric strain increment using Eq.(10)can be related to such damage.
3.3.Potential use of the obtained result to actual case studies
The primary purpose of the present study is to compare damage evaluation methods for rock mass subjected to seismic waves and to investigate their differences and applicability to actual case studies by simulating mining-induced fault-slip with a representative three-dimensional(3D)numerical model in dynamic conditions.The resultsshown inprevious sections have ascertained the characteristics of each damage evaluation method.Eplis effective to identify damage accumulation caused by seismic waves and fault movements in an extensive area.For instance,at Lucky Friday Mine,fault movements caused damage to the rock mass surrounding stopes,and it is concluded that seismic waves are not a major influence factor.In this case,Eplwould be an appropriate choice to evaluate the damage.On the other hand,the present study shows that the damage index calculated with Eq.(10)is suitable for detecting instantaneous damage.As shown in Fig.13,the damage near the stope wall can be appropriately assessed with this damage index,which cannot be detected withEpl.Also,the damage immediately above Stope7L(Damage C)in Fig.9 can be inferred from this damage index.However,as discussed above,when this method is employed,the time when this index is calculated is crucial.There is a need to choose the worst case where the largest PV is taking place near a target opening.Combining the two damage indices would lead to a better evaluation of damage induced by seismic waves.It is noteworthy that future study de finitely needs to involve the determination of a threshold at which actual damage is induced.
4.Conclusions
The present study examines methodologies to evaluate damage induced by seismic waves arising from fault-slip.In order to replicate the actual mechanism of mining-induced fault-slip,the effect of fault surface asperities is taken into account,whereby fault-slip is driven in dynamic conditions by an instantaneous stress drop due to the shearing of the asperities.The dynamic analysis enables to observe the propagation of seismic waves arising from fault-slip,i.e.PV at a given elapsed time after onset of the fault-slip.Two methodologies are employed to assess the damage caused by seismic wave propagation;(i)the ratio of plastic strain increment to elastic strain limit,and(ii)the accumulation of plastic strain energy density.The analysis results clarify that the former is appropriate to evaluate instantaneous damage,including the one taking place near a stope wall that might lead to rock ejection and wall collapse.More importantly,the results differ depending on which strain increment is used in the calculation,i.e.effective shear strain increment or volumetric strain increment.As for the damage taking place near a stope wall,the results suggest that the volumetric strain increment be used,while effective shear strain clearly shows damage in backfill.The damage evaluation method with plastic strain energy is found to be suitable for detecting damage in an extensive area caused by seismic waves as well as fault movements.The method evaluates the accumulation of plastic strain energy density,so that the damage that mightoccur away from the causative fault,such as damage to a sill drive,can be detected.Based on these results,a better understanding of the damage evaluation methods has been achieved.It can be concluded that comprehensive damage evaluation is accomplished by combining the methodologies presented in this context.
Conflict of interest
The authors wish to confirm that there are no known conflicts of interest associated with this publication and there has been no significant financial support for this work that could have influenced its outcome.
Acknowledgement
This work is financially supported by a grant by the Natural Science and Engineering Research Council of Canada(NSERC)in partnership with Vale Ltd.-Sudbury Operations,Canada,under the Collaborative Research and Development Program.The authors are grateful for their support.
Abdellah W,Mitri HS,Thibodeau D,Moreau-Verlaan L.Geotechnical risk assessment of mine development intersections with respect to mining sequence.Geotechnical and Geological Engineering 2014;32(3):657-71.
Alber M,Fritschen R.Rock mechanical analysis of aM1=4.0 seismic event induced by mining in the Saar District,Germany.Geophysical Journal International 2011;186(1):359-72.
Barton N.Review of a new shear-strength criterion for rock joints.Engineering Geology 1973;7(4):287-332.
Barton N,Choubey V.The shear strength of rock joints in theory and practice.Rock Mechanics and Rock Engineering 1977;10(1-2):1-54.
Bieniawski ZT.Engineering rock mass classfications.New York:Wiley;1989.
Diederichs MS.The 2003 Canadian Geotechnical Colloquium:mechanistic interpretation and practical application of damage and spalling prediction criteria for deep tunnelling.Canadian Geotechnical Journal 2007;44(9):1082-116.
Henning J.Ground control strategies at the Bousquet 2 mine.Montreal,QC,Canada:McGill University;1998.
Hoek E,Brown ET.Practical estimates of rock mass strength.International Journal of Rock Mechanics and Mining Sciences 1997;34(8):1165-86.
Hofmann GF,Scheepers LJ.Simulating fault slip areas of mining induced seismic tremors using static boundary element numerical modeling.Mining Technology 2011;120(1):53-64.
Homand F,Belem T,Souley M.Friction and degradation of rock joint surfaces under shear loads.International Journal for Numerical and Analytical Methods in Geomechanics 2001;25(10):973-99.
Indraratna B,Welideniya S,Brown T.New shear strength criterion for infilled rock joints.In:Geotechnique,55;2005.p.215-26.Institution of Civil Engineerings.
Indraratna B,Jayanathan M,Brown T.Shear strength model for over consolidated clay-infilled idealized rock joints.Geotechnique 2008;58(1):55-65.
Kulatilake PHSW,Shou G,Huang TH,Morgan RM.New peak shear strength criteria for anisotropic rock joints.International Journal of Rock Mechanics and Mining Sciences&Geomechanics Abstracts 1995;32(7):673-97.
Ladanyi B,Archambault G.Simulation of shear behaviour of a jointed rock mass.In:Proceedings of the 11th US symposium on rock mechanics,1969;1970.p.105-25.Berkeley,California.
Lachowicz CT.Calculation of the elastic-plastic strain energy density under cyclic and random loading.International Journal of Fatigue 2001;23(7):643-52.
Lee SW,Hong ES,Bae SI,Lee IM.Modeling of rock joint shear strength using surface roughness parameter,Rs.Tunnelling and Underground Space Technology 2006;21(2-3):239.
Malek F,Suorineni FT,Vasak P.Geomechanics strategies for rockburst management at Vale Inco Creighton Mine.In:Proceedings of ROCKENG09.Toronto;2009.Paper 4234.
Mitri HS,Edrissi R,Henning J.Finite element modeling of cable-bolted stopes in hardrock ground mines.In:SME annual meeting.Albuquerque,New Mexico;1994.p.94-116.
Ortlepp WD,Stacey TR.Rockburst mechanisms in tunnels and shafts.Tunnelling and Underground Space Technology 1994;9(1):59-65.
Ortlepp WD.Observation of mining-induced faults in an intact rock mass at depth.International Journal of Rock Mechanics and Mining Sciences 2000;37(1-2):423-6.
Palmström A.Characterizing rock burst and squeezing by the rock mass index.In:Design and construction of underground structures.23-25 February 1995.New Delhi;1995.p.1-10.
Ryder JA.Excess shear stress in the assessment of geologically hazardous situations.Journal of South African Institute of Mining and Metallurgy 1988;88(1):27-39.
Saeb S,Amadei B.Modeling rock joints under shear and normal loading.International Journal of Rock Mechanics and Mining Sciences 1992;29(3):267-78.
Sagy A,Brodsky EE,Axen GJ.Evolution of fault-surface roughness with slip.The Geology Society of America 2007;35(3):284-6.
Sainoki A,Mitri HS.Dynamic behaviour of mining-induced fault slip.International Journal of Rock Mechanics and Mining Sciences 2014a;66:19-29.
Sainoki A,Mitri HS.Simulating intense shock pulses due to asperities during faultslip.Journal of Applied Geophysics 2014b;103:71-81.
Sainoki A,Mitri HS.Dynamic modeling of fault slip with Barton’s shear strength model.International Journal of Rock Mechanics and Mining Sciences 2014c;67:155-63.
Sainoki A,Mitri HS.Evaluation of fault-slip potential due to shearing of fault asperities.Canadian Geotechnical Journal 2014d;52(10):1417-25.
Sainoki A,Mitri HS.Back analysis of fault-slip in burst prone environment.Journal of Applied Geophysics 2016;134:159-71.
Sjöberg J,Perman F,Quinteiro C,Malmgren L,Dahner-Lindkvist C,Boskovic M.Numerical analysis of alternative mining sequences to minimise potential for fault slip rockbursting.Mining Technology 2012;121(4):226-35.
Tesarik DR,Seymour JB,Yanske TR.Post-failure behavior of two mine pillars confined with backfill.International Journal of Rock Mechanics and Mining Sciences 2003;40(2):221-32.
Traina LA.Experimental stress-stain behaviour of a low strength concrete under multiaxial state of stress.Kirtland Air Force Base,NM:Air Force Weapons Laboratory;1983.
Wallace RE,Morris T.Characteristics of faults and shear zones in deep mines.Pure and Applied Geophysics 1986;124(1-2):107-25.
Wang X,Cai M.Influence of wavelength-to-excavation span ratio on ground motion around deep underground excavation.Tunnelling and Underground Space Technology 2015;49:438-53.
Yun X,Mitri HS,Yang X,Wang Y.Experimental investigation into biaxial compressive strength of granite.International Journal of Rock Mechanics and Mining Sciences 2010;47(2):334-41.
Zhang Y,Mitri H.Elastoplastic stability analysis of mine haulage drift in the vicinity of mined stopes.International Journal of Rock Mechanics and Mining Sciences 2008;45(4):574-93.
Zhu WC,Wei CH,Li S,Wei J,Zhang MS.Numerical modeling on destress blasting in coal seam for enhancing gas drainage.International Journal of Rock Mechanics and Mining Sciences 2013;59:179-90.
 Journal of Rock Mechanics and Geotechnical Engineering2018年1期
- Journal of Rock Mechanics and Geotechnical Engineering的其它文章
- Anisotropy effect on strengths of metamorphic rocks
- Influence of loading and heating processes on elastic and geomechanical properties of eclogites and granulites
- Geomechanical characterization of volcanic rocks using empirical systems and data mining techniques
- Investigation of creep behaviours of gypsum specimens with flaws under different uniaxial loads
- Effects of lime addition on geotechnical properties of sedimentary soil in Curitiba,Brazil
- Corrigendum to“Back-analysing rock mass modulus from monitoring data of two tunnels in Sydney,Australia”[J Rock Mech Geotech Eng 5(2017)877-891]