基于高光谱特征和偏最小二乘法的春小麦叶绿素含量估算
尼加提·卡斯木,师庆东,王敬哲,茹克亚·萨吾提,依力亚斯江·努尔麦麦提,古丽努尔·依沙克
基于高光谱特征和偏最小二乘法的春小麦叶绿素含量估算
尼加提·卡斯木1,2,师庆东1,2※,王敬哲1,2,茹克亚·萨吾提1,2,依力亚斯江·努尔麦麦提1,2,古丽努尔·依沙克1,2
(1. 新疆大学资源与环境科学学院,乌鲁木齐 830046;2. 新疆大学绿洲生态教育部重点实验室,乌鲁木齐 830046)
叶绿素含量是影响作物生长及产量的主要因素。该研究以2017年6月小型试验田获取的抽穗期春小麦叶绿素含量及其对应的光谱反射率为数据源,对红边(627~780 nm)、黄边(566~589 nm)、蓝边(436~495 nm)、绿边(495~566 nm)、吸收谷和反射峰的最大反射率及反射率总和等16个高光谱特征参数与叶绿素含量之间的相关性进行了分析,并结合偏最小二乘回归法(partial least-squares regression, PLSR)对叶绿素含量进行高光谱建模及验证。结果表明:1)对特定的16个光谱特征参数而言,光谱特征参数绿边最大反射率与春小麦叶绿素质量分数之间的决定系数最低(2<0.5);决定系数较高(2≥ 0.5)的光谱特征参数包括蓝边最大反射率、蓝边反射率总和、黄边最大反射率、黄边反射率总和、红边最大反射率、红边反射率总和、绿边反射率总和、820~940 nm反射率总和及最大反射率、500~670 nm归一化吸收深度和560~760 nm归一化吸收深度,其中820~940 nm反射率总和决定系数达到最高(2为0.8);2)利用16个特征参量进行PLSR建模后,发现波段范围在820~940 nm的最大反射率及反射率总和所建立的PLSR估算模型为最优模型,其精度参数2=0.8、RMSE=2.0mg/g、RPD=3.2。因此,该模型具有极好的预测能力。该研究为相关研究及当地精准农业提供科学支持和应用参考。
模型;叶绿素;光谱分析;高光谱;光谱特征参数;偏最小二乘回归
0 引 言
叶绿素是光合作用过程中起吸收光能的植被色素,是主要的吸收光能的物质,其含量高低直接影响植被光合作用过程中的光能利用[1]。农作物叶片的叶绿素含量与叶片的净光合速率、光合能力、发育阶段以及氮素状况具有良好的相关性,已经成为了评价植被生长发育和营养状况的一种重要的指示器[2-3]。小麦是中国主要的粮食作物之一,其产量大约占全国粮食总产量的70%,对中国粮食生产安全具有相当重的作用[4]。在春小麦的各个发育阶段中,抽穗期是需要生产以及追肥管理的关键时期,这一时期春小麦叶片中较高的叶绿素含量可以促进小麦叶片生长、延长叶片功能、提高光合效率及产量[5-6]。小麦叶片中的叶绿素含量、浓度、影响因子等研究受到了众多研究学者的高度关注。
近几十年来,遥感技术凭借其大尺度、高效率、低成本等优势在农作物的生长状况、播种面积、分布情况等方面得以广泛应用。受叶片中叶绿素吸收作用的影响,农作物叶片在可见光部分存在明显的吸收谷,在近红外波段(受叶片内部的结构以及冠层结构特性共同影响)反射率较高并形成突峰,可以反映农作物长势信息[7]。而高光谱技术凭借其高分辨率、高效率、无损害、安全等特性广泛应用于作物叶绿素含量以及浓度的估算,为农作物叶绿素含量研究以及实施精细农业提供了有效手段[8-11]。Alabbas等[12-16]学者证明了利用冠层反射光谱监测农作物的叶绿素含量的可行性。Bnnari等[17]通过实验室获取的高光谱数据以及PRI(531~550)nm、SRPI(430~680 nm)、CARI(670~700 nm)、PSSR(680~800 nm)等高光谱叶绿素指数对冬小麦叶绿素含量进行了估算。Daughtry等[18]研究了植被光谱与叶绿素浓度的关系,并总结了光谱红边位置在作物叶绿素含量估计中的作用。Curran等[19]研究表明,红边位置对冠层总叶绿素含量敏感程度。郭燕等[20]选择小麦拔节期和成熟期的叶绿素含量,采用全光谱数据进行建模预测小麦叶绿素含量,并采用统计学方法进行各生育期空间变异制图。黄慧等[21]选取波长491~887 nm范围光谱,采用一阶、二阶微分以及多元散射校正3种处理方法,利用逐步回归法和偏最小二乘回归(partial least-squares regression,PLSR)分别建立了小麦叶绿素含量与光谱信号间的数学模型。罗丹等[22]利用350~2500 nm范围内的原始光谱反射率及其一阶导数光谱的任意两两波段交叉组合而成的主要高光谱指数与冬小麦冠层叶片叶绿素含量的定量关系,建立小麦冠层叶绿素含量估算模型。
以往对于小麦叶片叶绿素含量的研究仅对利用单个敏感波进行建模,而对于光谱细节变换及多个特征参数综合建模的研究相对较少,这可能会造成光谱数据无法充分利用,模型精度在一定程度上也会受到制约。本研究以新疆大学阜康实验基地的春小麦为研究对象,利用55个冠层采样区的野外高光谱数据,并结合实测春小麦抽穗期叶绿素含量,分析春小麦抽穗期光谱特征,尝试性的利用最大反射率、反射率总和、吸收深度、归一化吸收深度的光谱特征参数进行偏最小二乘回归建模,并进行估算精度验证,以期深度挖掘光谱数据并进一步提高春小麦叶绿素含量的高光谱预测精度,为卫星传感器的设计、区域精准农业的发展提供科学支持和应用参考。
1 材料与方法
1.1 研究区概况
新疆大学阜康实验基地位于新疆维吾尔自治区阜康市滋泥泉子镇以北,地理坐标87°34′5″~88°34′10″E,44°23′12″~44°23′15″N,实验基地周边均为大型农场,主要播种作物为冬小麦、春小麦和玉米;此区域属于典型的温带大陆性荒漠气候,气候特点是四季分明,冬冷夏热,春秋气温变化剧烈,降水量少且不均匀,春夏降水量约占全年降水量的2/3[23]。境内气候具有垂直地带性分布特征,山区中部的年降水量为530.11 mm,平原区为187.5 mm,沙漠区则通常只有144.7 mm。地形呈长条状,南高北低,由东南向西北倾斜,地貌总轮廓由南向北分为山地、平原、沙漠3大部分。阜康绿洲生态系统内的植被以农田和荒漠占主导,主要分布在绿洲内部、绿洲边缘、荒漠带和绿洲—荒漠过度地带,年无霜期可达175 d,日较差大,具有新疆地区典型地理地貌特征(山地-绿洲-荒漠绿洲)。北部沙漠区为古尔班通古特沙漠的一部分,阜康市位于冲洪积扇的上部,是开垦历史较为悠久的老绿洲,下游二二二团是解放后新开垦的绿洲[24]。
1.2 采样点布设
研究区播种春小麦总面积为50 m×150 m,采样区以1 m×1 m为样方,并进行网格状采样取均值作为该采样区的平均值,共设置55个采样区(图1),采样时间为2017年6月,研究区春小麦生育期为抽穗期。采用SPAD-502型便携式叶绿素仪在每个采样区分别采集同植株倒一、倒二叶片各3次取平均值作为改采样区冠层的春小麦的叶绿素含量指标。与此同时,春小麦的光谱反射率测定使用美国ASD(Analytical Spectral Devices)公司生产的FieldSpec3型光谱仪(波段范围350~2500 nm)。光谱在350~1000与1000~2500 nm区间的采样间隔分别为1.4与2 nm,重采样间隔为1 nm。将在采样区进行测量时,每个活体样品由多个叶片组成,距植株叶片10 cm左右,测量时探头的天顶角为15°,每次光谱测定之前均进行白板标定,重复测量10次,取光谱曲线的算术平均值作为该样区的实际光谱反射率[25]。
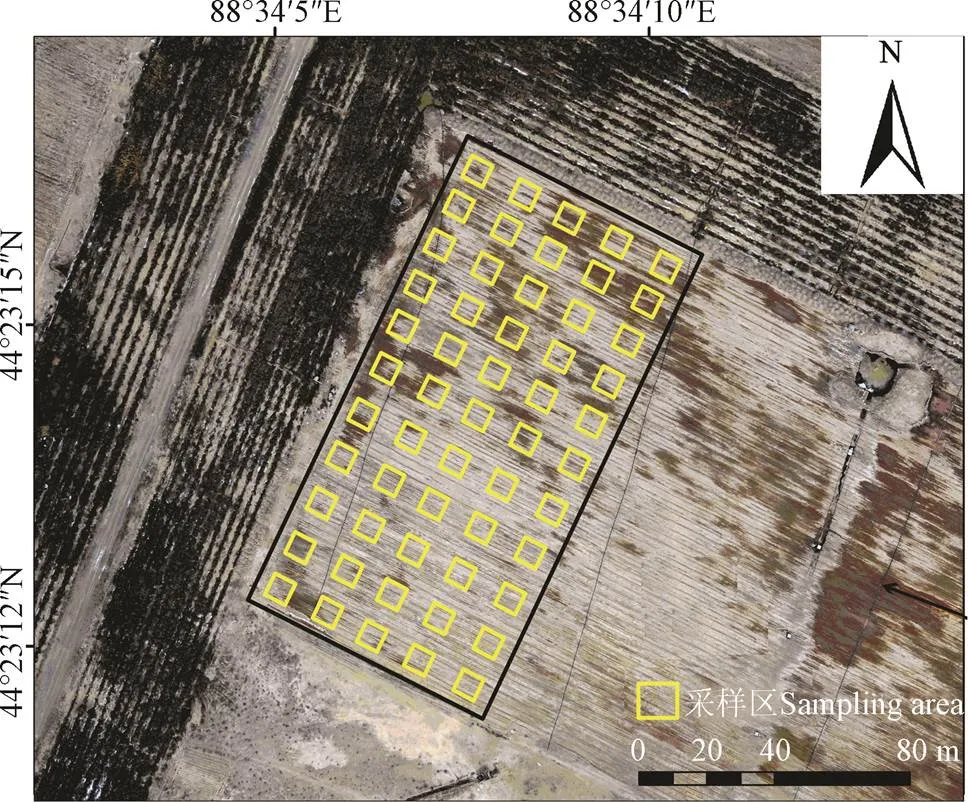
图1 研究区位置和采样区分布
1.3 数据处理
本研究区共采集55×3个春小麦叶绿素含量,每个采样区重复测量3次,并计算各个采样区的平均叶绿素含量。为了使建模集和验证集可以充分反映研究区小麦叶片叶绿素含量的实际情况,将55个样本按叶绿素含量从高到低进行排序,等间隔抽取34个建模集与21个验证集样本(表1)。
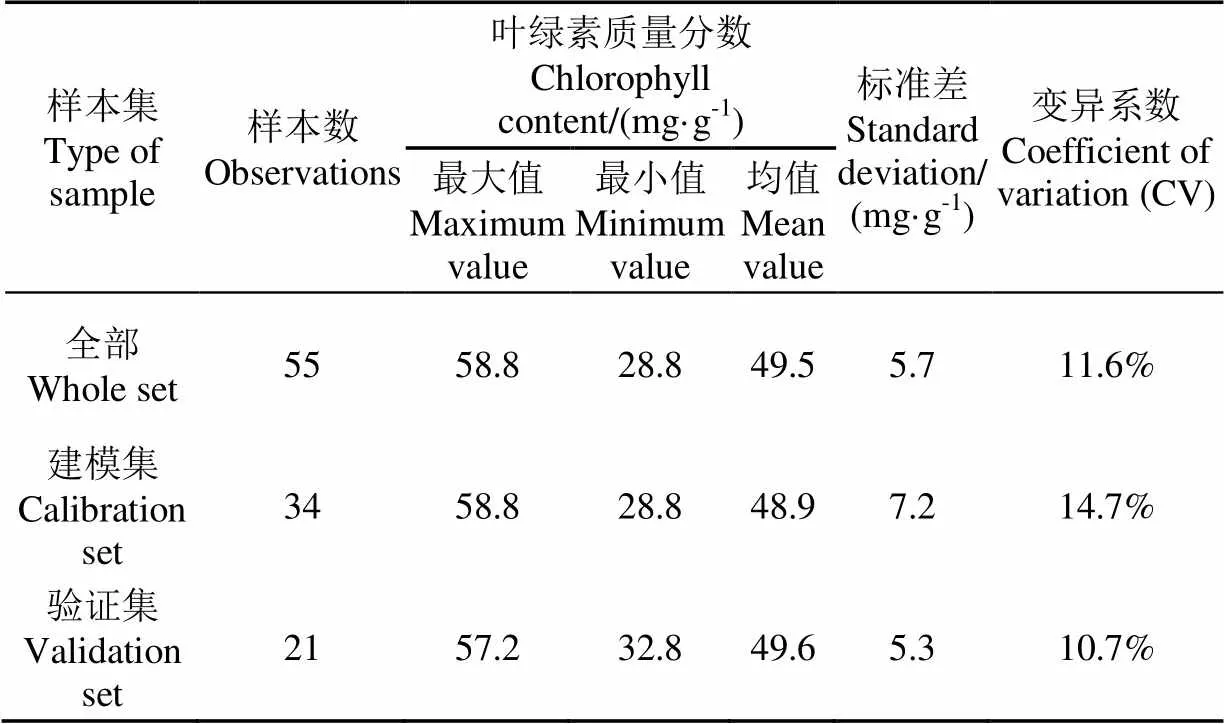
表1 采样区小麦叶绿素含量统计特征
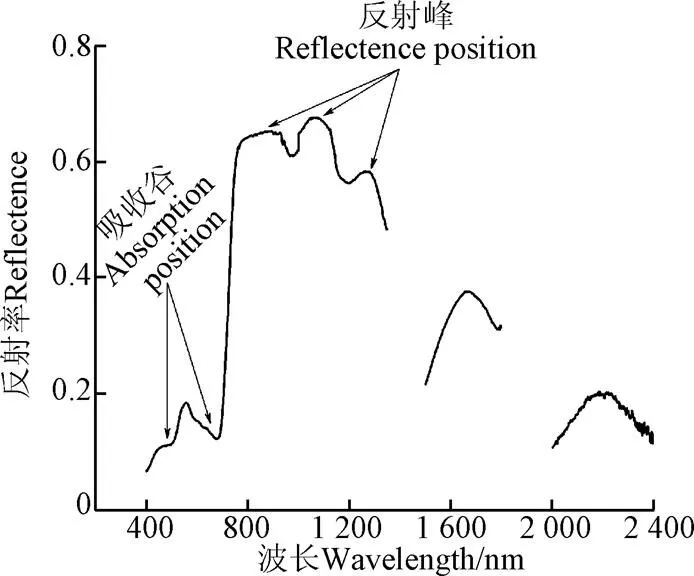
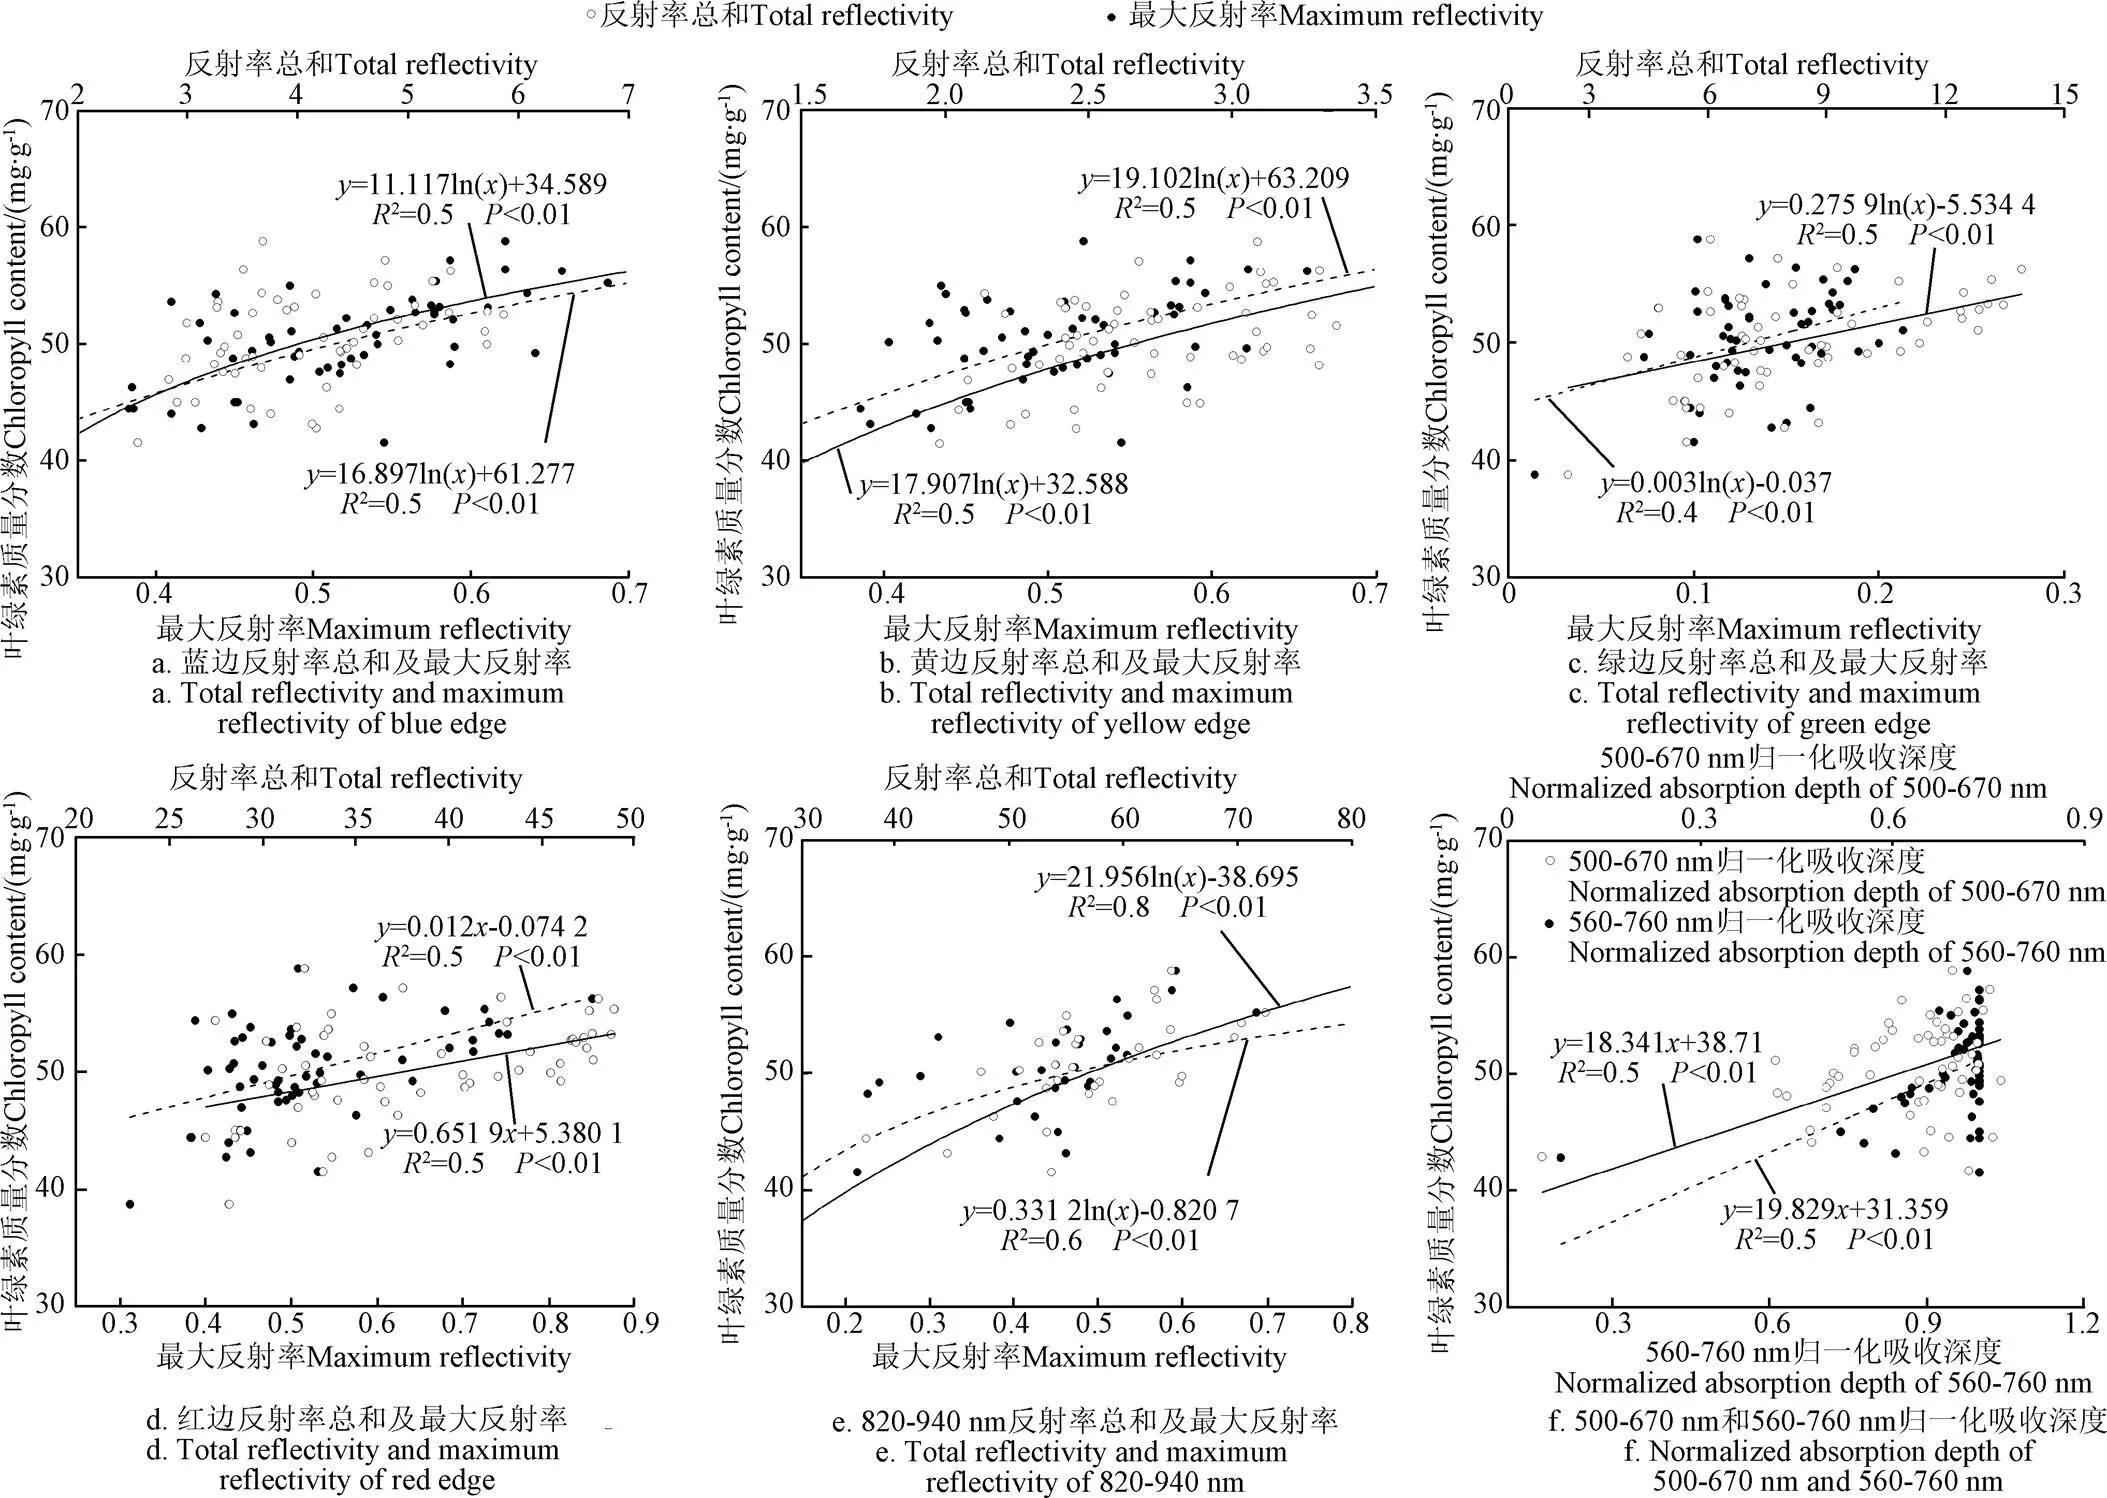
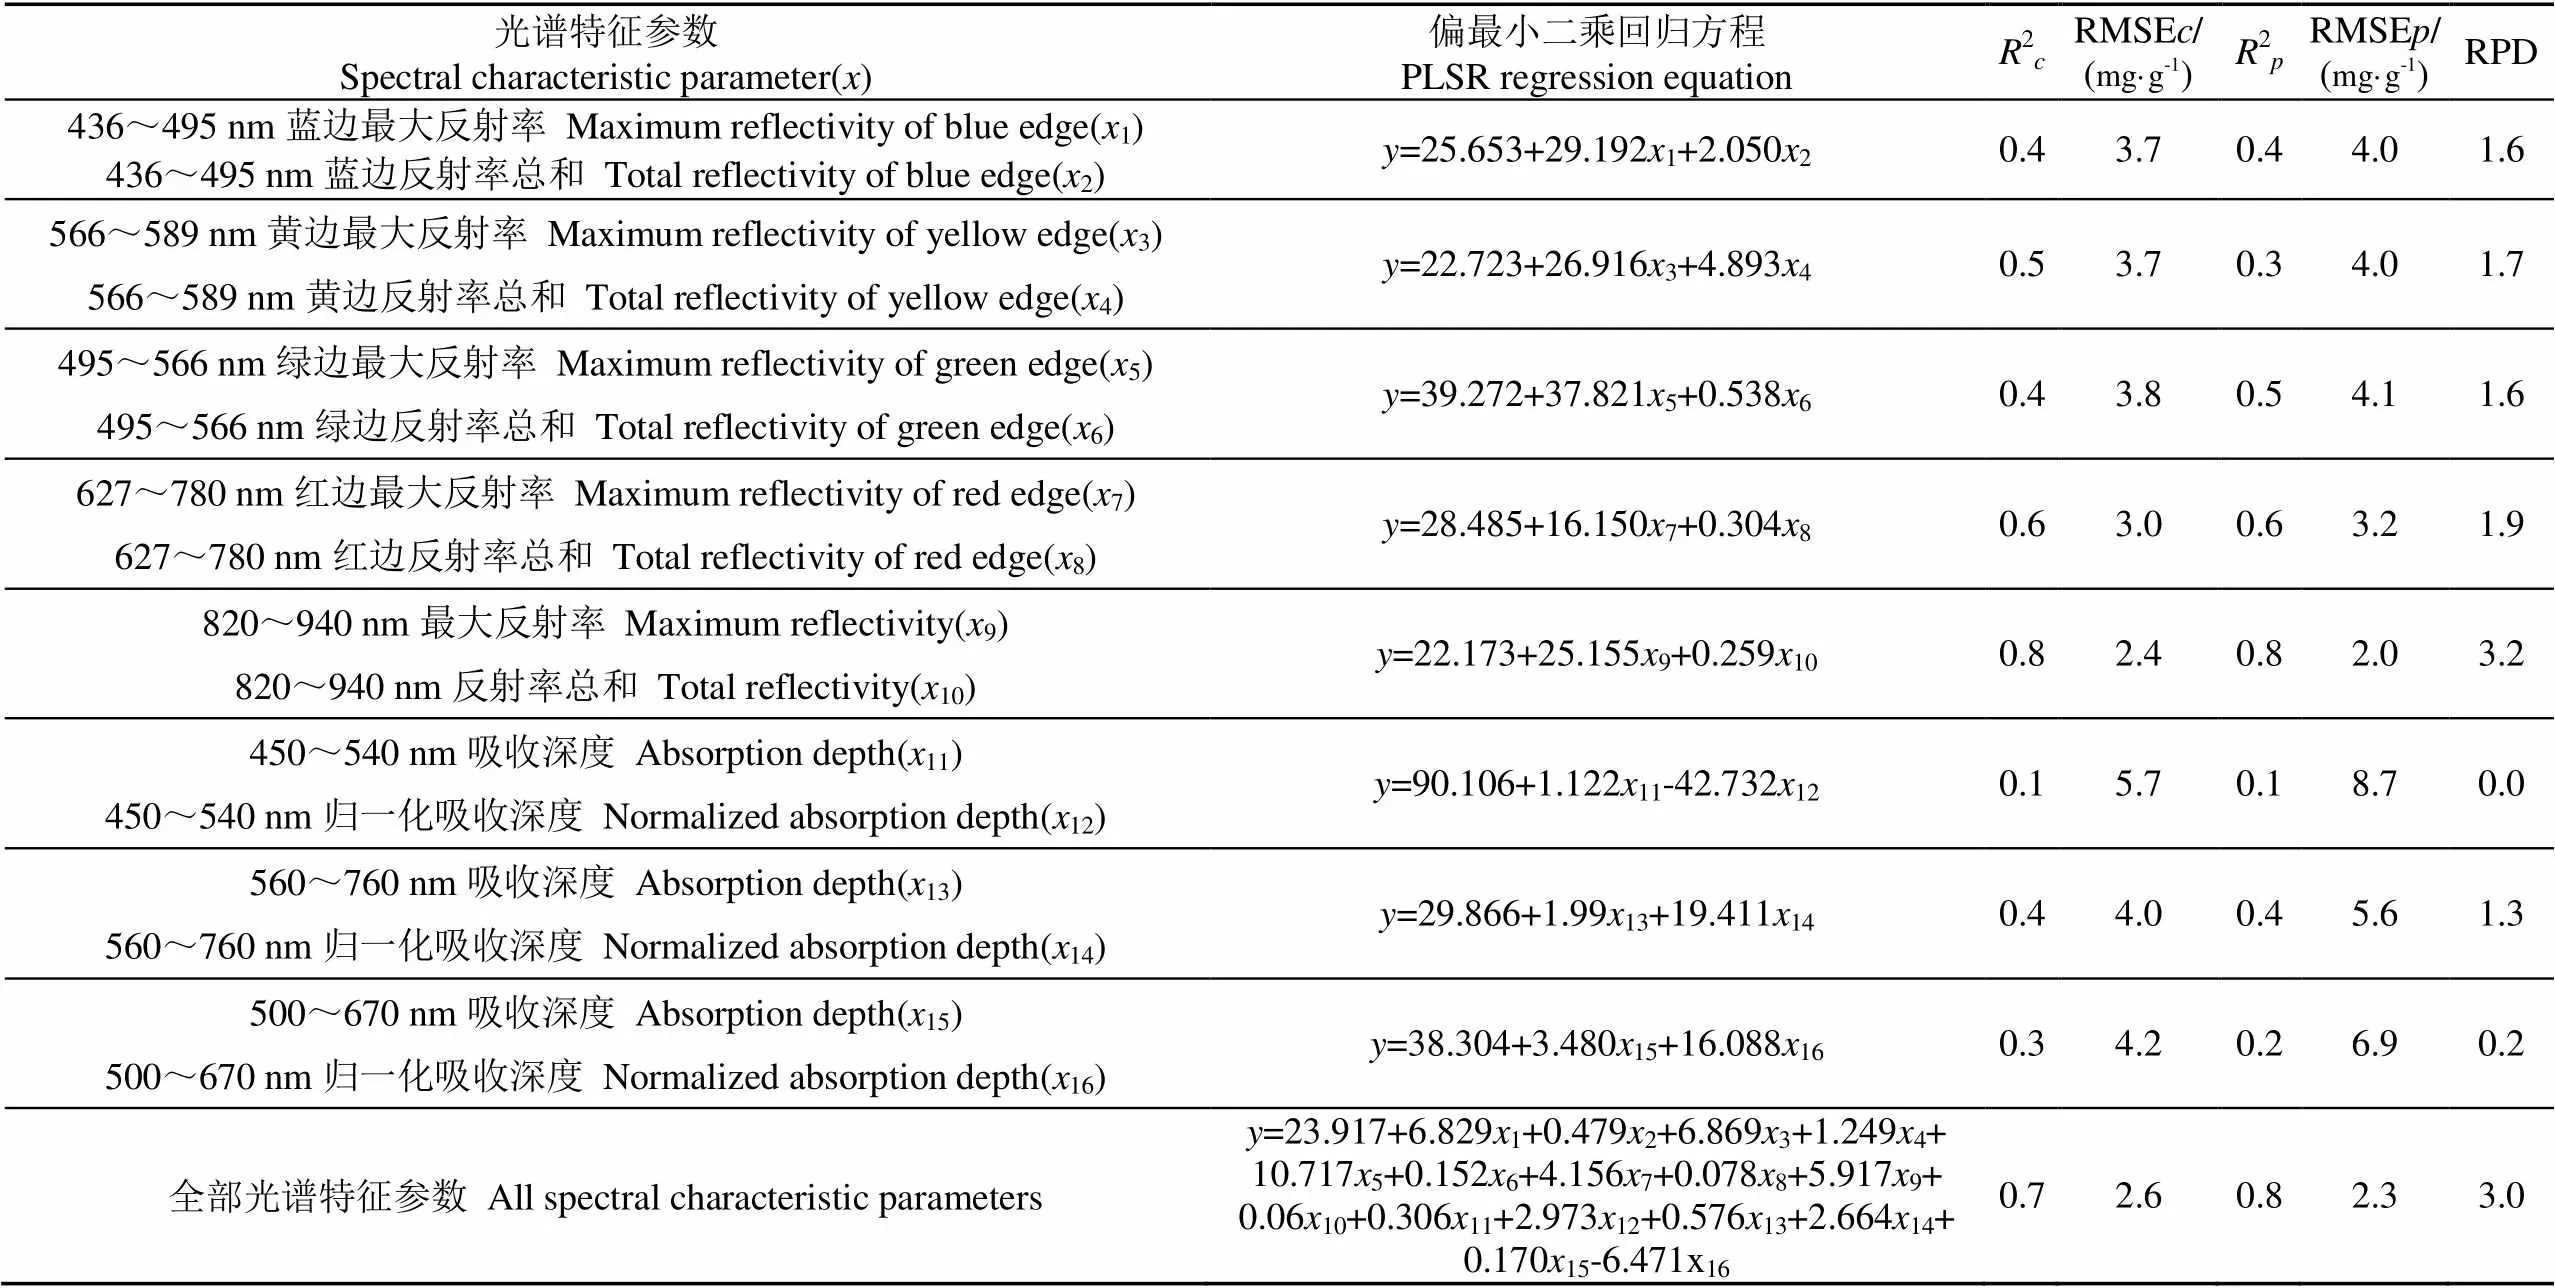
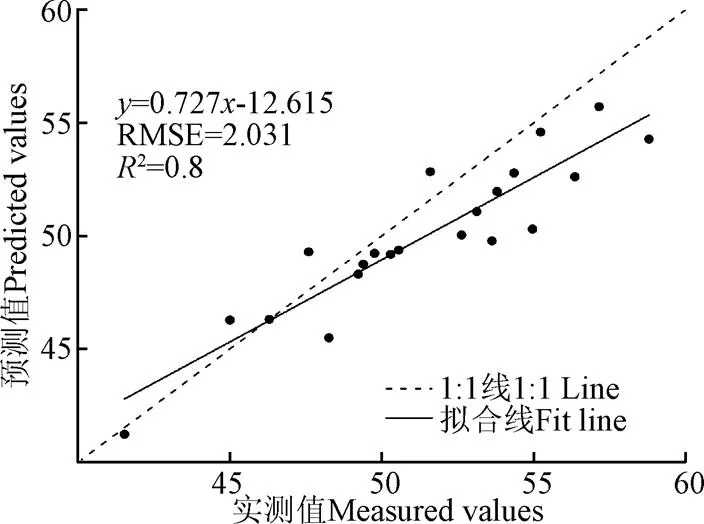
由表1可知,建模集和验证集对应的叶绿素含量最大值分别为58.8和57.2 mg/g,最小值分别为28.8和38.8 mg/g,均值分别为48.9和49.6 mg/g,变异系数分别为14.7%和10.7%;研究区所有采样区叶绿素含量平均值为49.5 mg/g,变异系数为11.6%,介于建模集与验证集之间,数据离散程度不强,属于弱变异强度(0 图2 平滑处理后的春小麦野外光谱反射率 对农作物遥感监测的原理是建立在农作物光谱参数特征基础上,农作物在可见光部分(被叶绿素吸收)有明显的吸收谷,近红外波段受叶片内部的结构以及冠层结构特性共同影响呈现较高的反射率,形成突峰,这些敏感波段及其组合通常称为植被指数,可以反射农作物生长的空间信息[26]。叶绿素含量是小麦重要的赋色成分,其含量高低对小麦反射光谱产生一定的影响[27]。研究区不同叶绿素含量的光谱反射曲线形态基本一致(图2)。图3为春小麦光谱特征曲线,由图3中可知,在可见光波段(400~760 nm)范围内光谱曲线呈快速上升后下降趋势,具有明显的反射峰和吸收谷;在近红波段(760~1 300 nm)范围趋于大幅度上升后呈现下降趋势。就整体而言,除760~800 nm波段范围,不同叶绿素含量小麦的光谱反射率曲线较为容易区分。 光谱特征,既物质在电磁波的相互作用下,在特定波长位置形成反映物质成分和结构信息的光谱吸收和反射特征,用吸收深度、吸收面积以及归一化吸收深度3个参数来描述每个吸收率和反射率的位置[28]。选取春小麦叶片光谱最大反射率、反射率总和、吸收深度和归一化吸收深度的反射光谱特征参数[29](表2);利用偏最小二乘回归法建立叶绿素含量的估算模型。通过对比各模型的校正均方根误差(root mean square error of calibration,RMSE)、建模决定系数2、预测均方根误差(root mean square error of prediction,RMSE)、预测决定系数2、相对分析误差(relative prediction deviation,RPD)筛选出最优模型用以研究区春小麦的叶绿素含量的反演。2用以判定模型的稳定程度,越接近于1说明模型的稳定性越好;RMSE用于表征模型的准确性,其值越小表明模型的精度越高。另外,当RPD小于1.4时,模型不可用;RPD大于等于1.4或小于2时,模型估算效果一般,RPD大于等于2时,模型具有较好的定量预测能力[30]。 图3 春小麦光谱特征曲线 表2 反射光谱特征参数 就绿色植被的光谱特征而言,植被的光谱反射率在700~750 nm波段范围内急剧上升,具有陡而近于直线的形态,其斜率与植物的单位面积叶绿素含量有关[31]。本研究通过对去除边缘波段的全谱数据,在对作物叶片高光谱数据进行平滑去燥、归一化预处理后,选取了蓝边最大反射率及反射率总和、绿边最大反射率及反射率总和、黄边最大反射率及反射率总和、红边最大反射率及反射率总和、吸收谷、反射峰和归一化吸收深度的最大反射率及反射率总和等16种光谱特征参数,并对了抽穗期的春小麦叶片叶绿素含量的相关性进行了初步探讨,尝试性地对叶绿素含量进行光谱建模。相关性检验表明,除了光谱特征参数500~670 nm吸收深度、780~970 nm归一化吸收深度和560~760 nm吸收深度之外,其余均达到(=0.01)显著性水平(图4);其中绿边最大反射率(495~566 nm)与叶绿素质量分数的决定系数最低(2<0.5)(图4c);决定系数较高(2≥0.5)的光谱特征参数包括蓝边最大反射率、蓝边反射率总和(436~495 nm)、黄边最大反射率、黄边反射率总和(566~589 nm)、红边最大反射率、红边反射率总和(627~780 nm)、绿边反射率总和(495~566 nm)、820~940 nm反射率总和及最大反射率、500~670 nm归一化吸收深度和560~760 nm归一化吸收深度;其中820~940 nm反射率总和及最大反射率与叶绿素含量的相关性达到最高,相关系数分别为0.8和0.6(图4e),较其它光谱特征参数而言,该参数更具备反映春小麦叶绿含量变化的能力。 图4 春小麦叶绿素含量与光谱特征参数的关系 本研究以冠层采样春小麦的野外高光谱数据,以春小麦光谱特征参数(最大反射率、反射率总和、吸收深度、归一化吸收深度)为自变量,实测春小麦叶绿素含量为因变量,利用PLSR建立春小麦叶绿素含量估算模型,模型的精度参数(2、RMSE、2、RMSE、RPD)见表3所示。 根据PLSR模型的精度参数,对建立的9个模型进行筛选后发现,RPD大于2的模型只有2个,分别是基于820~940 nm波段范围的最大反射率和反射率总和、全部光谱特征参数为自变量的偏最小二乘回归法(PLSR)建立的模型,其余模型的RPD属于小于2。结合参与PLSR模型的自变量个数来分析,参与个数相同预测模型的精度及稳定性具有一定差异性;随着特征参数的波段范围接近于820~940 nm时,对应的预测模型精度逐渐提高并达到最大值。对模型的2、RMSE、2、RMSE、RPD以及光谱特征参数进行综合对比,发现基于820~940 nm波段范围的最大反射率和反射率总和建立PLSR模型最优,2=0.8、RMSE=2.0 mg/g、RPD=3.2(表3)。基于全部光谱特征参数所建立的预测模型精度参数略低于最优模型,精度参数分别为2=0.7、RMSE=2.6 mg/g、RPD=3.0。综上所述,对16个光谱特征参数偏最小二乘回归发现,光谱特征参数(820~940 nm最大反射率及反射率总和)与春小麦叶绿素含量具有较好的相关性,并达到1%的显著性水平(阈值为±0.34)。利用春小麦叶绿素含量验证数据对模型进行预测能力检验,结果如图5所示。由图5可知,与其它特征参数相比较,基于此特征参数构建的PLSR模型,表现了最好的预测能力。 表3 不同光谱特征参数反演叶绿素含量的PLSR模型 图5 春小麦叶绿素含量估算模型的验证 叶绿素是光合作用中最重要的有机分子,其浓度对农作物的生长过程中影响最为明显[32]。且作物叶片中氮素的合成也与叶绿素内部结构有一定的联系,通过叶绿素含量可以有效的估算作物营养及生理状态[33-35]。植物营养状况与其光谱特性密切相关,尤其针对大田作物的相关研究一直是精准农业的研究热点问题[36-39]。光谱反射率随着作物叶绿素含量的不同,呈现不同光谱响应[40]。而对于具有丰富信息的高光谱数据来讲,仅利用单个波段反射率所建立的光谱指数可能无法充分利用光谱数据,并在一定程度上制约反演模型的精度[41]。基于此,本研究不单利用光谱指数中的单个波段反射率,而且考虑了去除边缘波段的全谱数据,在对作物叶片高光谱数据进行平滑去燥、归一化预处理后,选取了红边、黄边、蓝边、绿边、吸收谷和反射峰的最大反射率及反射率总和等16种光谱特征参数对抽穗期的春小麦叶片叶绿素含量的相关性进行了初步探讨,并尝试性地对叶绿素含量进行光谱建模。 本研究以小型系统性试验田为研究靶区,在获得作物叶片叶绿素含量及对应的光谱数据之后,将16种光谱特征参数两两组合并利用偏最小二乘回归法对春小麦叶绿素含量进行定量估算。在利用436~780 nm波长范围内的14个光谱特征参数建模过程中发现,通过500~670nm吸收深度及归一化吸收深度建立的模型无法对叶绿素含量进行有效估算(RPD=0.2、2=0.3、2=0.2,RMSE=4.2 mg/g、RMSE=6.9 mg/g),通过627~780 nm红边最大反射率及反射率总和建立的模型表现最优(RPD=1.9、2=0.6、2=0.6,RMSE=3.0 mg/g、RMSE=3.2 mg/g);而利用820~940 nm波长范围内的2个光谱参数建立的模型的RPD达到了3.2,此外RMSE、RMSE较可见光及红边特征参数分别降低了1.8和4.9 mg/g,2、2则提高至0.8。利用全部光谱特征参数对叶片叶绿素含量建模发现,所建立的模型精度(RPD=3.0、2=0.7、2=0.8、RMSE=2.6 mg/g、RMSE=2.3 mg/g)较上述模型(500~670 nm、627~780 nm波段范围的特征参数)比较高;而对与上述820~940 nm波段范围的模型而言,模型的稳定性具有一定差异。因此说明,利用全部光谱参数中可能存在对叶片叶绿素含量敏感程度不显著的波段,导致对模型精度及稳健性产生一定影响。 已有大量研究利用多种光谱特征指数结合实测叶绿素含量进行光谱定量估算[42]。Zarco-Tejada等[43]学者结合转化叶绿素吸收反射指数(TCARI)及优化土壤调节植被指数(OSAVI)作为估算叶绿素含量的最有效光谱指标,模型精度为(2=0.67,RMSE=11.5g/cm2)。王晓星等[44]利用高光谱数据并对原始光谱反射率及其一阶导数光谱与叶绿素相对含量进行了相关分析,建立了基于敏感波段、红边位置(690~750 nm)、原始及一阶导数的光谱峰度和偏度等参数的叶绿素估算模型。研究结果冬小麦冠层光谱曲线特征与叶绿素含量之间有着密切联系,基于原始光谱一阶导数偏度和峰度的冬小麦(抽穗期)叶绿素含量估算模型拟合精度最优,模型精度2达到了0.8。梁亮等[45]通过分析18种高光谱指数对春小麦(拔节后至孕穗前)叶绿素的预测能力,筛选出可敏感表征叶绿素含量的指数REP670~780 nm,利用最小二乘支持向量回归(least squares support vector regression,LS-SVR)算法建立了小麦冠层叶绿素含量反演模型,其模型校正决定系数2与预测决定系数2分别为0.751与0.722。作物在750~1300 nm波段范围具有强烈的反射响应[46]。本研究所利用的波段范围(820~940 nm)与前人结论基本一致,且模型的精度有了一定的提高,并达到了叶绿素含量高光谱估算精度要求(RPD≥2.0)。此外,在选取光谱特征参数时,本研究在436~940 nm波长范围内选取了16种特征参数,不仅仅考虑了单个波段反射率对应光谱指数可能未完全反映高光谱信息,结合考虑整个波段范围的光谱数据,在一定程度上减少有效光谱信息的损失并丰富了特征参数的波长选取范围。 本研究利用小型系统性试验田内抽穗期的春小麦叶片实测叶绿素含量及其对应的光谱数据进行定量估算。但由于抽穗期持续时间较短,本研究采样样本的数量也相对有限,所建立的叶绿素含量高光谱估算模型的稳健性及普适性有待进一步完善。因此,后续研究将进一步扩大播种面积及样本数量,并针对分蘖期、拔节期、孕穗期、抽穗期、成熟期等春小麦重要生育期进行进一步的细化研究,完善春小麦叶片高光谱数据库,以便于今后提高模型的准确性和普适性。 本研究以新疆大学阜康实验基地的春小麦为研究对象,利用55个冠层采样区的野外高光谱数据,并结合实测春小麦抽穗期叶绿素含量,分析春小麦抽穗期光谱特征参数进行偏最小二乘回归(partial least-squares regression,PLSR)建模。得出了以下结论: 1)对特定的16个光谱特征参数而言,绿边最大反射率(495~566 nm)与叶绿素质量分数的决定系数最低(2<0.5);决定系数较高(2≥0.5);相关性系数较高(2≥0.5)的光谱特征参数包括蓝边最大反射率、蓝边反射率总和(436~495 nm)、黄边最大反射率、黄边反射率总和(566~589 nm)、红边最大反射率、红边反射率总和(627~780 nm)、绿边反射率总和(495~566 nm)、820~940 nm反射率总和及最大反射率、500~670 nm归一化吸收深度和560~760 nm归一化吸收深度;其中820~940 nm反射率总和与叶绿素含量的相关性达到最高,决定系数2为0.8。 2)利用16个特征参量进行PLSR建模,发现波段范围在820~940 nm的最大反射率及反射率总和所建立的PLSR估算模型为最优模型,精度参数分别为2=0.8、RMSE=2.0mg/g、RPD=3.2,减少了其他特征参数对模型精度的影响。该模型表现了极好的预测能力,为相关研究及当地精准农业提供科学支持和应用参考。 [1] Filella I, Penuelas J. The red edge position and shape as indicators of plant chlorophyll content, biomass and hydric status[J]. International Journal of Remote Sensing, 1994, 15(7): 1459-1470. [2] 李粉玲,常庆瑞. 基于连续统去除法的冬小麦叶片全氮含量估算[J]. 农业机械学报,2017,48(7):174-179. Li Fenling, Chang Qingrui. Estimation of winter wheat leaf nitrogen content based on continuum removed spectra[J]. Transactions of the Chinese Society for Agricultural Machinery, 2017, 48(7): 174-179. (in Chinese with English abstract) [3] 孙红,李民赞,赵勇,等. 冬小麦生长期光谱变化特征与叶绿素含量监测研究[J]. 光谱学与光谱分析,2010,30(1):192-196. Sun Hong, Li Minzan, Zhao Yong, et al. The spectral characteristics and chlorophyll content at winter wheat growth stages[J]. Spectroscopy and Spectral Analysis, 2010, 30(1): 192-196. (in Chinese with English abstract) [4] 姚云军,秦其明,张自力,等. 高光谱技术在农业遥感中的应用研究进展[J]. 农业工程学报,2008,24(7):301-306. Yao Yunjun, Qin qiming, Zhang Zili, et al. Research progress of hyperspectral technology applied in agricultural remote sensing[J]. Transactions of the Chinese Society of Agricultural Engineering (Transactions of the CSAE), 2008, 24(7): 301-306. (in Chinese with English abstract) [5] 杨建昌,杜永,刘辉. 长江下游稻麦周年超-高产栽培途径与技术[J]. 中国农业科学,2008,41(6):1611-1621. Yang Jianchang, Du Yong, Liu Hui. Cultivation approaches and techniques for annual super-high-yielding of rice and wheat in the lower reaches of Yangtze River[J]. China Agriculture Science, 2008, 41(6): 1611-1621. (in Chinese with English abstract) [6] 林鸿宣,钱惠荣,熊振民,等. 几个水稻品种抽穗期主效基因与微效基因的定位研究[J]. 遗传学报,996(3):205-213. Lin Hongxuan, Qian Huirong, Xiong Zhenmin, et al. Mapping of major genes and minor genes for heading date in several rice varieties[J]. Journal of Geneticss & Sgenomics, 996(3): 205-213. (in Chinese with English abstract) [7] 茹京娜,于洋,董凡凡,等. 小麦抽穗期QTL及其与环境的互作[J]. 麦类作物学报,2014,34(9):1185-1190. Ru Jingna, Yu Yang, Dong Fanfan, et al. Analysis of QTL for heading date and interaction effects with environments in wheat[J]. Journal of Triticeae Crops, 2014, 34(9): 1185-1190. (in Chinese with English abstract) [8] Yuan Z, Ata-Ul-Karim S T, Cao Q, et al. Indicators for diagnosing nitrogen status of rice based on chlorophyll meter readings[J]. Field Crops Research, 2016, 185: 12-20. [9] 姚付启,蔡焕杰,王海江,等. 冬小麦冠层高光谱特征与覆盖度相关性研究[J]. 农业机械学报,2012,43(7):156-162. Yao Fuqi, Cai Huanjie, Wang Haijiang, et al. Correlation between percentage vegetation cover and hyperspectral characteristics of winter wheat[J]. Transaction of Chinese society for Agriculture Machinery, 2012, 43(7): 156-162. (in Chinese with English abstract) [10] Blackburn G A. Relationships between spectral reflectance and pigment concentrations in stacks of deciduous broadleaves[J]. Remote Sensing of Environment, 1999, 70(2): 224-237. [11] Zhao D, Huang L, Li J, et al. A comparative analysis of broadband and narrowband derived vegetation indices in predicting LAI and CCD of a cotton canopy[J]. ISPRS Journal of Photogrammetry & Remote Sensing, 2007, 62(1): 25-33. [12] Alabbas A H, Barr R, Hall J D, et al. Spectra of normal and nutrient-deficient maize leaves[J]. Agronomy Journal, 1974, 37(9): 3693-3700. [13] Hinzman L D, Bauer M E, Cst D. Effects of nitrogen fertilization on growth and reflectance characteristics of winter wheat[J]. Remote Sensing of Environment, 1986, 19(1): 47-61. [14] Bell G E, Howell B M, Johnson G V, et al. Optical sensing of turfgrass chlorophyll content and tissue nitrogen[J]. Hortscience, 2004, 39(5): 1130-1132. [15] Min M, Lee W S, Kim Y H, et al. Nondestructive detection of nitrogen in Chinese cabbage leaves using VIS-NIR spectroscopy[J]. Hortscience A Publication of the American Society for Horticultural Science, 2006, 41(1): 162-166. [16] Campbell P K, Middleton E M, Mcmurtrey J E, et al. Assessment of vegetation stress using reflectance or fluorescence measurements[J]. Journal of Environmental Quality, 2007, 36(3): 832. [17] Bannari A, Khurshid K S, Staenz K, et al. A comparison of hyperspectral chlorophyll indices for wheat crop chlorophyll content estimation using laboratory reflectance measurements[J]. IEEE Transactions on Geoscience & Remote Sensing, 2007, 45(10): 3063-3074. [18] Daughtry C S T, Walthall C L, Kim M S, et al. Estimating corn leaf chlorophyll concentration from leaf and canopy reflectance[J]. Remote Sensing of Environment, 2000, 74(2): 229-239. [19] Curran P J, Dungan J L, Gholz H L. Exploring the relationship between reflectance red edge and chlorophyll content in slash pine[J]. Tree Physiology, 1991, 7(1/2/3/4): 33-48. [20] 郭燕,程永政,黎世民,等. 区域尺度冬小麦叶绿素含量的高光谱预测和空间变异研究[J]. 麦类作物学报,2017,37(7):970-977. Guo Yan, Cheng Yongzheng, Li Shimin, et al. Hyperspectral- based estimation and spatial variability of chlorophyll contenteof winter wheat in regional scale[J]. Journal of Triticeae Crops, 2017, 37(7): 970-977. (in Chinese with English abstract) [21] 黄慧,王伟,彭彦昆,等. 利用高光谱扫描技术检测小麦叶片叶绿素含量[J]. 光谱学与光谱分析,2010,30(7):1811-1814. Huang Hui, Wang Wei, Peng Yankun, et al. Measurement of chlorophyll content in wheat leaves using hyperspectral scanning[J]. Spectroscopy and Spectral Analysis, 2010, 30(7): 1811-1814. (in Chinese with English abstract) [22] 罗丹,常庆瑞,齐雁冰,等. 基于光谱指数的冬小麦冠层叶绿素含量估算模型研究[J]. 麦类作物学报,2016,36(9):1225-1233. Luo Dan, Chang Qirui, Qi Yanbing, et al. Estimation model for chloropyll content in winter wheat canopy based on spectral indices[J]. Journal of Triticeae Crops, 2016, 36(9): 1225-1233. (in Chinese with English abstract) [23] 曾庆敏,刘新平. 天山北坡经济带宜耕未利用地开发潜力分区及评价:以新疆阜康市为例[J]. 中国生态农业学报,2016,24(6):819-828. Zeng Qingmin, Liu Xinping. Evaluation of potential unused land exploitation in northern tianshan mountain economic belt:A case study of fukang city[J]. Chinese Journal of Eco-Agriculture, 2016, 24(6): 819-828. (in Chinese with English abstract) [24] 张超,孙林,韩留生,等. 新疆阜康地区径流及植被覆盖变化研究[J]. 测绘地理信息,2016,41(3):79-81. Zhang Chao, Sun Lin, Han Liusheng, et al. Runoff and vegetation cover change in Xinjiang Fukang[J]. Journal of Geomatics, 2016, 41(3): 79-81. (in Chinese with English abstract) [25] Wang J, Tiyip T, Ding J, et al. Desert soil clay content estimation using reflectance spectroscopy preprocessed by fractional derivative[J]. PloS One, 2017, 12(9): e0184836. [26] 李卫国. 农作物遥感监测方法与应用[M]. 中国农业科学技术出版社,2013. Li Weiguo. Methods and applications of crop remote sensing monitoring[M]. China Agricultural Science and Technology Press, 2013. [27] 程萌,张俊逸,李民赞,等. 用于微小型光谱仪的冬小麦抽穗期叶绿素含量诊断模型[J]. 农业工程学报,2017,33(增刊1):157-163. Cheng Meng, Zhang Junyi, Li Minzan, et al. Chlorophyll content diagnosis model of winter wheat at heading stage applied in miniature spectrometer[J]. Transactions of the Chinese Society of Agricultural Engineering (Transactions of the CSAE), 2017, 33(Supp.1): 157-163. (in Chinese with English abstract) [28] Li X, Zhang Y, Bao Y, et al. Exploring the best hyperspectral features for LAI estimation using partial least squares regression[J]. Remote Sensing, 2014, 6(7): 6221-6241. [29] 覃昌伟. 农业遥感技术[M]. 北京:中国农业出版社,2017,8-9. [30] Zhou S, Wang Q L, Jie P, et al. Development of a national VNIR soil-spectral library for soil classification and prediction of organic matter concentrations[J]. Science China: Earth Science, 2014, 57(7): 1671-1680. [31] Blackburn G A. Hyperspectral remote sensing of plant pigments[J]. Journal of Experimental Botany, 2007, 58(4): 855. [32] Yang F, Li J L, Gan X Y, et al. Assessing nutritional status of Festuca arundinacea by monitoring photosynthetic pigments from hyperspectral data[J]. Computers & Electronics in Agriculture, 2010, 70(1): 52-59. [33] Moran J A, Mitchell A K, Goodmanson G, et al. Differentiation among effects of nitrogen fertilization treatments on conifer seedlings by foliar reflectance: A comparison of methods[J]. Tree Physiology, 2000, 20(16): 1113. [34] Zhao D, Huang L, Li J, et al. A comparative analysis of broadband and narrowband derived vegetation indices in predicting LAI and CCD of a cotton canopy[J]. Isprs Journal of Photogrammetry & Remote Sensing, 2007, 62(1): 25-33. [35] 周冬琴,朱艳,杨杰,等. 基于冠层高光谱参数的水稻叶片碳氮比监测[J]. 农业工程学报,2009,25(3):135-141. Zhou Dongqin, Zhu Yan, Yang Jie, et al. C/N content ratio of rice leaf monitoring based on canopy hyperspectral parameters[J]. Transactions of the Chinese Society of Agricultural Engineering (Transactions of the CSAE), 2009, 25(3): 135-141. (in Chinese with English abstract) [36] Li F, Gnyp M L, Jia L, et al. Estimating N status of winter wheat using a handheld spectrometer in the North China Plain[J]. Field Crops Research, 2008, 106(1): 77-85. [37] 李卫国,王纪华,李存军,等. 冬小麦花期生理形态指标与卫星遥感光谱特征的相关性分析[J]. 麦类作物学报,2009,29(1):79-82. Li Weiguo, Wang Jihua, Li Cunjun, et al. Correlation relationship between satellite remote sensing spectral information and eco-physiology indexes of winter wheat at flowering period[J]. Journal of Triticeae Crops, 2009, 29(1): 79-82. (in Chinese with English abstract) [38] 卢艳丽,白由路,王磊,等. 黑土土壤中全氮含量的高光谱预测分析[J]. 农业工程学报,2010,26(1):256-261. Lu Yanli, Bai Youlu, Wang Lei, et al. Determination for total nitrogen content in black soil using hyperspectral data[J]. Transactions of the Chinese Society of Agricultural Engineering (Transactions of the CSAE), 2010, 26(1): 256-261. (in Chinese with English abstract) [39] 孙红,李民赞,张彦娥,等. 不同施氮水平下玉米冠层光谱反射特征分析[J]. 光谱学与光谱分析,2010,30(3):715-719. Sun Hong, Li Minzan, Zhang Yane, et al. Spectral characteristics of corn under different nitrogen treatments[J]. Spectroscopy and Spectral Analysis, 2010, 30(3): 715-719. (in Chinese with English abstract) [40] 姚付启,张振华,杨润亚,等. 基于红边参数的植被叶绿素含量高光谱估算模型[J]. 农业工程学报,2009,25(13):123-129. Yao Fuqi, Zhang Zhenhua, Yang Runya, et al. Hyperspectral models for estimating vegetation chlorophyll content based on red edge parameter[J]. Transactions of the Chinese Society of Agricultural Engineering (Transactions of the CSAE), 2009, 25(13): 123-129. (in Chinese with English abstract) [41] 王敬哲,塔西甫拉提·特依拜,丁建丽,等. 基于分数阶微分预处理高光谱数据的荒漠土壤有机碳含量估算[J]. 农业工程学报,2016,32(21):161-169. Wang Jingzhe, Tashpolat·Tiyip, Ding Jianli, et al. Estimation of desert soil organic carbon content based on hyperspectral data preprocessing with fractional differential[J]. Transactions of the Chinese Society of Agricultural Engineering (Transactions of the CSAE), 2016, 32(21): 161-169. (in Chinese with English abstract) [42] 姜海玲,杨杭,陈小平,等. 利用光谱指数反演植被叶绿素含量的精度及稳定性研究[J]. 光谱学与光谱分析,2015,35(4):975-981. Jiang Hailing, Yang Hang, Chen Xiaoping, et al. Research on accuracy and stability if inversing vegetation chlorophyll content by spectral index method[J]. Spectroscopy and Spectral Analysis, 2015, 35(4): 975-981. (in Chinese with English abstract) [43] Zarco-Tejada P J, Berjón A, López-Lozano R, et al. Assessing vineyard condition with hyperspectral indices: Leaf and canopy reflectance simulation in a row-structured discontinuous canopy[J]. Remote Sensing of Environment, 2005, 99(3): 271-287. [44] 王晓星,常庆瑞,刘梦云,等. 冬小麦冠层水平叶绿素含量的高光谱估测[J]. 西北农林科技大学学报:自然科学版,2016,44(2):48-54. Wang Xiaoxing, Chang Qingrui, Liu Mengyun, et al. Hyperspectral estimation of chlorophyll content in canopy of winter wheat[J]. Journal of Northwest A&F University: Natural Science Edition, 2016, 44(2): 48-54. (in Chinese with English abstract) [45] 梁亮,杨敏华,张连蓬,等. 基于SVR算法的小麦冠层叶绿素含量高光谱反演[J]. 农业工程学报,2012,28(20):162-171. Liang Liang, Yang Minhua, Zhang Lianpeng, et al. Chlorophyll content inversion with hyperspectral technology for wheat canopy based on support vector regression algorithm[J]. Transactions of the Chinese Society of Agricultural Engineering (Transactions of the CSAE), 2012, 28(20): 162-171. (in Chinese with English abstract) [46] 马淏. 光谱及高光谱成像技术在作物特征信息提取中的应用研究[D]. 北京:中国农业大学,2015. Ma Hao. Application of Spectral and Hyperspectral Imaging Technology in Crop Characteristic Information Extraction[D]. Beijing: China Agricultural University, 2015. (in Chinese with English abstract) 尼加提·卡斯木,师庆东,王敬哲,茹克亚·萨吾提,依力亚斯江·努尔麦麦提,古丽努尔·依沙克. 基于高光谱特征和偏最小二乘法的春小麦叶绿素含量估算[J]. 农业工程学报,2017,33(22):208-216. doi:10.11975/j.issn.1002-6819.2017.22.027 http://www.tcsae.org Nijat Kasim, Shi Qingdong, Wang Jingzhe, Rukeya Sawut, Ilyas Nurmemet, Gulnur Isak. Estimation of spring wheat chlorophyll content based on hyperspectral features and PLSR model[J]. Transactions of the Chinese Society of Agricultural Engineering (Transactions of the CSAE), 2017, 33(22): 208-216. (in Chinese with English abstract) doi:10.11975/j.issn.1002-6819.2017.22.027 http://www.tcsae.org Estimation of spring wheat chlorophyll content based on hyperspectral features and PLSR model Nijat Kasim1,2, Shi Qingdong1,2※, Wang Jingzhe1,2, Rukeya Sawut1,2, Ilyas Nurmemet1,2, Gulnur Isak1,2 (1.830046;2.830046) Chlorophyll content is one of the major factors that affect crop growth and crop output, and an important parameter to monitor the stresses and health status of vegetation. Currently the spectral feature parameter is one of the methods that have been widely applied to estimate the chlorophyll content of wheat. In order to provide scientific basis for wheat growth monitoring and agronomic decision-making, the spring wheat canopy chlorophyll content was estimated by using hyper-spectral technology (spectral feature parameters) in this paper. The correlation between hyper-spectral characteristic parameters and chlorophyll content of spring wheat (heading date) was analyzed, and the models for estimating chlorophyll content were established based on spectral feature parameters using partial least squares regression (PLSR) method. Data of chlorophyll content and spectral reflectance of spring wheat were obtained from the experimental plots at Ziniquanzi Town, Fukang City, Xinjiang Uighur Autonomous Region, China in June, 2017. The canopy spectral reflectance and chlorophyll content of spring wheat were measured in the experimental plots. After removing the marginal bands (350-400 and 2 401-2 500 nm) and being smoothed by Savitzky-Golay filter, 16 types of hyper-spectral characteristic parameters (such as red edge, blue edge, green edge, total reflectivity, absorption depth, and normalized absorption depth) were derived from the raw hyper-spectral reflectance data. Thereafter, PLSR was employed to build the hyper-spectral estimation models of chlorophyll content. Next, root mean square error (RMSEand RMSE) and determination coefficient (2and2) for calibration set and prediction set and relative prediction deviation (RPD) were used for accuracy assessment. The results showed that: 1) Among the selected spectral feature parameters, correlation coefficient between the maximum reflectivity of green edge and chlorophyll content of spring wheat is lower than 0.5. Spectral characteristic parameters that have the higher correlation coefficient (2≥0.5) include maximum reflectivity of blue edge, total reflectivity of blue edge (436-495 nm), maximum reflectivity of yellow edge, total reflectivity of yellow edge (566-589 nm), maximum reflectivity of red edge, total reflectivity of red edge (627-780 nm), total reflectivity of green edge (495-566 nm), maximum reflectivity and total reflectivity within 820-940 nm, normalized absorption depth in 560-670 nm and 560-760 nm. The spectral feature parameters which have the highest correlation coefficient with the chlorophyll content are maximum reflectivity and total reflectivity within 820-940 nm, which reach 0.6 and 0.8, respectively. 2) On the 16 characteristic parameters of PLSR regression, the characteristic parameters (the maximum and sum of reflectance in 820-940 nm) have made a great contribution to the PLSR model, reduce the influence of other parameters on the accuracy of the model, have better performance in predicting chlorophyll content in the study area (2=0.8, RMSE=2.3, RPD=3.0), and provide scientific support and reference for other related local research and precision agriculture. To achieve more universal and stable inversion model, the next step is to enlarge the sampling area and the number of samples as much as possible to improve and perfect the spring wheat hyper-spectral database. model; chlorophyll; spectral analysis; hyper-spectral; spectral feature parameter; PLSR 10.11975/j.issn.1002-6819.2017.22.027 O657.43; S431.9 A 1002-6819(2017)-22-0208-09 2017-08-03 2017-11-09 国家自然科学基金(U170320066、41671348) 尼加提•卡斯木,男,维吾尔族,新疆伊宁人,博士生,主要研究方向为生态规划与管理。Email:NejatKasim@126.com 师庆东,男,汉族,教授,博士生导师,主要研究方向为绿洲生态学。Email:shiqingdong@126.com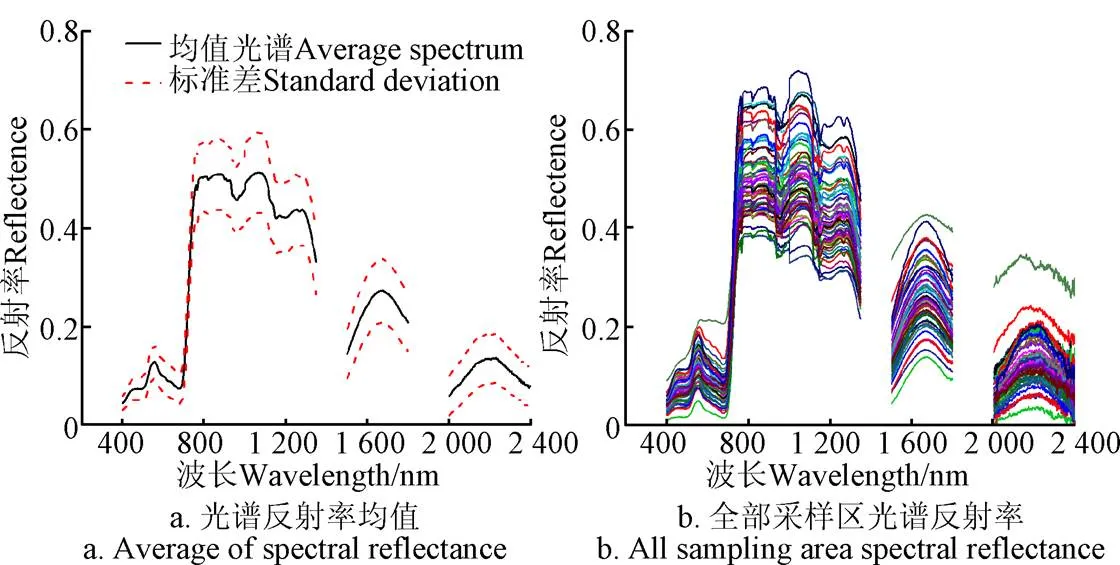
1.4 光谱参数建模
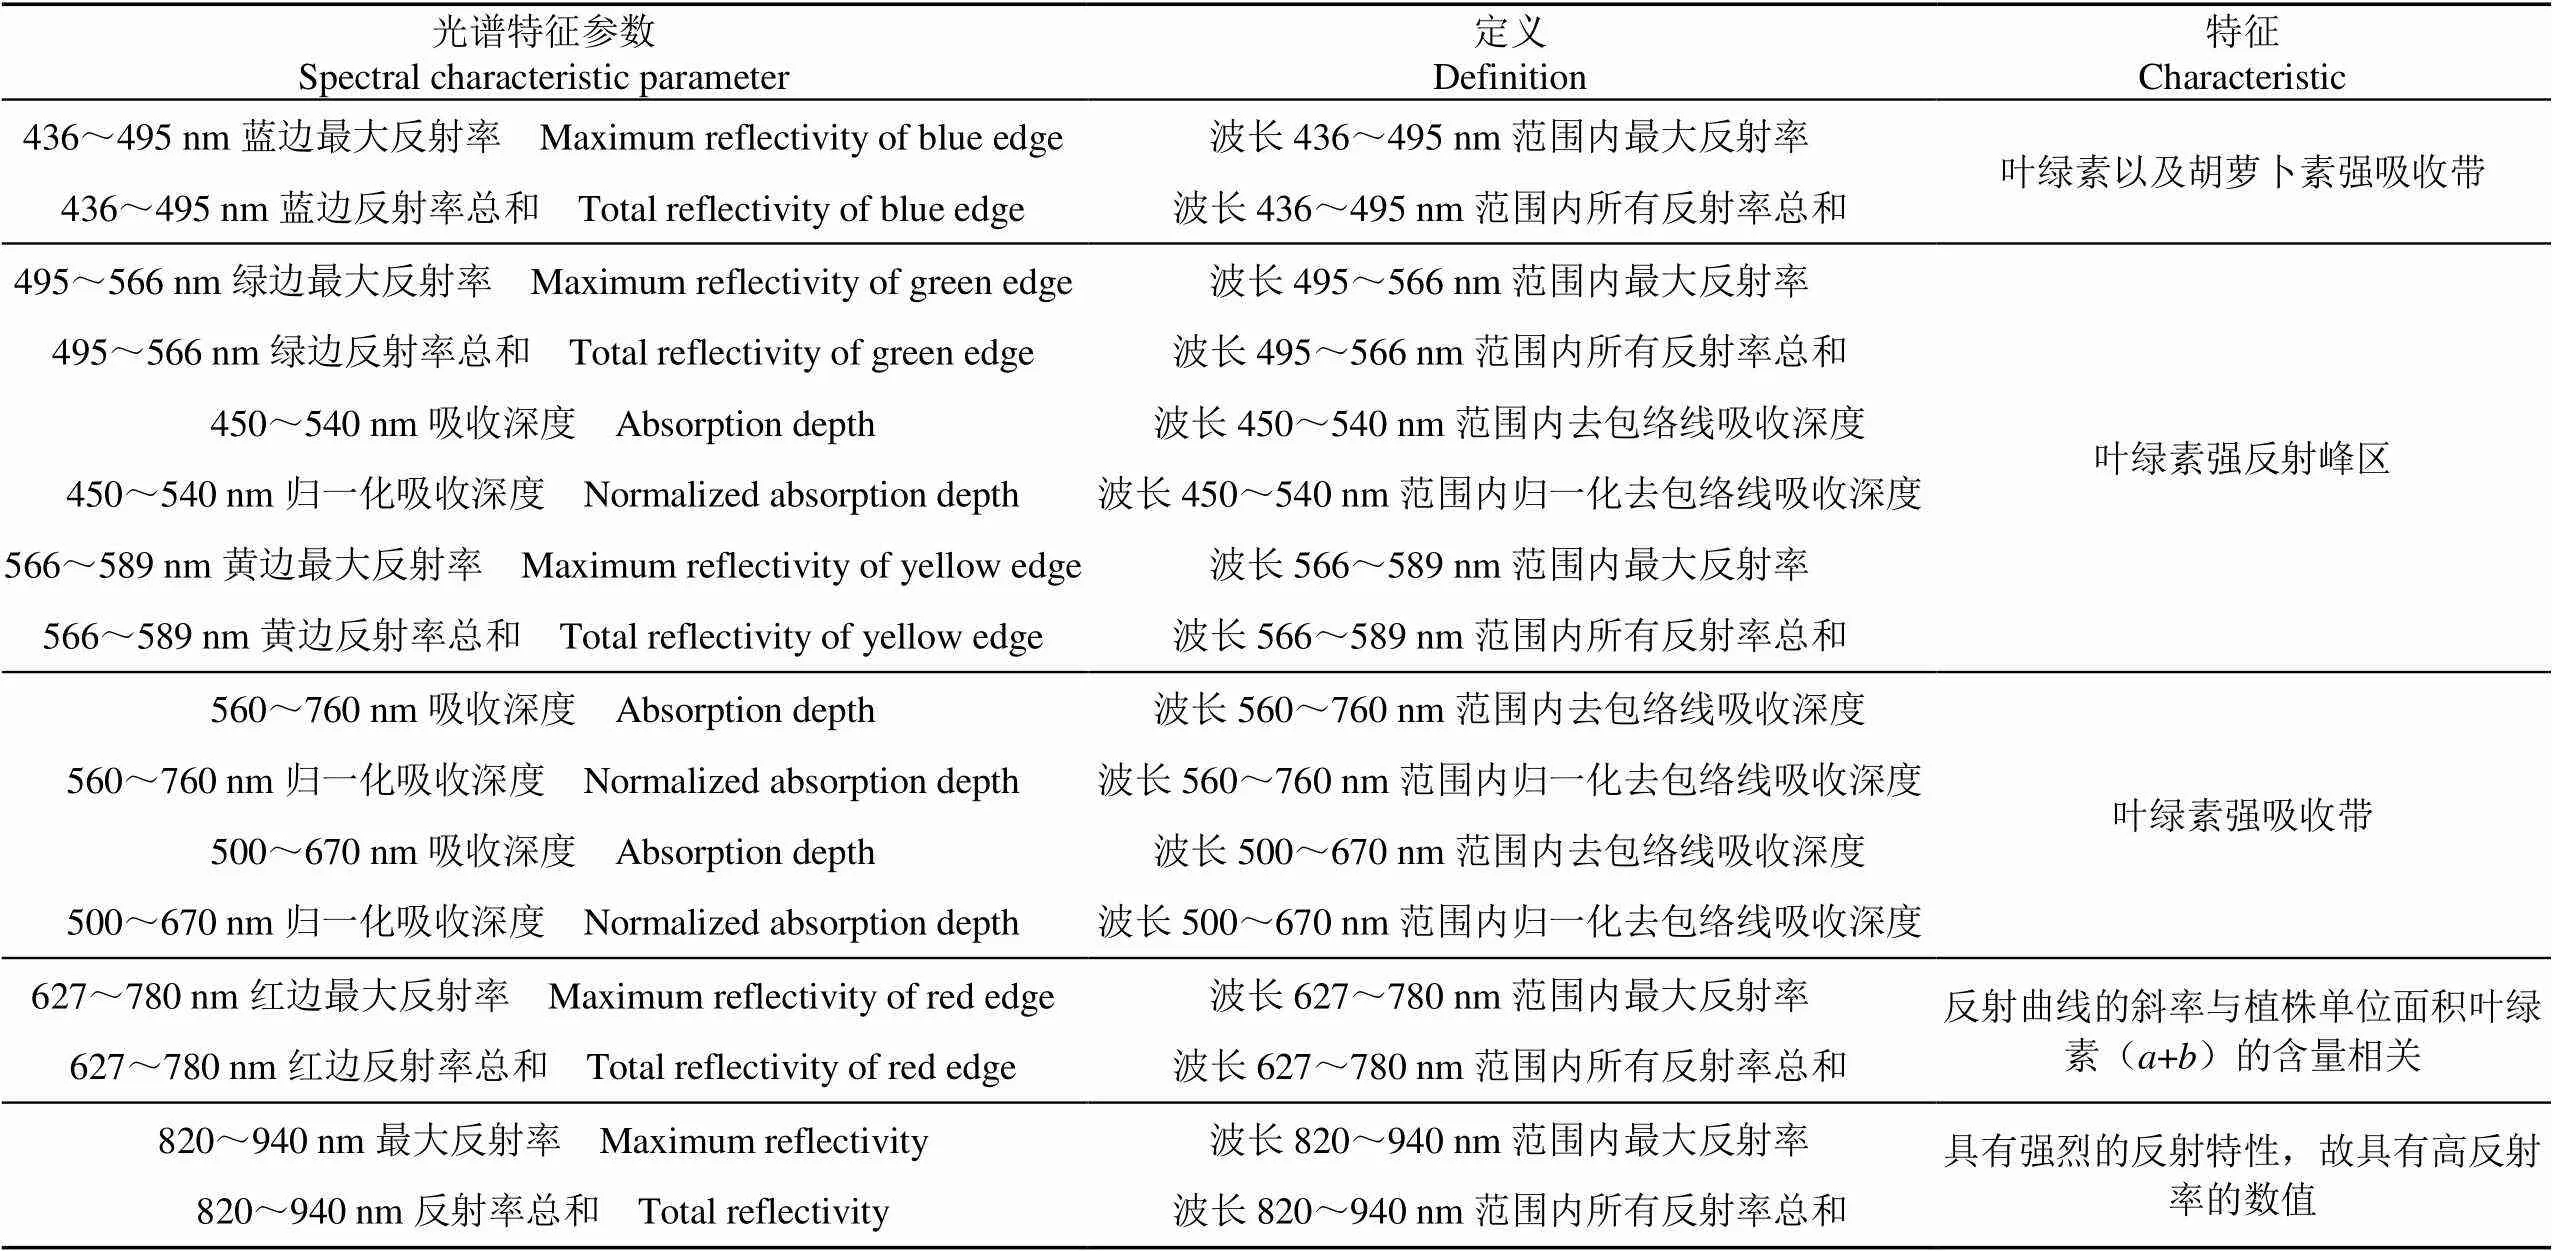
2 结果与分析
2.1 春小麦叶绿素含量与光谱特征参数相关性分析
2.2 PLSR模型的建立及精度分析
3 讨 论
4 结 论

