基于电磁感应研究新疆土壤盐分三维空间变异对季节的响应
2017-11-24 06:07吴亚坤刘广明苏里坦杨劲松
农业工程学报 2017年14期
吴亚坤,刘广明,苏里坦,杨劲松
(1. 安徽工业大学能源与环境学院,马鞍山 243002;2. 土壤与农业可持续发展国家重点实验室,中国科学院南京土壤研究所,南京 210008;3. 中国科学院新疆生态与地理研究所,乌鲁木齐 830011)
基于电磁感应研究新疆土壤盐分三维空间变异对季节的响应
吴亚坤1,2,刘广明2※,苏里坦3,杨劲松2
(1. 安徽工业大学能源与环境学院,马鞍山 243002;2. 土壤与农业可持续发展国家重点实验室,中国科学院南京土壤研究所,南京 210008;3. 中国科学院新疆生态与地理研究所,乌鲁木齐 830011)
为了获得新疆典型区域不同季节土壤盐分的三维特征,该研究以新疆伊犁地区典型地块为研究区域,将电磁感应式土壤表观电导率快速测定技术作为基础,建立了基于土壤表观电导率数据不同季节的区域尺度剖面分层土壤盐分精确解译模型,获得了剖面土壤盐分含量信息,并以此为数据源采用反距离权重空间数据插值方法评估了研究区不同季节三维土壤盐分空间变异特征,探索了三维土壤盐分变化对不同季节的响应特征。研究表明:研究区秋、春两个季节各土层土壤盐分含量的变异系数在1.223~1.636之间,均表现为强度变异性,秋季土壤盐分含量的变异性随着土层深度的增加而减小,而春季土壤盐分含量的变异性随着土层深度的增加而增大。秋、春两个季节研究区大部分区域土壤盐分含量比较低,土壤盐分含量高值区域主要集中在研究区的西北、西南及中部地区,并且表现出次年春季的盐渍化程度及盐土所占比例比前一年秋季明显加重。利用电磁感应式土壤表观电导率快速测定结合三维反距离权重方法,对区域不同季节土壤盐分三维空间变异特征解析的精度分别达到相关系数为0.887和0.862。研究结果将为解译与评估干旱区三维土壤盐分特征随季节变化提供可靠的理论依据和技术方法。
电磁感应;土壤;盐分测量;反距离权重法;三维空间变异;季节变化
0 引 言
土壤盐渍化是当今世界上土地荒漠化和土地退化的主要类型之一,也是世界性资源问题和生态问题[1-5]。土壤盐渍化的程度易受季节性降水的影响而产生较大的变化,因而研究土壤盐渍化在不同季节的空间变化与时空变异性特征,对于掌握土壤盐分变化规律及进一步预防土壤退化具有重要意义[6-8]。电磁感应技术(EM38 大地电导率仪)因其可直接获取土壤的表观电导率数据,并且具有实时、快速、精度高的优点[9-12],现已被广泛应用到大面积土壤盐渍化的调查和研究[13-15],如 Li等采用EM38大地电导率仪和线性预测模型来获取剖面土壤表征电导率,并以此为数据源,利用三维普通克立格方法进行三维土体电导率空间变异预测和模拟,得到了滨海盐土三维土体电导率的空间变化特征[16]。明确区域土壤盐分三维特征的基础是三维离散分布的空间数据的获得[17-21],而电磁感应技术可以高效、便捷的实现剖面土壤信息的采集[22-25]。然而,当前少有人研究应用电磁感应技术与地统计方法获得区域三维土壤盐分变化对不同季节的响应特征。
本研究应用大地电导率仪 EM38探测得到土壤表观电导率,建立出适合新疆伊犁地区不同季节的分层土壤盐分解译模型,利用三维反距离权重方法(inverse distance weighting,IDW)得到研究区不同季节三维土壤盐分空间变异特征,探索新疆伊犁区域三维土壤盐分对季节变化的响应特征。本研究将为解译与评估干旱区三维土壤盐分特征随季节变化提供可靠的理论依据和技术方法。
1 材料与方法
1.1 研究区自然概况
研究区属新疆伊犁河谷地区察布查尔锡伯族自治县纳达齐牛录乡,地理位置位于 43°17′~43°57′N,80°31′~81°43′E。该区属于干旱气候,年平均气温 7.9 ℃,年平均降水量206 mm,年平均蒸发量为1 594 mm,年蒸发量是年降水量的7.74倍,导致该区土壤盐渍化明显。农作物以水稻、棉花、小麦和玉米等为主。该研究区域种植作物均为水稻,土壤采样与 EM38测量单元均在水稻田或荒地上。研究区水稻田地下水埋深平均为80 cm,荒地地下水埋深平均为60 cm。土壤表层含水量秋季12%,春季10%。
1.2 数据获取方法
本研究采用大地电导率仪EM38(加拿大Geonics公司生产)进行土壤表观电导率(ECa,mS/m)测定。在研究区内,按照300 m左右的行距,利用移动设备加载EM38沿直线进行土壤表观电导率的测量,测量路线根据研究区内的实际地形、沟渠布局等做适当调整。每个测量点采用水平与垂直 2种测量位放置地面测定土壤表观电导率,水平模式与垂直模式测得的土壤表观电导率分别以ECaH与ECaV来表示[26]。采样时间分别为2015年10月(秋季)和2016年5月(春季),每个测量点位坐标用GPS(型号为Trimble Pro XRS)定位技术记录,EM38测量点分布见图1。
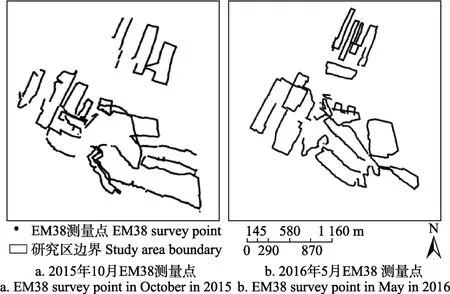
图1 EM38测量样点分布图Fig.1 Distributions of EM38 survey points
采用网格机械布点的方法,在 EM38测量点上选取70个土壤剖面(2015年与2016年采样方法与采样数量相同),每个剖面按照0~30、>30~60和>60~100 cm进行分层采样。土壤样品经实验室内自然风干、磨碎、过2 mm筛后备用。所有土壤样品均制备1∶5土水比浸提液,测定其全盐含量[27]。
1.3 土壤盐分三维数据解译方法
本研究以选定的70个土壤剖面所测的土壤全盐量及EM38水平模式与垂直模式测得的土壤表观电导率 ECaH与ECaV为样本总体(2015年与2016年土壤采样样本量相同),以各土层全盐量为因变量,以2种测量位下的土壤表观电导率(ECaH与ECaV)为自变量,建立研究区不同季节和不同土层(0~30、>30~60和>60~100 cm)土壤盐分的回归解译模型。
由表 1可知,不同季节不同土层的土壤盐分解译模型均具有良好精度,相关系数都在0.875以上,达到0.1%极显著水平(P<0.000 1,n=70,R0.001=0.362)。利用表1建立的回归模型对 EM38不同测量位下的土壤表观电导率进行解译,获得研究区不同季节与不同土层的土壤全盐含量(2015年样本点数 30064个,2016年样本点数27171个),EM38解译得到的三维土体样本点及全盐量见图2所示。
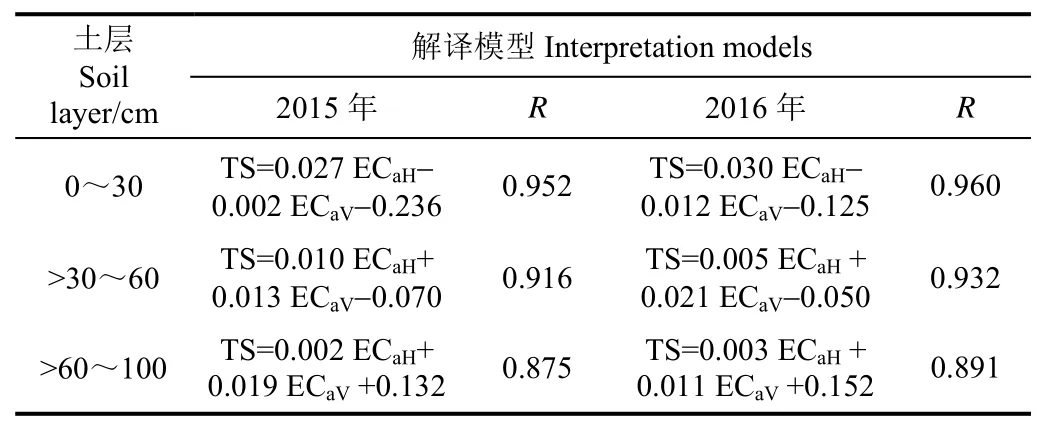
表1 剖面土壤全盐量解译模型Table 1 Interpreting models of soil total salt content(n=70,P<0.001)
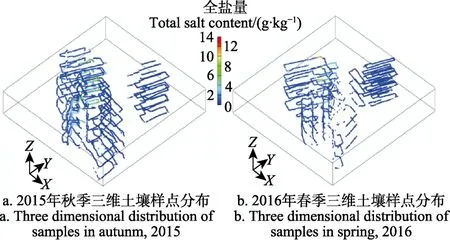
图2 EM38解译的土壤三维散点及盐分剖面分布图Fig.2 Distribution of 3D scatter data and profile soil salinity from data of EM38 survey in study area
1.4 空间插值与制图方法
不同季节区域土壤盐分三维空间分布的估值与模拟采用三维反距离权重法(inverse distance weighting,IDW)。IDW 法广泛应用于地球科学领域,IDW 法最大的优点是它的简单性,未知点的值是一个邻近点距离倒数的函数。
应用GMS软件构建采样点盐分3D Scatter Data模型图(见图2),以此为基础构建研究区土壤3D Mesh Data模型,并形成研究区土壤的三维空间结构模型图(见图3)。应用GMS软件的Interpolation工具进行IDW法三维土壤盐分空间插值估算。为了获得更佳的可视化效果,绘制的所有三维分布图中垂直方向均扩大1 000倍。
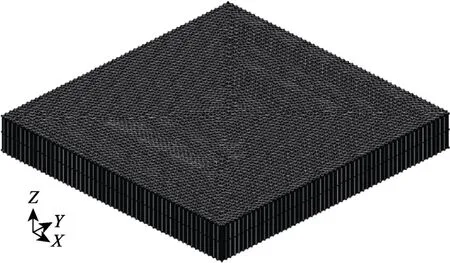
图3 研究区域3D Mesh模型图Fig.3 3D Mesh model of study area
本研究将每个季节总体样本的 75%为训练数据集,25%为验证数据集。2015年秋季样本数共计30 064,其中22 548个为训练数据集,7 516个为验证数据集。2016年春季样本数共计27 171,其中20379个为训练数据集,6792个为验证数据集。并采用均方根误差(root mean squared error,RMSE)与测量值与实测值的相关系数(R)用来表征预测的精度[28]。
1.5 应用软件
本研究应用SPSS进行统计特征值分析,应用地质统计软件GMS进行土壤盐分IDW插值和三维分布图绘制,ArcGIS软件进行EM38测量点位的绘制。
2 结果与分析
2.1 剖面土壤盐分统计特征
研究区2015年秋季与2016年春季土壤剖面盐分含量统计特征见表2。由表2可知,2015年秋季与2016年春季各层土壤盐分含量最小值比较接近,均在 0.151~0.268 g/kg之间,但最大值 2015年秋季为 8.126~13.302 g/kg,而2016年春季为10.100~12.950 g/kg,两个季节极大值都出现在0~30cm土层。由平均值来看两个季节的各层土壤盐分含量均随着土壤深度的增加而减小,所不同的是秋季的土壤盐分含量随着深度增加减小较缓,而春季的土壤盐分含量随着深度增加变化较陡,土壤盐分表现为表聚型剖面分布特征。
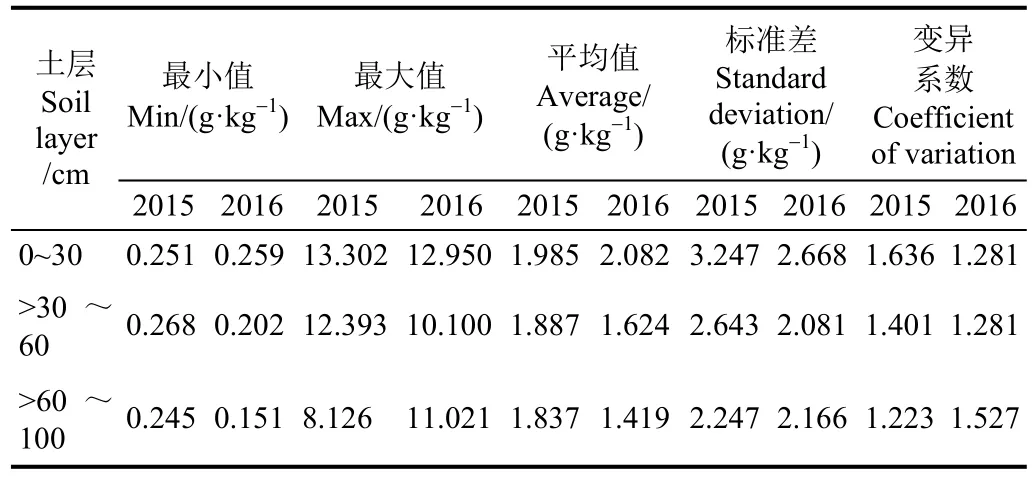
表2 剖面土壤盐分的统计特征值(n=70)Table 2 Statistical feature values of soil salinity in profile
两个季节各土层土壤盐分含量的变异系数在1.223~1.636之间,均表现为强度变异性。但随着季节不同,剖面变异系数变化规律有一定的差异,秋季土壤盐分含量的变异性表现为随着土层深度的增加而减小,而春季土壤盐分含量的变异性表现为随着土层深度的增加而增大。
2.2 土壤盐分三维分布特征
利用三维反距离权重插值方法,得到了新疆伊犁河谷地区三维土壤盐分的空间分布图(见图4)。由图4可以看出,研究区大部分区域土壤含盐量比较低(含盐量<1 g/kg),而两个季节土壤含盐量高值区域主要集中在研究区的西北、西南及东北地区,并且表现出2016年春季的土壤含盐量相较于 2015年秋季土壤盐分含量明显升高,研究区2016年春季土壤盐分>6 g/kg面积明显变大,这与研究区的气候变化特点相一致,前一年秋季到次年春季该区蒸发量远远大于降水量,土壤盐分聚集,导致土壤盐渍化程度加重。
根据研究区两个季节盐分空间分布的总体特征,重点选取了研究区3个典型截面的盐分剖面分布情况,3个截面的土壤盐分分布情况如图 5所示。A-A′截面从研究区西北角横贯到东南角,由该剖面可以看出两个季节的剖面土壤全盐量同样是<1 g/kg占主体,整个剖面表现出上层土壤含盐量与下层土壤含盐量同属一个盐分划分的级别[30],即上层为轻度盐渍化土壤,下层也同样为轻度盐渍化土壤,并且两个季节表现的规律相似。为了直观的看出剖面土壤受盐渍化影响的程度,本研究作图时土壤含盐量划分参照半干旱和干旱区土壤盐渍化分级标准[29],根据研究区域0~100 cm土壤盐分进行土壤盐渍化分级,即土壤含盐量分别在[0,1.0],[1.0,2.0],[2.0,4.0],[4.0,6.0]和高于6.0 g/kg,相应盐渍化等级分别为非盐渍化、轻度盐渍化、中度盐渍化、重度盐渍化和盐土 5个等级。因该标准中各个级别含盐量差别较大,全盐量变化少于1 g/kg或2 g/kg在图中没有体现,所以剖面土壤含盐量的变化不显著。两个季节土壤含盐量在空间分布上,都表现出西北角(即A附近)盐分含量高于东南(即A′附近)的特征,但2016年春季西北方向的土壤盐渍化波及面积和程度明显加深,尤其西北角(即 A附近)土壤整个剖面的全盐量均大于6 g/kg,属于盐土范畴。由 B-B′截面可以看出,该截面上两个季节大部分区域剖面土壤具有不同程度的盐渍化,土壤盐分的垂直分布在该截面的两端表现为整个剖面土壤全盐量同属同一盐渍化划分级别,而在截面的中间位置整个剖面盐分的含量呈现随着土壤深度的增加,土壤含盐量逐渐降低的趋势,表现为盐分表聚现象。在该截面靠近B附近,2016年春季土壤全盐量明显高于2015年秋季。在C-C′截面上,在空间上两个季节土壤盐分都表现出在截面的两端高中间低的特征,特别是2016年春季研究区的东北方向(即C`附近)土壤含盐量非常高,达到了盐土水平。
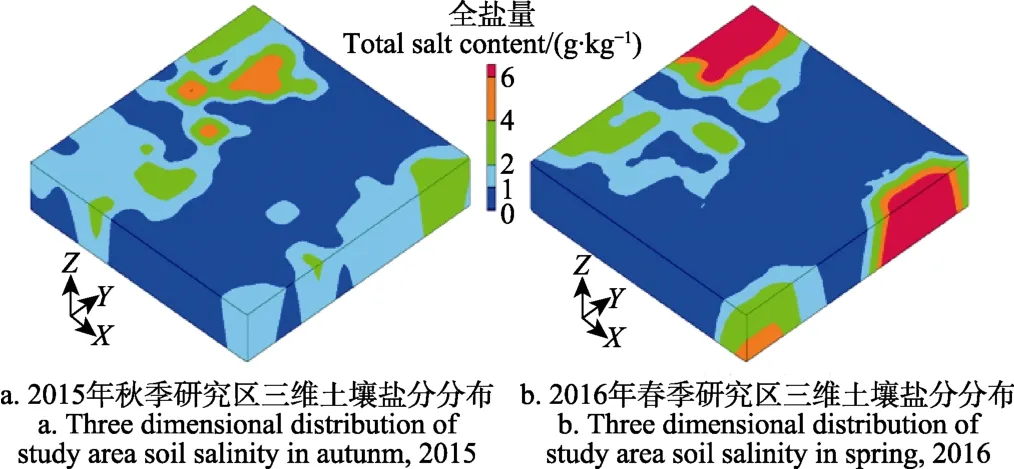
图4 研究区不同季节三维土壤盐分空间分布Fig.4 Three dimensional distribution of soil salinity for different season in study area
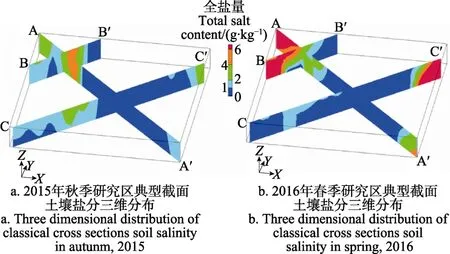
图5 研究区不同季节三维土壤典型截面盐分分布图Fig.5 Classical cross sections of 3D soil salinity for different season in study area
研究区不同季节土壤盐分三维空间变化情况除与气候因素有直接关系外,也受当地种植作物影响,因研究区域主要种植水稻,种稻淋盐效果显著,所以研究区大部分区域土壤盐分比较低。而次年春季深层可溶性盐类借助毛细管作用上升,土壤有所返盐。而研究区的西北、西南土壤盐分含量高值区域主要为荒地, 在农业生产过程中引水及灌溉提高了地下水位, 因而深层土壤以及地下水中盐分积聚于表层。研究区的盐分分布与其他学者的研究结果相近[30]。
2.3 研究区不同季节土壤盐渍化面积分布
根据土壤盐渍化分级标准[29],统计了研究区域两个季节不同土层,不同盐渍化等级,即非盐渍化、轻度盐渍化、中度盐渍化、重度盐渍化和盐土 5个等级盐渍化土壤所占比例(见表3)。
由表3可以看出:2015年秋季研究区大部分为非盐渍化土壤,各土层(0~30、>30~60和>60~100)非盐渍化所占比例分别 65%、69%和 81%,随着土壤深度变深非盐渍化土壤所占比例逐渐加大。而相应的受不同程度盐渍化影响的土壤比例是随着深度增加而减小。对于盐渍化土壤(轻度盐渍化、中度盐渍化、重度盐渍化和盐土),不同盐渍化程度的土壤随着深度不同所占比例略有不同,0~60 cm盐渍化土壤以轻度盐渍化土壤为主,中度盐渍化和重度盐渍化土壤次之,盐土所占比例最少;而>60~100 cm盐渍化土壤中度盐渍化土壤所占比例(占9%)略高于轻度盐渍化土壤(占7%),重度盐渍化土壤较少,没有盐土分布。2016年春季与2015年秋季相似,同样是非盐渍化土壤所占比例较大,并且随着土壤深度变深非盐渍化土壤所占比例逐渐加大。而不同程度盐渍化土壤中各程度盐渍化所占比例有较大的变化:盐土所占比例明显变大,每层土壤都达到5%,而其他程度的盐渍化土壤所占比例均有不同程度的减少,说明研究区土壤盐渍化变化从前一年秋季到次年春季间主要发生在受到盐渍化影响的土壤上,需采取切实有效的相应治理措施对区域土壤盐渍化加以防控与治理。
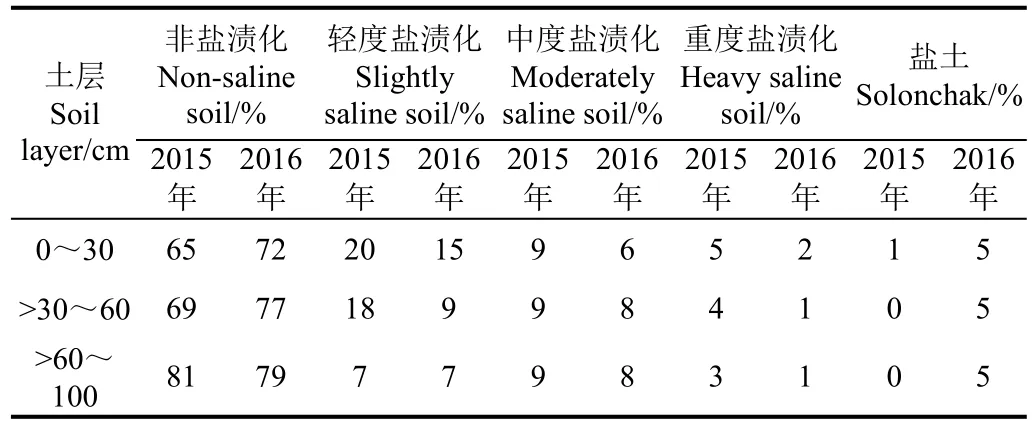
表3 研究区不同季节土壤盐渍化等级所占比例Table 3 Proportion of soil salinization grades for different season in study area
2.4 精度验证
经交叉检验分析,2015年秋季和2016年春季反距离权重法的预测均方根误差(root mean square error,RMSE)分别为0.193 5和0.210 6 g/kg。预测值和实测值之间的相关系数(R)2015年秋季和2016年春季分别为0.887和0.862。可见三维反距离权重方法在预测不同季节土壤盐分三维空间变化上都得到了较高的精度。本研究的方法和思路可以用于具有相似生态因子背景的区域土壤盐分三维分布的研究。
3 讨 论
通过电磁感应技术(EM38)获得土壤盐分三维离散分布空间数据是目前区域土壤盐分三维特征评估的主要思路[3,6,21]。本研究利用多元回归方法建立了不同季节及不同土层土壤含盐量的解译模型,相关系数在 0.875~0.960之间,达到显著水平,具有较高的精度[10,18,31]。本研究在建立盐分解译模型时考虑到土壤含水量、土壤质地、pH值及地下水矿化度等因素,因其与土壤含盐量的相关性不显著,最后建模时未引用这些变量。由于土壤含盐量变化的季节性和随机性,2015年秋季与2016年春季土壤盐分解译模型的相关系数有所不同。后续研究同样可以用电磁感应技术获得土壤表观电导率,再利用多元回归的方法获得土壤盐分的解译模型。
研究区土壤全盐量的空间分布因受到微地形、气候、地下水性质等自然因素和农田灌溉等人为因素影响,春、秋两季土壤盐分空间变异性均表现为强度变异性,这与新疆地区其他研究结果相似[33]。研究区春、秋两季土壤盐分以非盐渍化占主体,盐渍化程度高的土壤主要分布在研究区的西北、西南及中部地区。2016年春季土壤盐渍化程度变深,盐土所占比例变大。两个季节土壤剖面盐分变化大部分表现为表聚性,但由于其强空间变异性,局部表现为底聚性,这与研究区的主要土地利用方式为水稻田和荒地有关,因为水稻田和荒地两种土地类型土壤盐分的动态变化差异较大[30,32]。
4 结 论
1)研究区秋、春两个季节各层土壤盐分含量均为强度变异性,随着季节不同,剖面变异规律有一定的差异,秋季土壤盐分含量的变异性随着土层深度的增加而减小,而春季土壤盐分含量的变异性随着土层深度的增加而增大。
2)研究区大部分区域土壤盐分含量比较低,秋、春两个季节土壤盐分含量高值区域主要集中在研究区的西北、西南及中部地区,并且表现出次年春季的盐渍化程度及盐土所占比例比前一年秋季明显加重。
3)电磁感应式土壤表观电导率快速测定结合三维反距离权重方法,对区域秋季和春季土壤盐分三维空间变异特征解析的精度分别达到相关系数为0.887和0.862。本研究可以为评估新疆区域土壤盐分节土壤盐分三维空间变异特征进行精确解析与评估。
[1] 李凤全,吴樟荣. 半干旱地区土地盐碱化预警研究以吉林省西部土地盐碱化预警为例[J]. 水土保持通报,2002,22(1):57-59.Li Fengquan, Wu Zhangrong. A study on soil salinization early-warning in semi-arid area-as a sample in West Jilin Province[J]. Bulletin of Soil and Water Conservation, 2002,22(1): 57-59. (in Chinese with English abstract)
[2] 杨劲松. 中国盐渍土研究的发展历程与展望[J]. 土壤学报,2008,45(5):837-845.Yang Jingsong. Development and prospect of the research on salt-affected soils in China[J]. Acta Pedologica Sinica, 2008,45(5): 837-845. (in Chinese with English abstract)
[3] 吴亚坤,刘广明,杨劲松,等. 基于反距离权重插值的土壤盐分三维分布解析方法[J]. 农业工程学报,2013,29(3):100-106.Wu Yakun, Liu Guangming, Yang Jinsong, et al. Interpreting method of regional soil salinity 3D distribution based on inverse distance weighting[J]. Transactions of the Chinese Society of Agricultural Engineering (Transactions of the CSAE), 2013, 29(3): 100-106. (in Chinese with English abstract)
[4] Taghizadeh-Mehrjardi R, Minasny B, Sarmadian F, et al.Digital mapping of soil salinity in Ardakan region, central Iran[J]. Geoderma, 2014, 213: 15-28.
[5] Scudiero E, Skaggs T H, Corwin D L. Comparative regional-scale soil salinity assessment with near-ground apparent electrical conductivity and remote sensing canopy reflectance[J]. Ecological Indicators, 2016, 70: 276-284.
[6] Li H Y, Marchant B P, Webster R. Modelling the electrical conductivity of soil in the Yangtze delta in three dimensions[J]. Geoderma, 2016, 269: 119-125.
[7] Ding J L, Yu D L. Monitoring and evaluating spatial variability of soil salinity in dry and wet seasons in the Werigan–Kuqa Oasis, China, using remote sensing and electromagnetic induction instruments[J]. Geoderma, 2014,235-236: 316-322.
[8] Liu G M, Li J B, Zhang X C, et al. GIS-mapping spatial distribution of soil salinity for Eco-restoring the Yellow River Delta in combination with Electromagnetic Induction[J]. Ecological Engineering, 2016, 94: 306-314.
[9] Corwin D L, Plant R E. Applications of apparent soil electrical conductivity in precision agriculture [J]. Computers and Electronics in Agriculture, 2005, 46(1/2/3): 1-10.
[10] 吕真真,杨劲松,刘广明. 基于EM38-MK2的滨海土壤电导率精确解译模型[J]. 排灌机械工程学报,2014,32(10):894-900 Lü Zhenzhen, Yang Jingsong, Liu Guangming. Accurate models of interpreting soil electrical conductivity based on EM38-MK2[J]. Journal of Drainage and Irrigation Machinery Engineering (JDIME), 2014, 32(10): 894-900. (in Chinese with English abstract)
[11] Neely H L, Morgan C L S, Hallmark C T, et al. Apparent electrical conductivity response to spatially variable vertisol properties[J]. Geoderma, 2016, 263: 168-175.
[12] Huang J, Mcbratney A B, Minasny B, et al. Monitoring and modelling soil water dynamics using electromagnetic conductivity imaging and the ensemble Kalman filter[J].Geoderma, 2017, 285: 76-93.
[13] Guillemoteau J, Tronicke J. Non-standard electromagnetic induction sensor configurations: Evaluating sensitivities and applicability[J]. Journal of Applied Geophysics, 2015,118: 15-23.
[14] Huang J, Subasinghe R, Malik R S, et al. Salinity hazard and risk mapping of point source salinisation using proximally sensed electromagnetic instruments[J]. Computers and Electronics in Agriculture, 2015, 113(C): 213-224.
[15] Farzamian M, Santos F A M, Khalil M A. Application of EM38 and ERT methods in estimation of saturated hydraulic conductivity in unsaturated soil[J]. Journal of Applied Geophysics, 2015, 112(112): 175-189.
[16] Li H Y, Webster R, Shi Z. Mapping soil salinity in the Yangtze delta: REML and universal kriging (E-BLUP)revisited[J]. Geoderma, 2015, 237-238: 71-77.
[17] 李洪义,史舟,唐惠丽. 基于三维普通克立格方法的滨海盐土电导率三维空间变异研究[J]. 土壤学报,2010,47(2):359-363.Li Hongyi, Shi Zhou, Tang Huili. Research on three-dimension spatial variability of soil electrical conductivity of coastal saline land using 3D ordinary kriging method[J]. Acta Pedologiaca sinica, 2010, 47(2): 359-363.(in Chinese with English abstract)
[18] 姚荣江,杨劲松,赵秀芳,等. 沿海滩涂土壤盐分空间分布的三维随机模拟与不确定性评价[J]. 农业工程学报,2010,26(11):91-97.Yao Rongjiang, Yang Jingsong, Zhao Xiufang, et al.Three-dimensional stochastic simulation and uncertainty assessment onspatial distribution of soil salinity in coastal region[J]. Transactions of the Chinese Society of Agricultural Engineering (Transactions of the CSAE), 2010, 26(11): 91-97. (in Chinese with English abstract)
[19] Guo Y, Shi Z, Li H Y, et al. Application of digital soil mapping methods for identifying salinity management classes based on a study on coastal central China[J]. Soil Use and Management, 2013, 29(3): 445-456.
[20] 刘广明,吴亚坤,杨劲松,等. 基于光谱指数的区域土壤盐分三维空间变异研究[J]. 光谱学与光谱分析,2013,33(10):2758-2761.Liu Guangming, Wu Yakun, Yang Jinsong, et al. Study on three-dimension spatial variability of regional soil salinity based on spectral indices[J]. Spectroscopy and Spectral Analysis, 2013, 33(10): 2758-2761. (in Chinese with English abstract)
[21] 马翀,潘懋,金毅,等. 三维地学建模技术与 Kriging方法在固体矿产储量计算中的应用[J]. 北京大学学报(自然科学版),2011,47(3):483-490.Ma Chong, Pan Mao, Jin Yi, et al. Application of 3D geosciences modeling technology and Kriging method for solid mine reserves estimation[J]. Acta Scientiarum Naturalium Universitatis Pekinensis, 2013, 47(3): 483-490.(in Chinese with English abstract)
[22] Lesch S M. Sensor-directed response surface sampling designs for characterizing spatial variation in soil properties[J]. Computers and Electronics in Agriculture, 2005,46(1/2/3): 153-179.
[23] Triantafilis J, Lesch S M, Lau K L, et al. Field level digital soil mapping of cation exchange capacity using electromagnetic induction and a hierarchical spatial regression model[J]. Australian Journal of Soil Research,2009, 47(7): 651-663.
[24] Triantafilis J, Santos F A M. Hydrostratigraphic analysis of the Darling River valley (Australia) using electromagnetic induction data and a spatially constrained algorithm for quasi-three-dimensional electrical conductivity imaging[J].Hydrogeology Journal, 2011, 19(5): 1053-1063.
[25] Triantafilis J, Terhune IV C H, Monteiro Santos F A. An inversion approach to generate electromagnetic conductivity images from signal data[J]. Environmental Modelling &Software, 2013, 43(3): 88-95.
[26] Grellier S, Florsch N, Camerlynck C, et al. The use of Slingram EM38 data for topsoil and subsoil geoelectrical characterization with a Bayesian inversion[J]. Geoderma,2013, 200-201: 140-155.
[27] 鲁如坤. 土壤农业化学分析方法[M]. 北京:中国农业科技出版社,1999:90-99.
[28] van Meirvenne M, Maes K, Hofman G. Three-dimensional variability of soil nitrate-nitrogen in an agricultural field[J].Biology and Fertility of Soils, 2003, 37(3): 147-153.
[29] 王遵亲,祝寿泉,俞仁培,等. 中国盐渍土[M]. 北京:科学出版社,1993.
[30] 祖皮艳木·买买提,海米提·依米提,麦麦提吐尔逊·艾则孜.伊犁河谷地下水及土壤盐分分布特征[J]. 干旱地区农业研究,2011,29(1):58-63.Zulpiya Mamat, Haimiti Yimiti, Mamattursun Aziz. The distribution of salinity of soil and groundwater in Ili River valley[J]. Agricultural Research in the Arid Areas, 2011,29(1): 58-63. (in Chinese with English abstract)
[31] 姚远,丁建丽,张芳,等. 基于电磁感应技术的塔里木盆地北缘绿洲土壤盐分空间变异特性[J]. 中国沙漠,2014,34(3):765-772.Yao Yuan, Ding Jianli, Zhang Fang, et al. Monitoring the spatial variability of soil salinity and composite in dry and wet seasons in North Tarim Basin monitored with electromagnetic induction instruments[J]. Journal of Desert Research, 2014, 34(3): 765-772. (in Chinese with English abstract)
[32] 马成霞,丁建丽,王璐,等. 绿洲土壤表层含盐量空间变异分析的插值方法研究[J]. 水土保持研究,2014,21(4):317-320.Ma Chengxia, Ding Jianli, Wang Lu, et al. Research for interpolation method of spatial variation analysis on soil salinity in the oasis[J]. Research of Soil and Water Conservation, 2014, 21(4): 317-320. (in Chinese with English abstract)
Response of three-dimensional spatial variability of soil salinity to change of season of Xinjiang based on electromagnetic induction
Wu Yakun1,2, Liu Guangming2※, Su Litan3, Yang Jingsong2
(1.School of Energy and Environment, Anhui University of Technology,Maanshan243002, China; 2.State Key Laboratory of
Soil and Sustainable Agriculture, Institute of Soil Science, Chinese Academy of Sciences, Nanjing210008, China;3.Xinjiang Institute of Ecology and Geography,Chinese Academy of Sciences,Urimqi830011, China)
Salinization and alkalinization are the prominent land degradation processes in arid areas. In this study, our objective was to demonstrate the three-dimensional distribution of the regional soil salt responding to the change of season in typical zone of Xinjiang Automonous Region. The studied areas are located in typical area of the YiLi district in Xinjiang. The apparent electrical conductivity (ECa) was measured at each site using a Geonics ElectroMagnetic (EM38) instrument in different season. The ECadata collected included measurements using both horizontally and vertically modes. Soil samples were collected at selected sites immediately after the EM38 surveys. A field study was conducted, which was consisted of 70 measurement sites visited in different seasons. In addition, soil samples were also collected between 0 to 0.3 m, 0.3 to 0.6 m and 0.6 to 1.0 m depth increments at the location of the deep cores. Prior to laboratory analysis samples were air-dried and ground to pass a 2-mm sieve. The profile soil salinity was determined from the electrical conductivity of a saturated soil paste extract (ECe) according to standard methods. The profile soil salinity was obtained by regression model using apparent electrical conductivity. The model correlation coefficient differed from 0.875 to 0.952 that indicated high precision accuracy for each model. Three-dimensional soil salt distribution was characterized by inverse distance weighting method for different season. The results showed that average of soil salinity all decreased with increasing depth in the study area in different season. But average of soil salinity moderately decreased with increasing depth in autumn than in spring. The coefficient of variation of soil salinity, an indicative of strength intensity variation for different seasons, ranged from 1.223 to 1.636.Variation of soil salinity decreased with the increase of soil depth in autumn, but variation of soil salinity increased with the increase of soil depth in spring. Map of three-dimensional distribution of the regional soil salt demonstrated that sever soil salinity located in northwest corner of the studied area in autumn and spring. But the area and degree of salinization indicated more serious in spring than in autumn in northwest corner of the studied area. The soil salinity of total profile was more than 6 g/kg soil in northwest corner of study area in spring. Non-saline soil mostly distributed in the studied area in autumn of 2015.Area ratio of non-saline soil for each depth differed 65%, 69% and 81%. Area ratio of non-saline soil increased with increasing depth, area ratio of salinization soil decreased with increasing depth in the study area. Area ratio of different degree salinization soil had slight difference with increasing depth. Area ratio of mild salinization was more than moderate salinization and severe salinization, and area ratio of saline soil (soil salt content more than 6 g/kg soil) was least in 0 to 60 cm depth. Area ratio of moderate salinization was more than mild salinization, and area ratio of severe salinization was least in 60 to 120 cm depth.Non-saline soil mostly distributed and area ratio of non-saline soil increased with increasing depth in study area in spring of 2016. But ratio of saline soil became more than 5% for each depth. The degree of soil salinization and proportion of the severity salinization was significantly increased in the spring of next year than the previous year in autumn. The synthesized method based inverse distance weighting (IDW) method combining electromagnetic induction technique in this study had 0.887 and 0.862 of high correlation coefficient for different season assessment of regional soil salinity. Thus the application of this technique provides a new method to interpretation and evaluation of regional soil salinity response to different season in the three-dimensional spatial distribution characteristics in Xinjiang province.
electromagnetic induction; soils; salinity measurement; inverse distance weighting; three-dimensional spatial variability; seasonal change
10.11975/j.issn.1002-6819.2017.14.024
S156.4
A
1002-6819(2017)-14-0173-06
吴亚坤,刘广明,苏里坦,杨劲松. 基于电磁感应研究新疆土壤盐分三维空间变异对季节的响应[J]. 农业工程学报,2017,33(14):173-178.
10.11975/j.issn.1002-6819.2017.14.024 http://www.tcsae.org
Wu Yakun, Liu Guangming, Su Litan, Yang Jingsong. Response of three-dimensional spatial variability of soil salinity to change of season of Xinjiang based on electromagnetic induction[J]. Transactions of the Chinese Society of Agricultural Engineering(Transactions of the CSAE), 2017, 33(14): 173-178. (in Chinese with English abstract)
doi:10.11975/j.issn.1002-6819.2017.14.024 http://www.tcsae.org
2016-11-16
2017-02-22
新疆维吾尔自治区科技计划项目(201531116);国家重点研发计划项目(2016YFC0501400)
吴亚坤,黑龙江泰来人,博士,讲师,主要从事土壤盐渍化风险评估与GIS方面的研究。马鞍山 安徽工业大学能源与环境学院,243002。Email:wuyakun8250@163.com
※通信作者:刘广明,山东邹城人,博士,副研究员,主要从事土壤盐渍化防控与农业资源高效利用方面的研究。南京 中国科学院南京土壤研究所,210008。Email:gmliu@issas.ac
猜你喜欢
农业知识(2022年9期)2022-10-13
资源信息与工程(2021年5期)2022-01-15
中国生态农业学报(中英文)(2021年8期)2021-07-28
土壤与作物(2021年1期)2021-03-07
湖北农业科学(2020年23期)2020-12-30
矿产勘查(2020年11期)2020-12-25
知识窗(2018年6期)2018-06-26
文物保护与考古科学(2016年4期)2016-05-17
中国农业文摘-农业工程(2016年5期)2016-04-12
读者·校园版(2016年6期)2016-03-07