Prediction of the future flood severity in plain river network region based on numerical model: A case study*
Zi-jun Hu (胡孜军), Ling-ling Wang (王玲玲), Hong-wu Tang (唐洪武), Xiao-ming Qi (戚晓明)
1.State Key Laboratory of Hydrology-Water Resources and Hydraulic Engineering, Nanjing 210098, China
2.College of Water Conservancy and Hydropower Engineering, Hohai University, Nanjing 210098, China
3.Power China Huadong Engineering Corporation Limited, Hangzhou 311122, China, E-mail: hu_zj@ecidi.com
4.Computer Science and Technology Department of Bengbu College, Bengbu 233000, China
Prediction of the future flood severity in plain river network region based on numerical model: A case study*
Zi-jun Hu (胡孜军)1,2,3, Ling-ling Wang (王玲玲)1,2, Hong-wu Tang (唐洪武)1,2, Xiao-ming Qi (戚晓明)4
1.State Key Laboratory of Hydrology-Water Resources and Hydraulic Engineering, Nanjing 210098, China
2.College of Water Conservancy and Hydropower Engineering, Hohai University, Nanjing 210098, China
3.Power China Huadong Engineering Corporation Limited, Hangzhou 311122, China, E-mail: hu_zj@ecidi.com
4.Computer Science and Technology Department of Bengbu College, Bengbu 233000, China
Suzhou is one of Chinaʼs most developed regions, located in the eastern part of the Yangtze Delta. Due to its location and river features, it may at a high risk of flood under the climate change background in the future. In order to investigate the flood response to the extreme scenario in this region, 1-D hydrodynamic model with real-time operations of sluices and pumps is established. The rain-runoff processes of the urban and rural areas are simulated by two lumped hydrologic models, respectively. Indicators for a quantitative assessment of the flood severity in this region are proposed. The results indicate that the existing flood control system could prevent the Suzhou Downtown from inundation in the future. The difficulty of draining the Taihu Lake floods should be given attention to avoid the flood hazard. The modelling approach based on the in-bank model and the evaluation parameters could be effective for the flood severity estimation in the plain river network catchment. The insights from this study of the possible future extreme flood events may assist the policy making and the flood control planning.
Flood control, hydrodynamic model, sea level rise, extreme rain, Suzhou District
Introduction
Numerous studies reveal that the level of the China East Sea is rising due to the climate change[1,2]. The number of extreme rains (ER) in the lowermiddle region of the Yangtze River Basin is also in increase[3,4]. The flood often causes a severe damage, leading to substantial economic losses and even the loss of life[5]. Even more dangerous is that the warming climate during the 20th century would increase the risk of floods in many places of the world[6,7]. Therefore, the Suzhou district faces the intensifiedflood risks both induced by ER and sea level rise (SLR) in the future. The study of the flood response to the extreme scenario related to ER and SLR in this region will assist the policy making and the flood control planning.
Many policies related to the future urban development require information of climate change risks to cities[8]. Therefore, the flood response to ER and SLR has attracted more and more attention of the related departments. Some numerical models were developed to investigate the flood risks of the Taihu Lake Basin[9-11]. Among the simulation methods, with the 2-D model based on the digital elevation data[9], the hydraulic characteristics of the river networks cannot be accurately obtained in an acceptable computing time. Moreover, the available hydrological and topographical data are usually not enough to establish such a complicated 2-D model. Wicks et al.[12]and Xu and Liu.[13]constructed 1-D models with a simplified river network in the Taihu Lake Basin. However, the rivers and the flood control structures in the Suzhou district were overly simplified. Thus, the hierarchical floodcontrol structure system in this region is not well reflected. Especially after the 1999 flood, a number of key projects and the related operating rules had been completed. Therefore, it is high time to establish a numerical model which can reflect the characteristics of the Suzhou District and has the ability to simulate the large number of flood control structures.
The flood risk assessment for the plain river network region remains a challenging task, due to the large number of control structures, the complicated river-lake networks, the repeated human intervention, and the spatial variations in economic values. A GIS-based approach called the Taihu Basin Flood Risk Analysis System (TBRAS) for analyzing the flood risks in the Taihu basin was developed by Yu et al.[14]. The flood volume and distribution caused by breaching and overtopping of the dike were calculated based on the digital elevation data. Thus, the flood risks can be estimated based on the distributed socioeconomic data in the flood cell. In the presented study, if the TBRAS or the similar methods were adopted, the more detailed socioeconomic data would be required. However, they are usually unavailable. Moreover, the county level socioeconomic distribution situations in the future are difficult to be predicted[15]. Thus, a simplified estimation approach of the flood hazards in the complex river network region is more appropriate.
In the present study, for investigating how to make a quick estimation of the future flood severity in the plain river network region with lack of economic data, the river networks of the Suzhou District are selected as a typical case in China. A 1-D hydraulic model with the real-time operation of the flood control structures in this region is established. Two lumped conceptual models NAM and Urban of the MIKE software are employed to simulate the rain-runoff process of the rural and city regions in the study area, respectively. The measured data in the medium rainfall year of 1988 are used for the model calibration and validation. The SLR combined with the ER scenario is designed based on the available data. The current flood control planning is validated and the severity of the future flood is estimated. The results may help the policies making and the flood control planning.
1. Methodology
1.1 Study area and simplification method
The study area (Fig.1) is a hydrological independent part of the Suzhou District, and it is connected to the Yangtze River Estuary. It lies between 120o19ʹE- 121o17ʹE and 31o0ʹN-31o59ʹN, covers an area of 4654.04 km2(excluding the Taihu Lake). The topography of the study area is low-lying with an average ground elevation from 3.5 m to 5.5 m.
Figure 1 shows the complex river networks in the study area. During the flood season, one has to drain not only the runoff in the region, but also the upstream flood from the Taihu Lake. The flood is drained into the tidal current limit region of the Yangtze River at last.
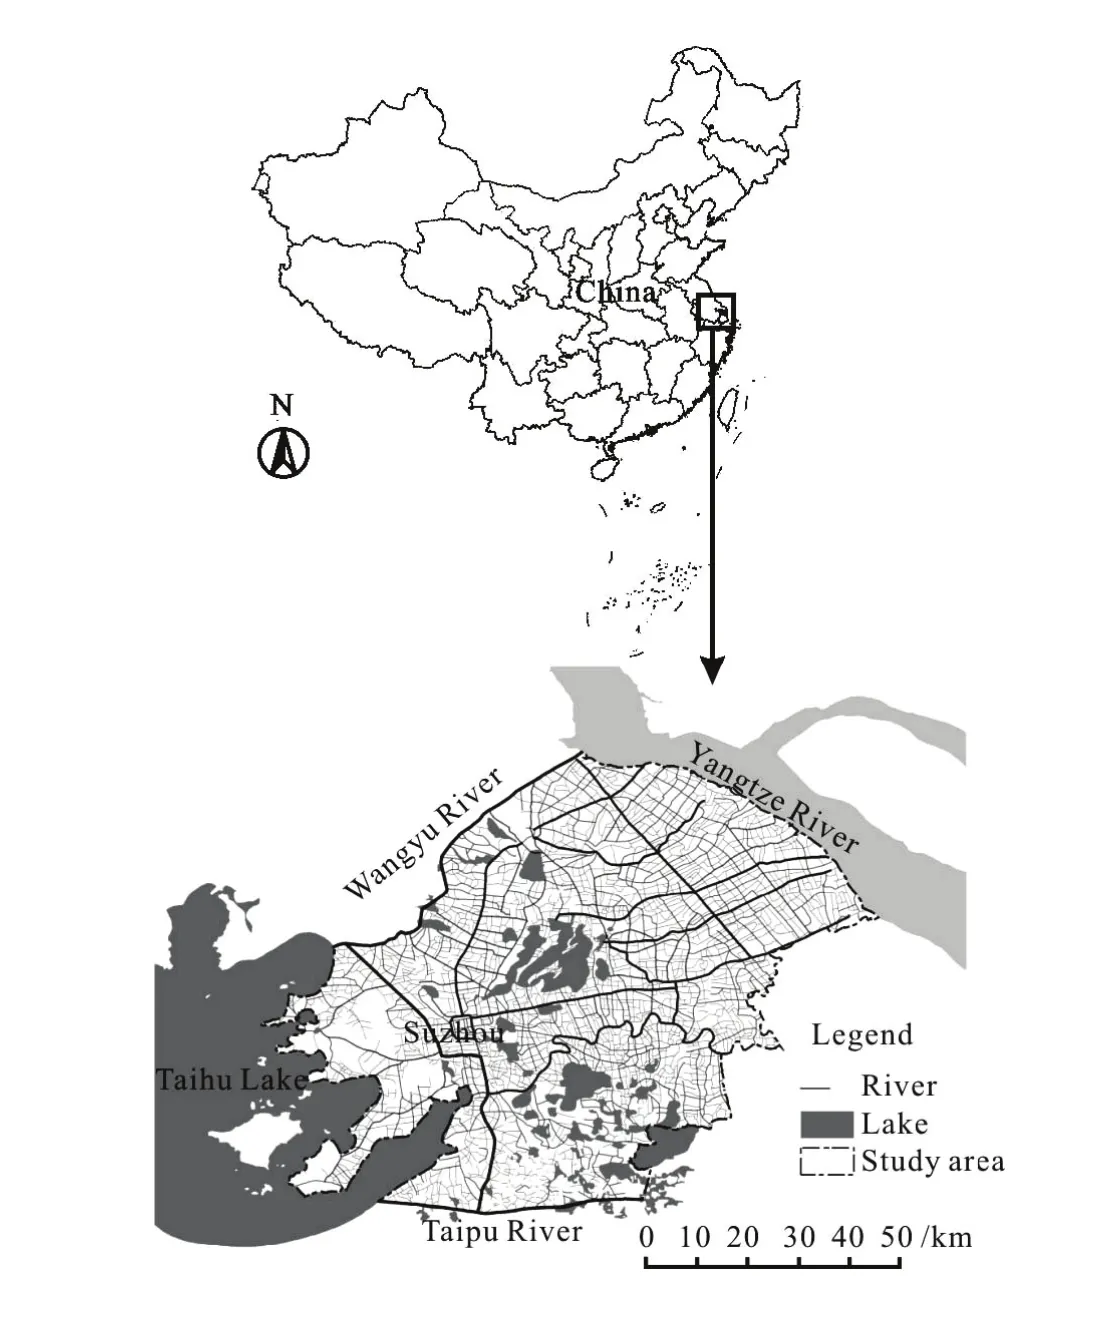
Fig.1 Location map of the study area

Fig.2 Simplified river networks to establish the hydrologic-hydrodynamic coupled model
In order to establish a hydrodynamic model with a suitable complexity, the complicated river networksoutside the Suzhou Downtown have to be simplified. However, the rivers in the Suzhou Downtown are not simplified for the reason that it is the economic and culture center of this area. The flood severity in the region should be estimated more accurately. As shown in Fig.2, each river in the model may represent one real river in the study area, or a combination of several small rivers. The space steps of the computing cross sections range from 100 m to 500 m. The total drainage capacity of the simplified river networks is approximately equal to the actual one in the study area.
Two large lakes (the Yangcheng Lake and the Cheng Lake, shown in Fig.2) are modelled by virtual rivers with the same surface area and the average bottom level of the lakes. The conversions are made with the following equations:

whereAlakeis the surface area of the lake modelled by virtual river,Lvris the total length of the virtual river,Wvris the width of the virtual river,Hlakeis the average bottom level of the lake,Hvris the bottom level of the virtual river.
The additional storage area to be added at a cross section is useful for representing the small storages associated with the main branch such as lakes, bays and small inlets[16]. The effect of the small lakes is modelled with this method. The cross sections which are added to the storage area are the nearest to the centroid of these lakes.
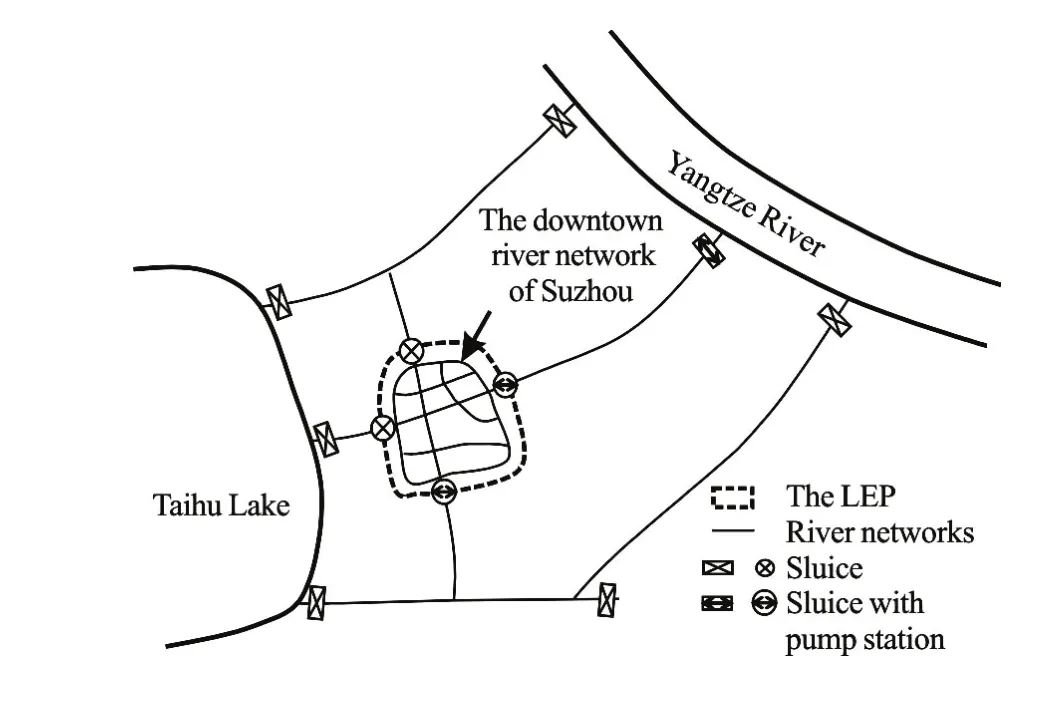
Fig.3 Sketch of the distributions of the three kinds of control structures (the number of the control structures in the figure does not represent the exact value)
1.2 Control structures and operating rules
As shown in Fig.3, there are many sluices and pump stations in the rivers which control the water exchange between the Suzhou Downtown and the outside region. The group of these structures is called the Large Encirclement Project (LEP). The project is constructed for protecting the Suzhou Downtown from inundation under the 200-year flood level. The pumps in the LEP can drain the waterlogging caused by the one-day rainfall with a return period of 20 years. The flood control standard of the outside LEP is the 100-year flood level.
There are about 200 flood control structures in the study area, of which only 65 are in an active use during the flood season. They can be divided into three kinds according to the locations (Fig.3): 13 sluices and 5 pump stations along the south bank of the Yangtze River, 26 sluices and 11 pump stations in the LEP and 10 sluices along the east bank of the Taihu Lake. In the presented study, all 65 structures with the actual size and drainage capacity are involved in the hydrodynamic model.
The control structures in the MIKE11 are calculated at the discharge computation points[16]. The pump station in the model is equivalent to two flow boundaries at the upstream and downstream cross sections. All sluices in the model are simulated with the underflow structures. The discharge through the gate can be calculated with the following equations:

whereQis the discharge through the gate,Qfis the discharge under the free flow condition,Qdis the discharge under the drowned flow condition,Qcis the discharge under the critical flow condition,bis the width of the gate,wis the gate opening height,andy2are the water depths in the upstream and the downstream of the gate, respectively,h1andh2are the water levels in the upstream and the downstream of the gate, respectively,ysis the water depth at the contraction section behind the gate, which is considered to be equal to 0.63 times of thewin the present study,Fris the Froude number,Cdis the effective discharge coefficient and equal toin the present study[16].
According to the current flood control planning, every sluice or pump station is automatically operated according to the water level at the special gaugingstation. The operating rules of the control structures are listed in Table 1. In the present study, the opening speed for all sluices is set to 0.04 m/s. The rate of the discharge change for all pumps is set to 0.1 m3/s.

Table 1 Operating rules of the control structures in the model
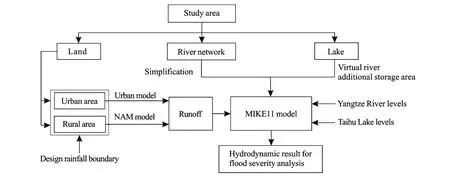
Fig.4 The relationship of basic components of the model
1.3 Hydrologic and hydrodynamic models settings
The hydrodynamic model of the Suzhou District is established with the MIKE11 software. The software enables many lumped hydrologic models such as the NAM and Urban to be coupled with the 1-D hydrodynamic model. The Urban Model-B of the MIKE11 software which is based on the kinematic wave method and the Horton equation is employed in the present study[16]. This model is very applicable for the fast urbanization region like the Suzhou district. Moreover, it allows flexible control rules to be set for sluice and pump operating. The basic component relationship of the model is shown in Fig.4.

Fig.5 The sub-catchment division of the study area (the patches with different shades represent different sub-catchments, and each sub-catchment consists of many small areas which are connected to the river segments
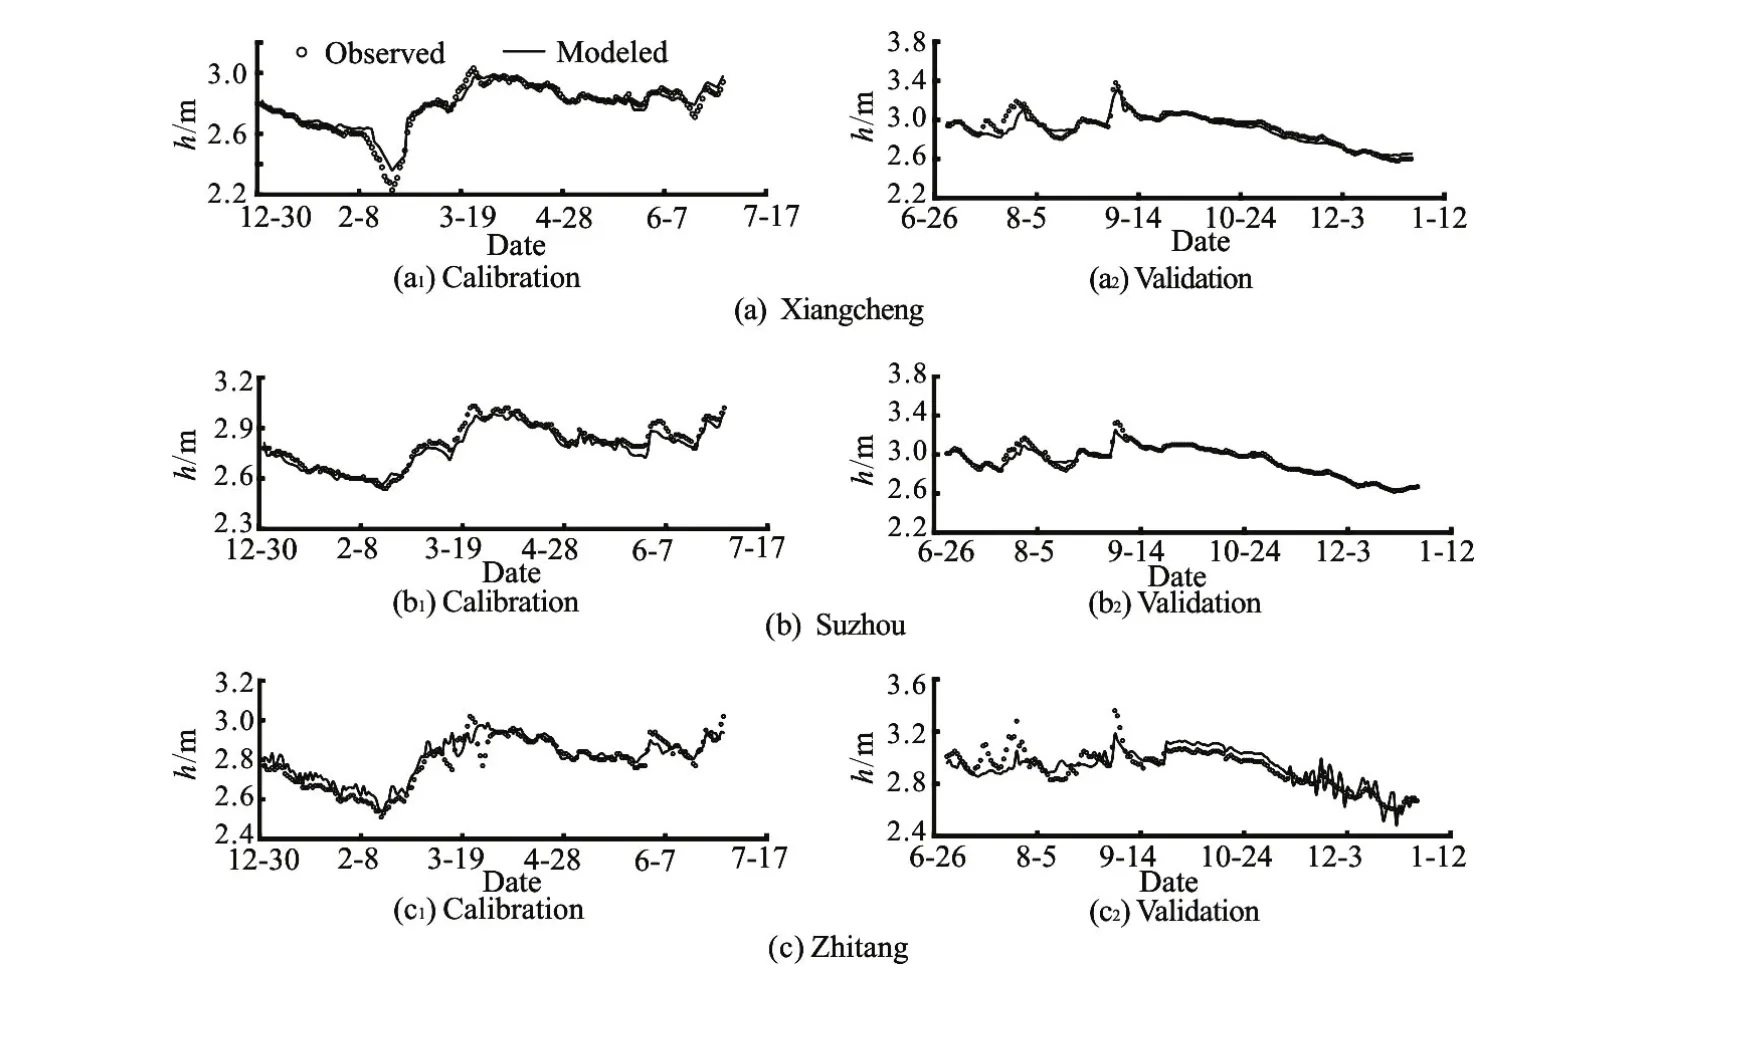
Fig.6 Comparison of modelled and observed water levels at three stations in 1988

Table 2 Error analysis results at 10 water level stations
Based on the Euclidean Allocation tools of the ArcGIS software, the study area is divided into 13 subcatchments (Fig.5). The urbanization regions of each city are represented by the circles with an equal area of the built-up region. The percentages of the impervious and pervious areas which are utilized to drive the hydrologic model are according the Suzhou Statistical Yearbook 2014. Each sub-catchment consists of many small areas which are connected to the river segments.
1.4 Model calibration and validation
Both the water level and the discharge are parameters to be calibrated for the 1-D hydrodynamic model. However, it may be difficult to accurately estimate the discharge due to the use of simplified river networks in the model. Therefore, the water level is selected as the calibration and validation target in the present study. The year of 1988 is a typical median water year in terms of the water level and the rainfall intensity. Using the hydrological data of this year to conduct the model calibration and validation can avoid the changes of the operating rules to have a great impact on the modelling results. The daily water level and rainfall data are utilized to construct the boundary conditions. The period from 1st January to 30th June is used for calibration, and the period from 1st July to 31st December is for validation. The Xiangcheng, Suzhou and Zhitang Stations are selected as the representatives of the water level stations in the middle of the study area, near the Taihu Lake and near the Yangtze River, respectively. Figure 6 shows the comparison between the modelled and observed water levels (h) at the three stations. It shows that the agreement is acceptable, and the error is smaller when the water level is low. The results of the Zhitang Station indicate that the water level near the Yangtze River is strongly influenced by the tide. In general, both of the modelled flood peak and duration are consistent with the observed data. Similar results are obtained at other stations.
Further, the mean absolute error (MAE), the standard deviation of the absolute error (σAE) andthe correlation coefficient (R) are used to evaluate the reliability of the model (Table 2), and the related equations are given below:
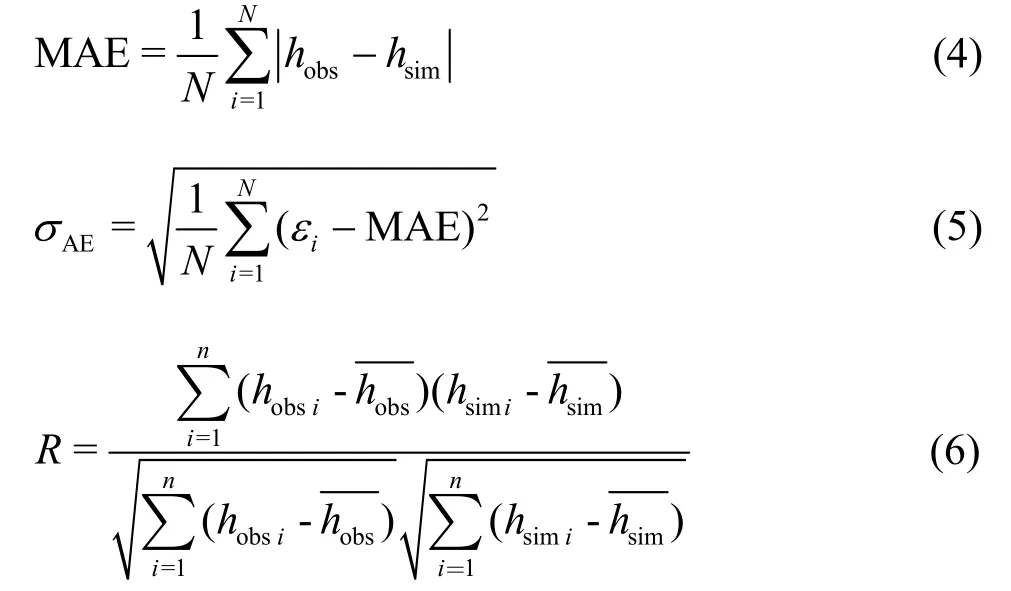
wherehobsis the observed water level,hsimis the simulated water level,εiis the absolute water level error at pointi.
The maximum error of the validation period is larger than that of the calibration, but the MAE of both periods are approximately less than 0.1 m, as is complied with the current procedures. TheσAEandRresults also indicate that the water level stations near the Yangtze River give more oscillatory results than other stations. Overall, the water level accuracy is considered adequate for the purpose of this study.
1.5 Rainfall design
The most serious flood event in the study area during the 20th century happens in 1999. Despite a large number of flood control measures, the water level of the Taihu Lake still reaches a record height, and the direct economic losses amount to 1.410×10¹⁰yuan[16]. The data indicate that the 15 d cumulative precipitation from 16th June to 30th June plays an important role in causing the heavy flood. The observed flood level in many places of the study area reaches that for the return period of 200 years[16].
According to the latest flood control planning, the flood protection standards for the inside and the outside of the LEP are in the 200-year and 100-year flood levels, respectively. For validating the current flood control system and assessing the flood risks in the future, the more serious scenarios for the return period of 200 years (involving the rainfall and water levels) are considered in the present study.
The observed rainfall data at the Suzhou Station are utilized to represent the rainfall within the LEP. Rainfall outside the LEP is represented by the arithmetic average rainfall data at the stations outside the LEP. The homogeneous frequency enlargement method is employed to calculate the design rainfall based on the daily rainfall data from 16th June to 30th June in 1999, and the 15 d rainfalls are for the same return period of 200 years. The design rainfall of 15 d duration is shown in Fig.7(a). The cumulative precipitation inside and outside the LEP are 576.0 mm and 518.0 mm, respectively. For a small domain, the temporal rainfall process would have a large impact on the hydrodynamic characteristics of the river networks. The design rainfall within the LEP reaches 244.4 mm on 30th June. The sluices and the pumps would be frequently operated during the day. Thus, the homogeneous multiple enlargement method is employed to calculate the hourly rainfall process on 30th June based on the observed data of the Suzhou Station. Figure 7(b) shows the design rainfall results in the LEP on 30th June, and the largest rainfall intensity of 32.73 mm/h is reached.
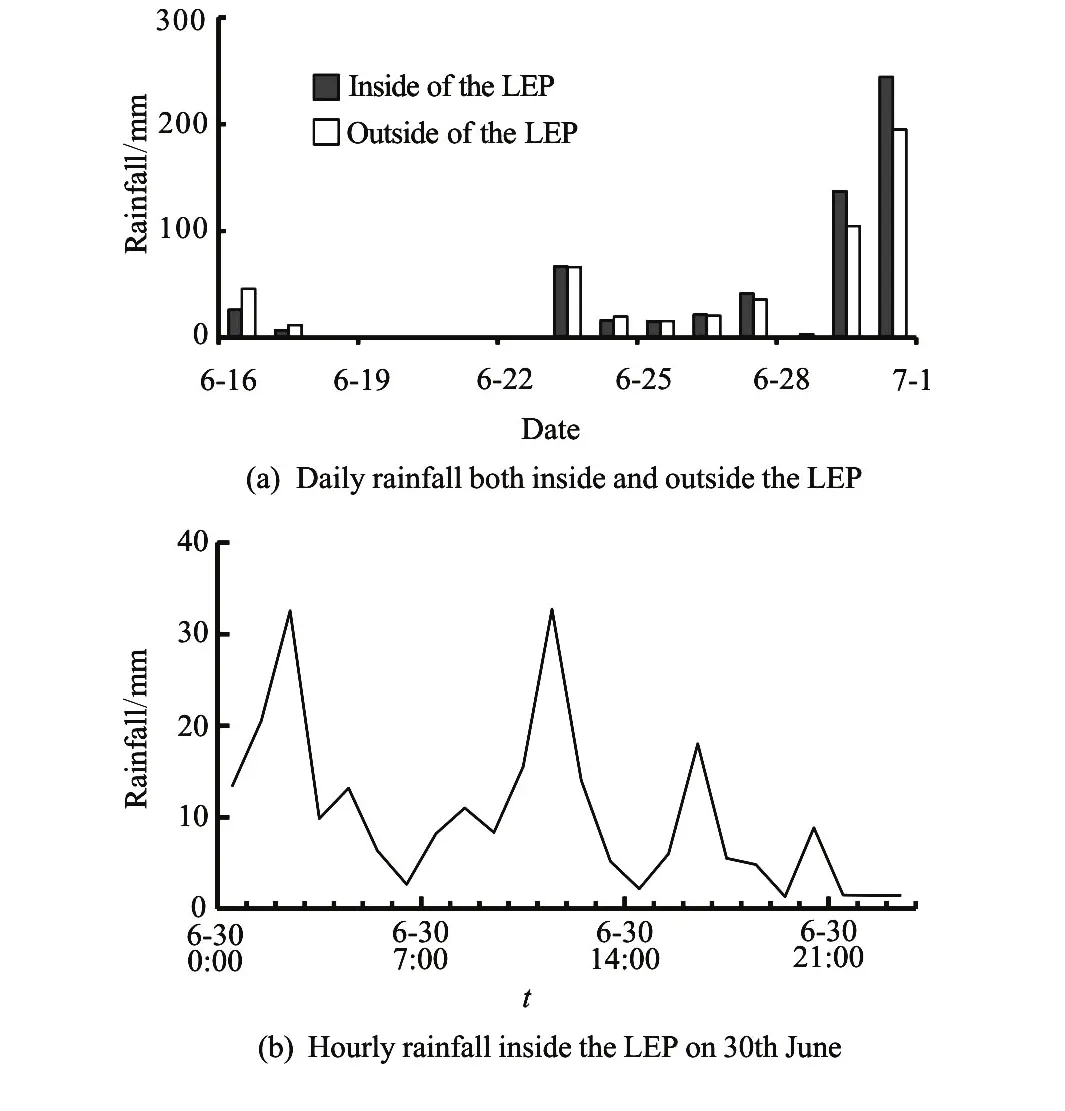
Fig.7 The design rainfall from 16th June to 30th June in 1999
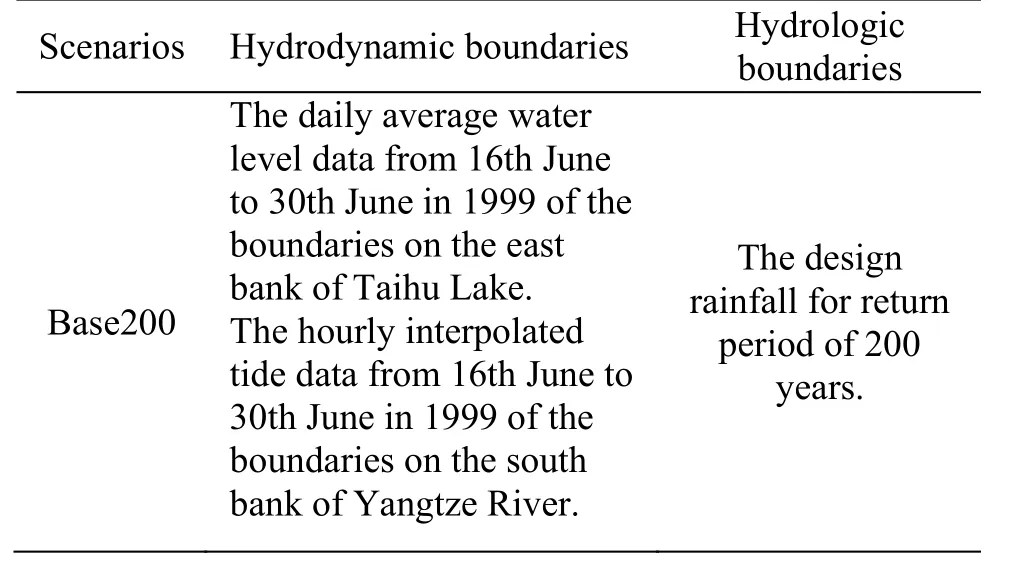
Table 3 Boundary conditions of the baseline scenarios
The scenario under the design rainfall and the observed water level boundaries in 1999 is constructed for validating the current flood control system. Also, it can be utilized as the baseline scenario to becompared with the future scenario. The detail information of the hydrologic and hydrodynamic boundary conditions is shown in Table 3.
1.6 Future scenario setting
Liang et al.[11]indicated that a higher sea level would lead to a higher tide level in the East China Sea. According to Li[17], the sea level in the East China Sea will rise until the 2050s according to the Special Report on Emissions Scenarios (SRES) A1B scenario, and the rising rate is about 3.7 mm/a. It is lower than the predicted rising rate of 4.87 mm/a by using the Topex/Poseidon altimeter data during the period 1993-2005. However, the tide level rising rate near the Suzhou Catchment is mainly influenced by the upstream discharge of the Yangtze River[1]. Gong et al.[1]predicted that the tide level rise near the Suzhou Catchment is approximately 6.6 mm/a based on the data corrected by the upstream discharge increment. Therefore, we assume that the tide level near the Suzhou Catchment in 2050 may be about 0.3 m higher than in 1999. This estimation is more serious than under the SRES A1B scenario, and close to the estimated value based on the observed data. The tidal wave characteristics change slightly in the nearshore areas of the Yangtze Estuary, which involve the tidal amplitude and duration[1]. Thus 0.3 m of the observed tide level data is added to the boundary conditions along the southern bank of the Yangtze River directly.
Many researches focused on the extreme rain induced by the climate change in the Taihu Basin[13]. To investigate the extreme scenarios, the relatively more serious conclusion of Li et al.[18]is adopted. The rainfall intensity is expected to increase 20% under the SRES A1B scenario by the 2050s.
It is difficult to determine the boundaries for the eastern bank of the Taihu Lake in the future scenario. The constructions of the control structures around the Taihu Lake might be more complete in the future. The drainage capacity may significantly increase. Therefore, it is assumed that the water level of the eastern bank of the Taihu Lake will not exceed the record height in 1999 under the extreme scenario.
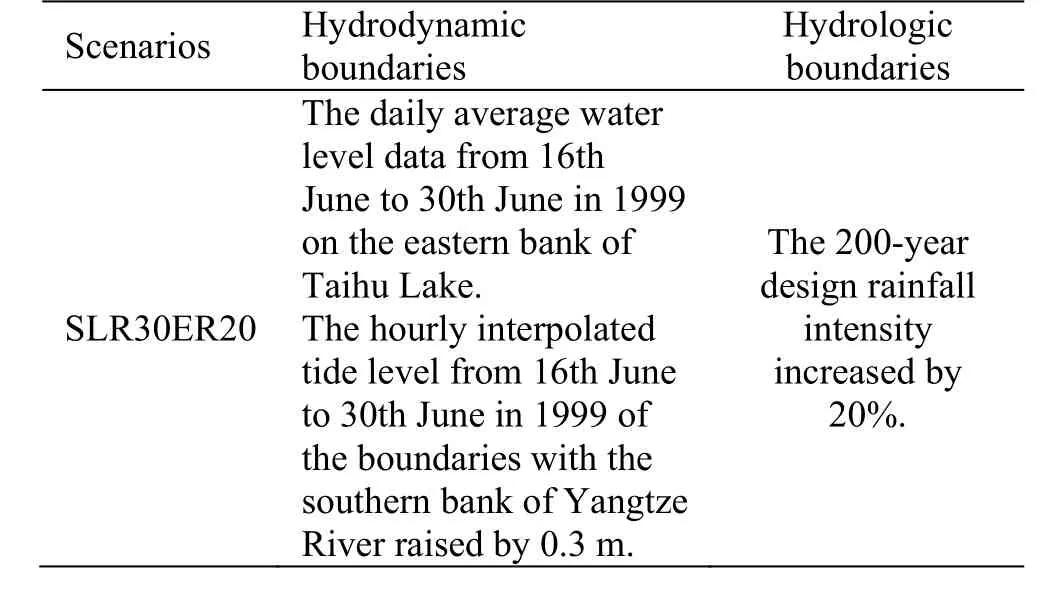
Table 4 Boundary conditions of the combined ER with SLR scenario
Based on the available data and the preceding analysis, the scenario is constructed with the sea level being raised by 0.3 m, which is combined with the fact that a 200-year design rainfall intensity might be increased by 20%. It is the extreme condition that possibly occurs in 2050 under the SRES A1B scenario. The boundary conditions of this scenario are listed in Table 4
2. Results and discussions
2.1 Evaluation parameters
Using the above model, the hydrological and hydrodynamic simulations of the two design scenarios are performed. As the hydrodynamic model in the present study is the in-bank model, the flood severity cannot be directly estimated from the inundation area. Therefore, based on the assumptions that there are sufficient human and material resources to ensure that the dike will not be breached and overtopped, the following parameters are utilized to estimate the flood severity of the study area.
Firstly, the hierarchical flood control system divides the study area into two regions, the inside and the outside of the LEP. The highest water levels in the two regions can reflect the flood risk under design scenarios. Especially the highest water level in the LEP can be utilized to examine the effectiveness of the flood control measures.
Secondly, as shown in Fig.3, the sluices along the east bank of the Taihu Lake guide the flow into the study area, whereas the structures along the south bank of Yangtze River guide the flow out of the study area. Therefore, the total net outflow flux of the structures along the Yangtze River and the total net inflow flux of the structures along the Taihu Lake can reflect the SLR and ER influences on the water exchange in the study area. They can be calculated with the following equations.

whereFinis the total net inflow flux of the structures along the Taihu Lake,qin(t) is the discharge of a sluice along the east bank of the Taihu Lake,Foutis the total net outflow flux of the structures along the Yangtze River,qout(t) is the discharge of a sluice or pumps along the south bank of the Yangtze River, andTis the simulating period.
The largest water volume in the rivers of the entire study area which can provide a reference for theconstruction of the flood detention area is given as

Table 5 Results of the parameters for evaluating the flood severity under design scenario

whereis the water volume of riveriat timet,nis the number of rivers in the study area.
At last, the cost of increasing the height of the flood dikes is used to estimate the economic cost of the flood. The relationship between the added height and the costs per meter dike is given as

whereC(x) is the emergency height cost per meter dike,xis the added height, which is equal to the simulated water level minus the current dike elevation. The current dike elevation data are provided by the flood control planning of the study area.
The total emergency dike height cost of the study area can be calculated as

whereCtis the total height cost of the study area,is the height cost per meter dike of the riveri,the length of the riveri.
2.2 Modelling result analysis
Table 5 shows the results of the parameters for estimating the flood severity.HinandHoutare the highest water level inside and outside the LEP, respectively. TheHinis 3.462 m under the baseline scenario. When the design extreme scenario happens, theHinis raised to 3.569 m, but it is still 0.231 m lower than the warning level (3.8 m). It is indicated that the Suzhou downtown could withstand the 200-year flood under the protection of the LEP, and it is safe even under the extreme scenario in the future. TheHoutis 5.932 m under the extreme scenario, and it exceeds the highest dike elevation in the study area. It can be inferred that the dike in the Suzhou is at the great overtopping risk in the case.
TheVmaxis 1.641×10⁹m3under the baseline scenario and it is increased by 6.58% under the extreme scenario. Considering that the water of the baseline scenario can almost be stored after the planned flood control system is completed, the capacity of the flood detention area could be estimated based on the result of this parameter.
TheFinandFoutcontrol the direct water exchange between the study area and the outside region. TheFinis a vital parameter for making the flood control planning, and it is the indicator to determine the whereabouts of the Taihu Lake flood. The modelling results show that it would be reduced by 12.08% under the extreme scenario, thus could lead to a high water level of the Taihu Lake as a serious threat for the whole basin. For theFout, even the SLR has an obvious adverse effect on draining the flood into the Yangtze River, it is still increased by 3.2% because of the rainfall intensity increase.
The total emergency dike height cost of the study area (Ct) is 5.281×10⁶RMB under the baseline scenario, and it is increased to 2.198×10⁷RMB under the extreme scenario. The total increment ratio reaches 316.26%. It shows that the number of rivers which would be overtopped is dramatically increased in the future. The economic loss caused by the 1999 flood of the study area is about 1.322×10⁹[19]. In contrast, the total dike height cost is very low. Therefore, strengthening the dike construction can effectively reduce the impact of the future extreme flood. The parameter could give an economic estimate for the flood based on the in-bank model, and it can easily be utilized to make the emergency decisions for the flood control.
Both the land cover and the climate changes have influences on the flood risks in the urban area. Although the changes of the observed climate extremes in the global urban areas see no evident increases in the frequency of daily precipitation extremes and in the annual maximum precipitation[19], the importance of estimating the future flood risks under the extreme weather is well understood. The recent achievements for warning systems of the European Precipitation Index based on the simulatedClimatology (EPIC)[20]and the exceedance probabilities of the coastal flooding based on the interpolated Pareto cumulative distribution[21]can provide references for plain river network regions like the Suzhou District.
The optimization of the control structure system is an effective way to mitigate the flood risks in the plain river network region. Lin and Su[22]employed the discrete differentiation and the dynamic programming (DDDP) method to calculate the optimal operating rules of a river network catchment in Zhejiang Province, China. However, the great number and the complexity of river networks and control structures in the Suzhou Catchment make it more difficult to make such an optimization. The recent researches on the adaptive fuzzy logic controller method[23], the structural methods to determine proper locations based on genetic algorithm[24], and the Backward Propagation Neural Networks (BPNN)[25]technologies could be used to optimize the control rules and minimize the cost of protective levees’ construction in the Suzhou District.
3. Conclusion
In the present study, the hydrologic and hydrodynamic processes of the complex river network in the Suzhou district are modelled. The hierarchical flood control system in the study area is simplified to 65 control structures. The actual discharge capacity and the operating rules of these control structures are put into the model. The lumped hydrologic models, which are suited for the urban and rural areas, are employed to simulate the rain-runoff process. Based on the observed data and existing researches, the scenarios of the current flood control planning and the future extreme condition are designed, respectively. The modelling results indicate that the existing flood control system could prevent the Suzhou Downtown from inundation in the future. The difficulty of draining the Taihu Lake floods should be given attention to avoid the severe flood hazard in the future. The capacity of the flood detention region would be increased by 6.58% of the current planning capacity. Compared with the economic loss caused by the flood, the total emergency dike height costs are very low. Thus, strengthening the dike construction can effectively reduce the impact of the future extreme flood. The results can provide a reference for the dike construction planning. The modelling approach and the evaluation parameters are found to be effective for the flood severity estimation of the catchment similar to the Suzhou District.
Acknowledgment
This work was supported by the Innovation Research Project for Postgraduate in Jiangsu Province (Grant No. CXZZ13_0252), the 111 Project (Grant No. B17015).
[1] Gong Z., Zhang C. K., Wan L. M. et al. Tidal level response to sea-level rise in the Yangtze Estuary [J].China Ocean Engineering, 2012, 26(1): 109-122.
[2] Pachauri R. K., Meyer L., Plattner G. K. et al. IPCC, 2014: Climate Change 2014: Synthesis Report. Contribution of Working Groups I, II and III to the Fifth Assessment Report of the Intergovernmental Panel on Climate Change[R]. IPCC, 2015.
[3] Han L. F., Xu Y. P., Pan G. B. et al. Changing properties of precipitation extremes in the urban areas, Yangtze River Delta, China, during 1957-2013 [J].Natural Hazards, 2015, 79(1): 437-454.
[4] Zhang Q., Xu C. Y., Zhang Z. et al. Spatial and temporal variability of precipitation maxima during 1960-2005 in the Yangtze River basin and possible association with large-scale circulation [J].Journal of Hydrology, 2008, 353(3): 215-227.
[5] Mendizabal M., Sepúlveda J., Torp P. Climate change impacts on flood events and its consequences on human in Deba River [J].International Journal of Environmental Research, 2014, 8(1): 221-230.
[6] Milly P., Wetherald R., Dunne K. et al. Increasing risk of great floods in a changing climate [J].Nature, 2002, 415(6871): 514-517.
[7] Hirabayashi Y., Mahendran R., Koirala S. et al. Global flood risk under climate change [J].Nature Climate Change, 2013, 3(9): 816-821.
[8] Hunt A., Watkiss P. Climate change impacts and adaptation in cities: A review of the literature [J].Climatic Change, 2011, 104(1): 13-49.
[9] Han S. Q., Xie Y. Y., Li D. M. et al. Risk analysis and management of urban rainstorm water logging in Tianjin [J].Journal of Hydrodynamics, Ser. B, 2006, 18(5): 552-558.
[10] Liu L., Xu Z. X., Reynard N. S. et al. Hydrological analysis for water level projections in Taihu Lake, China [J].Journal of Flood Risk Management, 2013, 6(1): 14-22.
[11] Liang Q., Smith L., Xia X. New prospects for computational hydraulics by leveraging high-performance heterogeneous computing techniques [J].Journal of Hydrodynamics, 2016, 28(6): 977-985.
[12] Wicks J. M., Hu C., Scott M. et al. A broad scale model for flood simulation in the Taihu Basin, China [J].Journal of Flood Risk Management, 2013, 6(1): 33-41.
[13] Xu Z. X., Liu L. Detection of climate change and projection of future climate change scenarios in Taihu Lake Basin [J].Advances in Science and Technology of Water Resources, 2012, 32(1): 1-7.
[14] Yu C., Hall J. W., Cheng X. et al. Broad scale quantified flood risk analysis in the Taihu Basin, China [J].Journal of Flood Risk Management, 2013, 6(1): 57-68.
[15] Cheng X. T., Evans E. P., Wu H. Y. et al. A framework for long-term scenario analysis in the Taihu Basin, China [J].Journal of Flood Risk Management, 2013, 6(1): 3-13.
[16] Ou Y., Wu H. The Taihu Basin flood in 1999 [M]. Beijing, China: China Water and Power Press, 2001 (in Chinese).
[17] Li J. Sea level variation and its effect on storm surge in the East China Sea [D]. Master Thesis, Qingdao, China:Ocean University of China, 2011(in Chinese).
[18] Li S. L., Han L., Bian J. Projecting heavy rainfall events in the middle and lower reach of the Yangtze River valley in the 21st century based on IPCC AR4 simulations [J].Torrential Rain and Disasters, 2012, 31(3): 193-200(in Chinese).
[19] Mishra V., Ganguly A. R., Nijssen B. et al. Changes in observed climate extremes in global urban areas [J].Environmental Research Letters, 2015, 10(2): 024005.
[20] Alfieri L., Thielen J. A European precipitation index for extreme rain-storm and flash flood early warning [J].Meteorological Applications, 2015, 22(1): 3-13.
[21] Kriebel D. L., Geiman J. D., Henderson G. R. Future flood frequency under sea-level rise scenarios [J].Journal of Coastal Research, 2005, 31(5): 1078-1083.
[22] Lin B. X., Su X. G. Optimal dispatching of flood control system for sluice groups in plain dike areas [J].Journal of Zhejiang University (Natural Science), 1996, 30(6): 652-663(in Chinese).
[23] Sabzi H. Z., Humberson D., Abudu S. et al. Optimization of adaptive fuzzy logic controller using novel combined evolutionary algorithms, and its application in Diez Lagos flood controlling system, Southern New Mexico [J].Expert Systems with Applications, 2016, 43(C): 154-164.
[24] Haddad O. B., Ashofteh P. S., Mariño M. A. Levee layouts and design optimization in protection of flood areas [J].Journal of Irrigation and Drainage Engineering, 2015, 141(8): 04015004
[25] Gu Z. H., Cao X. M., Liu G. L. et al. Optimizing operation rules of sluices in river networks based on knowledge-driven and data-driven mechanism [J].Water Resources Management, 2014, 28(11): 3455-3469.
(Received July 27 2015, Revised January 25, 2016)
* Project supported by the National Key Research and Development Program of China (Grant No. 2017YFC0405600, 2016YFC0401503), the Special Fund for Public Welfare of Water Resources Ministry (Grant No. 201501007, 201201017) and the State Key Pro- gram of National Natural Science of China (Grant No. 51239003).
Biography:Zi-jun Hu (1988-), Male, Ph. D.
Ling-ling Wang,
E-mail: wanglingling@hhu.edu.cn
- 水动力学研究与进展 B辑的其它文章
- Spatial relationship between energy dissipation and vortex tubes in channel flow*
- Numerical analysis of flow separation zone in a confluent meander bend channel*
- Mechanics of granular column collapse in fluid at varying slope angles*
- Numerical simulation of submarine landslide tsunamis using particle based methods*
- Double-averaging analysis of turbulent kinetic energy fluxes and budget based on large-eddy simulation*
- The influence of wave surge force on surf-riding/broaching vulnerability criteria check*

