Double-averaging analysis of turbulent kinetic energy fluxes and budget based on large-eddy simulation*
Xu Han (韩旭), Guo-jian He (何国建), Hong-wei Fang (方红卫)
Department of Hydraulic Engineering, Tsinghua University, State Key Laboratory of Hydro-Science and Engineering, Beijing 100084, China, E-mail: hanxu16@mails.tsinghua.edu.cn

Large eddy simulation (LES), turbulent kinetic energy (TKE) fluxes, turbulent kinetic energy budget, double-averaging analysis
Introduction
The study of the turbulent flow over a permeable bed is considered to be highly important in the hydraulic engineering. Although nearly all natural channels have permeable beds such as gravel-bed rivers, very little research effort was taken to study the effect of the channel bed permeability on the mean and instantaneous flows, especially the turbulent kinetic energy fluxes and budget, which play dominant roles in the overall structure of the mean near-bed turbulence of permeable bed flows.
In most studies, the time-averaging assumptions are modified and applied in the vicinity of the rough beds, in which the time-averaged flow is locally threedimensional and heterogeneous in space. To resolve the spatial heterogeneity, the double-averaging (DA)method is adopted, where the time-averaging of Navier-Stokes equation is supplemented by the space averaging. The DA method potentially offers new insights into the effects of the macro-roughness element on the mean benthic hydrodynamics, particularly, when it is combined with a local flow analysis. This method was originally developed for atmospheric boundary layer studies[1]and was applied by Ojha and Mazumber[2]. They carried out the averaging of the time-averaged velocity along the lines of constant distance from a wavy bed. The work of Nikora et al.[3], which is revisited in the framework of river hydraulics, consists of averaging the Navier-Stokes equations in time and space over an area contained in a plane parallel to the flow direction. In addition, the doubleaveraging is also applied to the fluid momentum equations and the advection-diffusion equations. Dey and Das[4]and Mignot et al.[5]examined the DA Reynolds shear stress (RSS), the turbulent kinetic energy (TKE) flux, and the budget in the flows over a bed of angular crushed stones.
However, in a layer near the rough bed, the flow is extremely heterogeneous, which increases the difficulty of measuring accurately the flow quantities.
Additionally, the DA method remains severely limited due to the lack of measuring tools that can provide a large-scale and three-dimensional turbulent structure. Therefore, a numerical model is an important tool to improve understanding of the physics of these complex flow dynamics. In the traditional numerical simulation, the Reynolds-averaged Navier-Stokes model is applied widely[6]. But the vortex or the instantaneous quantities can not be obtained. The large-eddy simulation (LES) is a more advanced approach in the computational fluid dynamics. Stoesser and Nikora[7]performed an LES of the turbulent flow over square ribs mounted on the wall. Fang et al.[8]calculated the non-submerged groin flow in a shallow open channel by using the LES.
To understand turbulence, many researchers focused on the TKE budget and fluxes, as the key indices for understanding the turbulence processes and scales throughout the water column. Most openchannel studies locate the maximum TKE production and turbulent diffusion at the bed[9-11]. However, Bagherimiyab and Lemmin[12]showed that the peak of the turbulence activity occurs in the vicinity of the canopy crest. The differences are mainly due to the resolution close to and within the roughness elements. Additionally, Dey and Das[4]indicated that the fluxes directed downward and downstream are composed of sweep events, and an upstream transport of the TKE fluxes in the upper layer of the flow is due to the inertia of the fluid streaks. However, few studies[13,14]measured the mean TKE fluxes oriented towards the bed in the inner flow region defined asTherefore, further investigations of the TKE budget and fluxes in the turbulent flow over a permeable bed are desirable.
This paper first introduces the DA method for the analysis of the turbulent characteristics near and above the roughness bed. Because the flow within and over a permeable bed is not fully understood, the LES model is used to explore the flows, especially, the TKE fluxes and the TKE budget. The model is validated by several experiments, with a good agreement. The existence of vortex structures is demonstrated. It is shown that near the virtual bed level, the form-induced diffusion rate is significant. The TKE production and the dissipation rate attain peaks at the crest bed level.
1. DA method and numerical model
1.1 DA method
The DA method involves the time averaging conceptually supplemented by the area averaging in the layer parallel to the mean bed surface. In a traditional Reynolds decomposition, the local instantaneous flow quantityθcan be decomposed as follows

whereis the local time-averaged flow quantity andθ′ is the fluctuations of the local instantaneous flow quantityθfrom the local time-averaged flow quantityAdditionally, in the DA method, the local time-averaged flow quantity is decomposed as follows

1.2 Governing equations and subgrid-scale modeling
In the LES model, the eddies larger than the grids are resolved, while the eddies smaller than the grids are modeled. The Navier-Stokes continuity and momentum conservation equations for the incompressible flow without consideration of the density variation can be written as:
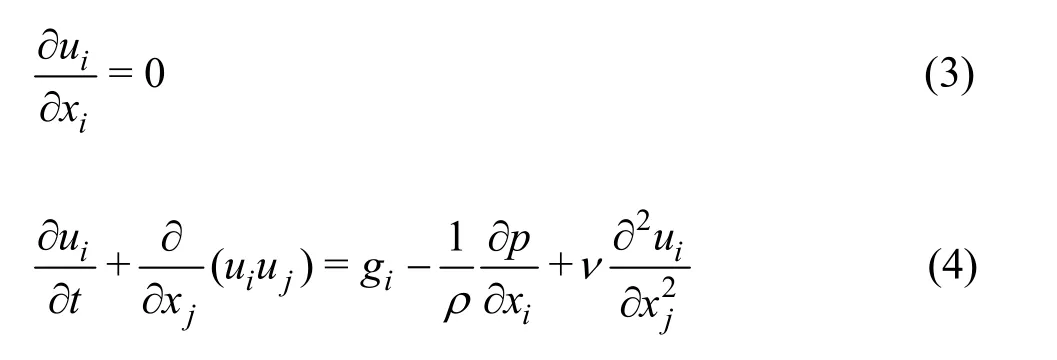
whereis the component of the velocity vectoru,pis the pressure,νis the kinematic viscosity of the fluid, andgiis theith component of the gravity acceleration. To simplify these nonlinear equations, it is assumed that the pressure contains two parts:, wherepsis the hydrostatic pressure, andpdis the dynamic pressure. Then

For convenience, we usepto meanpdin the following discussions. The equations are normalized by the water depthH, the bulk velocityUand the reference pressure2Uρ. Then, they are filtered with
Additionally, the DA method remains severely limited due to the lack of measuring tools that can provide a large-scale and three-dimensional turbulent structure. Therefore, a numerical model is an important tool to improve understanding of the physics of these complex flow dynamics. In the traditional numerical simulation, the Reynolds-averaged Navier-Stokes model is applied widely[6]. But the vortex or the instantaneous quantities can not be obtained. The large-eddy simulation (LES) is a more advanced approach in the computational fluid dynamics. Stoesser and Nikora[7]performed an LES of the turbulent flow over square ribs mounted on the wall. Fang et al.[8]calculated the non-submerged groin flow in a shallow open channel by using the LES.
To understand turbulence, many researchers focused on the TKE budget and fluxes, as the key indices for understanding the turbulence processes and scales throughout the water column. Most openchannel studies locate the maximum TKE production and turbulent diffusion at the bed[9-11]. However, Bagherimiyab and Lemmin[12]showed that the peak of the turbulence activity occurs in the vicinity of the canopy crest. The differences are mainly due to the resolution close to and within the roughness elements. Additionally, Dey and Das[4]indicated that the fluxes directed downward and downstream are composed of sweep events, and an upstream transport of the TKE fluxes in the upper layer of the flow is due to the inertia of the fluid streaks. However, few studies[13,14]measured the mean TKE fluxes oriented towards the bed in the inner flow region defined asTherefore, further investigations of the TKE budget and fluxes in the turbulent flow over a permeable bed are desirable.
This paper first introduces the DA method for the analysis of the turbulent characteristics near and above the roughness bed. Because the flow within and over a permeable bed is not fully understood, the LES model is used to explore the flows, especially, the TKE fluxes and the TKE budget. The model is validated by several experiments, with a good agreement. The existence of vortex structures is demonstrated. It is shown that near the virtual bed level, the form-induced diffusion rate is significant. The TKE production and the dissipation rate attain peaks at the crest bed level.
1. DA method and numerical model
1.1 DA method
The DA method involves the time averaging conceptually supplemented by the area averaging in the layer parallel to the mean bed surface. In a traditional Reynolds decomposition, the local instantaneous flow quantityθcan be decomposed as follows

whereis the local time-averaged flow quantity andθ′ is the fluctuations of the local instantaneous flow quantityθfrom the local time-averaged flow quantityAdditionally, in the DA method, the local time-averaged flow quantity is decomposed as follows

1.2 Governing equations and subgrid-scale modeling
In the LES model, the eddies larger than the grids are resolved, while the eddies smaller than the grids are modeled. The Navier-Stokes continuity and momentum conservation equations for the incompressible flow without consideration of the density variation can be written as:

whereis the component of the velocity vectoru,pis the pressure,νis the kinematic viscosity of the fluid, andgiis theith component of the gravity acceleration. To simplify these nonlinear equations, it is assumed that the pressure contains two parts:, wherepsis the hydrostatic pressure, andpdis the dynamic pressure. Then

For convenience, we usepto meanpdin the following discussions. The equations are normalized by the water depthH, the bulk velocityUand the reference pressure2Uρ. Then, they are filtered withthe implicit spatial filter, and we obtain the equations used in the LES:
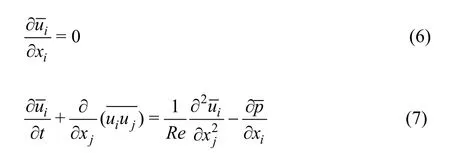

whereis the resolved strain-rate tensor.νtis the subgrid scale viscosity, which plays an important role in the accuracy of the simulation. Here,νtis computed from the dynamic subgrid scale model[15].
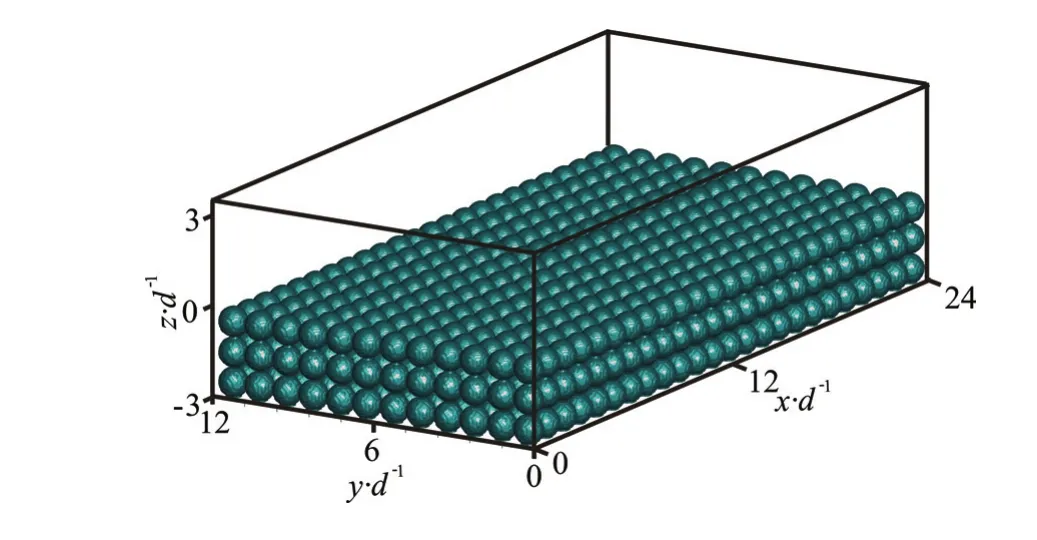
Fig.1 (Color online) Variation of roughness geometry
1.3 Computational overview
The computational setup is similar to that of the laboratory experiment by Manes et al.[16], where spheres are placed in three layers on the flat flume bottom of 24din the streamwise direction and 12din the spanwise direction, as shown in Fig.1. The water depth is 3.5 times the sphere diameter,d. The computational domain of the surface flow region covers an area of 6.8H×3.4H×H. The size is slightly larger than that of 2πH×πH×H. We include all relevant turbulence structures[17]. The bulk velocity in the inlet is set as 1, and the Reynolds number is 15 000. A very high resolution grid consisting of 4 800×2 400×130 points for the computation domain is employed. As shown in Fig.2(a), periodic boundary conditions are applied in the streamwise and spanwise directions, and the free surface is set as a frictionless rigid lid and is treated as a plane of symmetry. Based on the performance evaluation of different wall models, the 1/7th power law[18]is selected to model the flow near the spheres and the bottom.
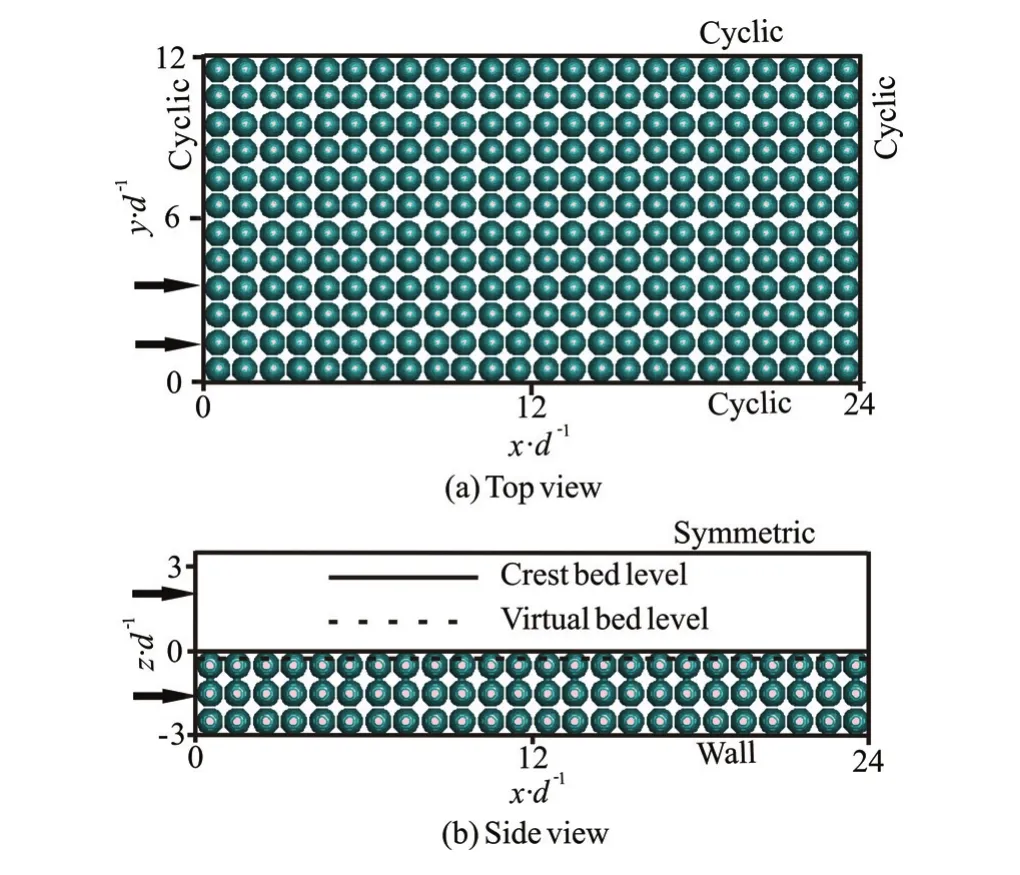
Fig.2 (Color online) Illustration of boundary conditions and sample positions
Figure 2(b) shows a longitudinal plane with a minimum porosity. Two types of levels are defined similar to Dey and Das[4]: one is the virtual bed level,z=-z0, that is considered to be the averaged bed surface fluctuation. The thicknessz0is determined as 0.2d. The other is the crest bed level,z=0, that is defined as the maximum crest level of the gravels.
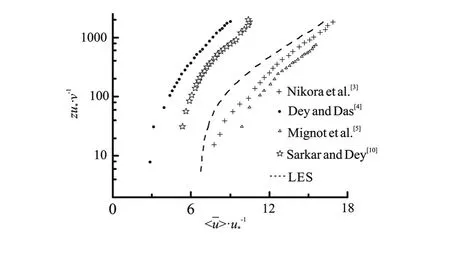
Fig.3 DA streamwise velocity profiles obtained from LES and data points of previous experimental studies
2. Results and discussions
2.1 DA velocity
Figure 3 shows the vertical profiles of the normalized DA streamwise velocity, where the data above the crest bed level follow well a logarithmic law.andzare scaled byu*andν,respectively, such thatandwhereu*is the shear velocity obtained from the Reynolds shear stress (RSS) profiles. The RSS profiles are extended to the crest bed level to determineas 0.133.

Fig.4 (Color online) Time-averaged streamlines and contours of mean streamwise velocities
Whenthe log law is considered as expressed in the following form

whereκis the von Karman coefficient,z0is scaled as, andksis the roughness height. We use the spheres of diameterdto represent the roughness, withandBis a constant. The parameters of the velocity distribution equation are estimated by using a nonlinear regression, and the values ofandκare obtained asand 0.286, with a correlation coefficient of 0.99. Note that the value ofs determined from the averaged bed surface fluctuations to be, which is quite close to the results obtained from the nonlinear regression. However, it is noted that the value of the von Karman coefficient obtained from the present measurements in the flow over a permeable bed is significantly smaller than the value of 0.4, which is commonly accepted for turbulent flows with impervious boundaries. This implies a change in the dissipation of the mean flow energy, and the transfer of the mean flow energy into the bed modifies the rate of dissipation in the bed region compared to the impervious bed. This is similar to the observation made by Chen et al.[19]. Mrokowska et al.[9]also found that the von Karman coefficient decreases with the increase of the infiltration capacity.
Figure 4 shows the time-averaged streamlines and the contours of the mean streamwise velocities with the maximum porosity and the minimum porosity, respectively. It can be seen that in the main surface water, the velocity remains nearly constant, but near the interface of the surface water and the subsurface water, the flow heterogeneity is evident from both the magnitude and the direction. Additionally, the vortex on the shoulder of the spheres and the shear penetration from the surface water to the pore can be seen in Fig.4.
2.2 Visualization of turbulence structures
The vortices originate near the crest bed level, and the existence of hairpin vortices and other vortices can be shown by the three-dimensional visualization through iso-surfaces of theQ-criterion[20].Qis the second invariant of the velocity gradient tensor and is defined as follows


Fig.5 (Color online) Vortical structures revealed by iso-surfaces of theQ-criterion
whereWijis an antisymmetric tensor andSijis a symmetric tensor. The positive values ofQindicate the regions in which the rotation dominates the strain, which makes it a more objective definition of thevortex. Figure 5 presents an instantaneous visualization of the flow field over the permeable bed. At the top of the spheres, there are a number of elongated structures that are the remaining legs of hairpin vortices between the spheres and above the crest bed level, and several spanwise vortices can be observed, which are generated from the flow separation at the upstream sphere crests. In addition, there are many small incoherent vortices near the crest bed level, resulting from a strong sweep event triggered by a hairpin vortex.
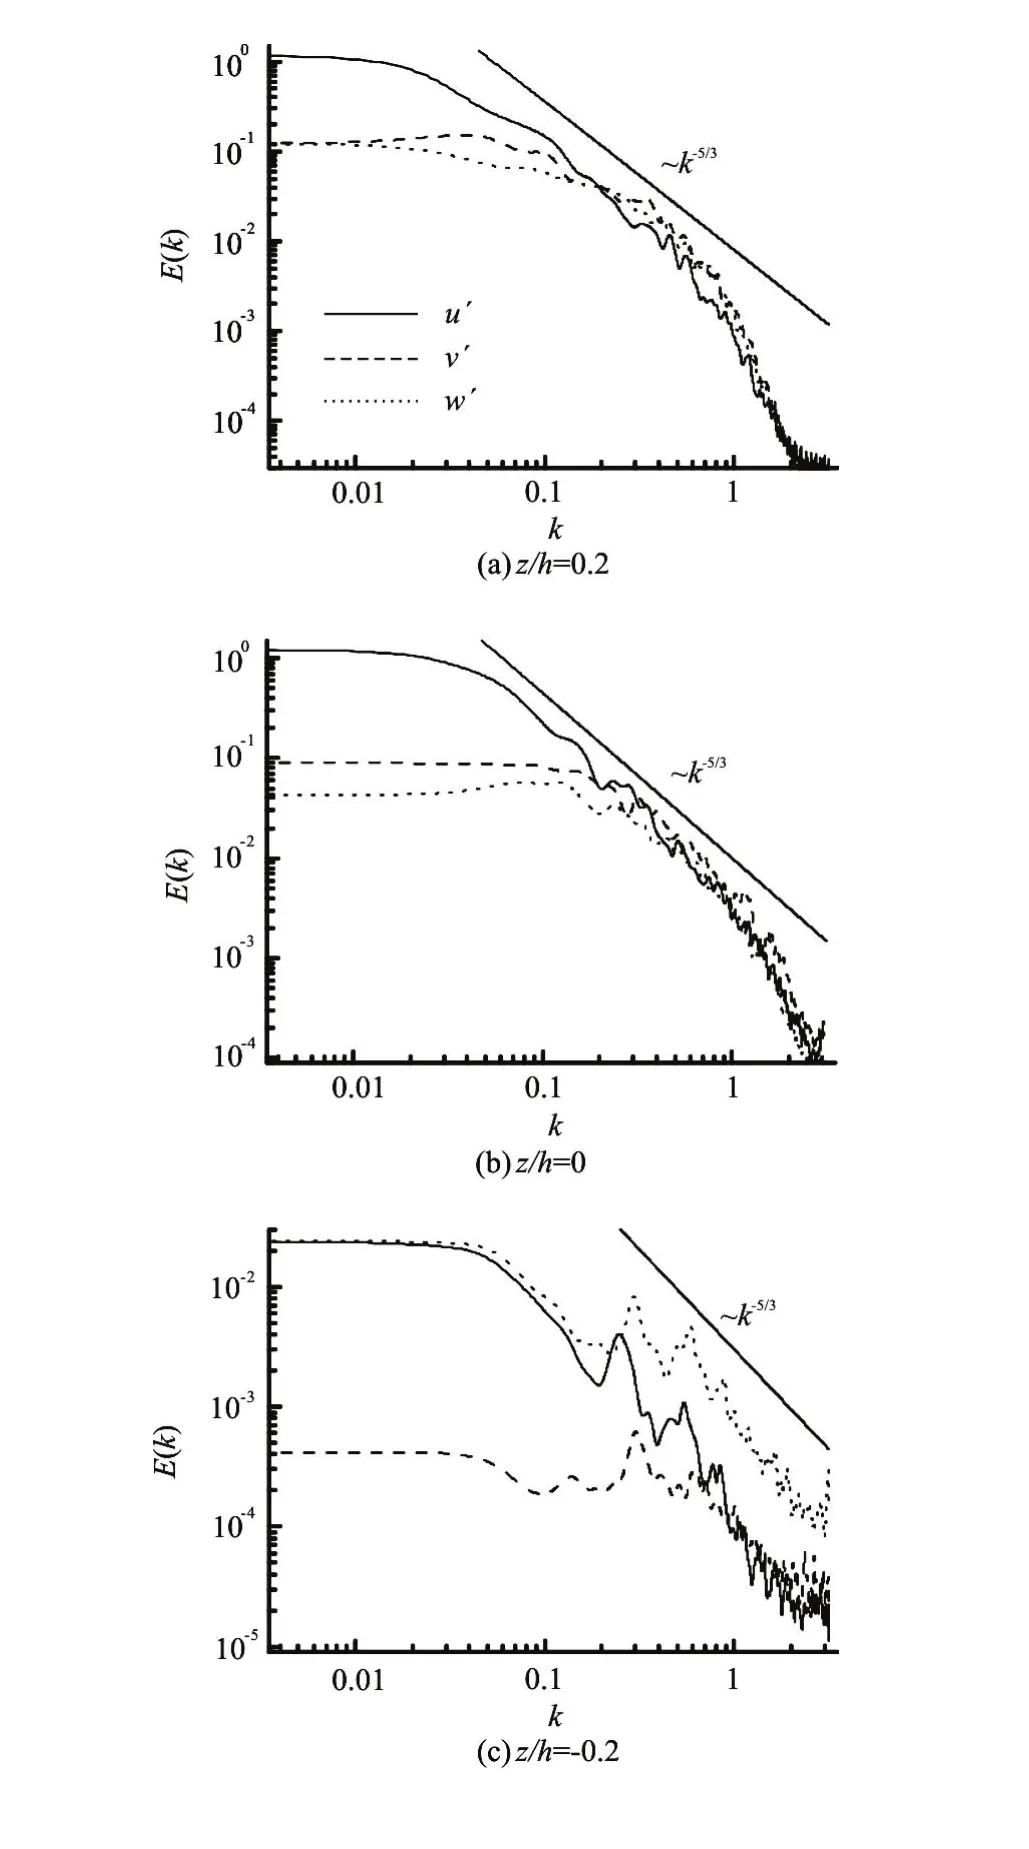
Fig.6 Wavenumber energy spectrum at elevationsz/h=-0.2,and
2.3 Wavenumber energy spectrum
Figure 6 presents the wavenumber energy spectrumat,andthat is located at the plane with the maximum porosity, wherekis the wavenumber. The area under the curve corresponds to the turbulent kinetic energy of the velocity componentsu,vandw. Hence, this plot clearly illustrates the contributions of different wavelengths to the turbulent kinetic energy. It is apparent that discrete spectral peaks do not exist whenk>0.2. This means that the signals fork≤0.2 are contained in the large-scale motions, whereas the signals fork>0.2 correspond to a pure turbulence. When 0.2≤k<1.1, the wavenumber energy spectrum provides a satisfactory fit with the Kolmogorov -5/3 scaling law, which means that the signals belong to an inertial subrange in which smaller eddies transfer the energy. The profiles depart from the Kolmogorov -5/3 line whenk≥1.1, which might be the result of the dissipation residue of the energy. Whenk>0.2 (a pure turbulence), andz/h=-0.2, the spectrum displays correlations between the velocity components asand there are some fluctuations aroundk=0.3. This suggests that the roughness produces greater velocity fluctuationsw′, meanwhile, it affects the damping of the spectral energy for the scales below the virtual bed level. However, whenandthe correlations becomeindicating that the magnitude of the energy is equivalent.
2.4 DA turbulent kinetic energy fluxes
The normalized DA streamwise TKE fluxand the vertical TKE fluxare defined as follows:

Figure 7 and Fig.8 show the normalized DA streamwise and vertical TKE fluxes,andcould be neglected whenThen, it starts to grow atbelow the virtual bed level and increases with the increase of, reaching its peak slightly under the crest bed level whereUp toz/h≈0.3, the magnitude ofreaches its minimum value of -1.67 and increases with the additional increase ofNear the water surface, the LES results show thatis positive. Therefore, when<0, the TKE flux transports in the downstream direction faster thanas indicated from the positive magnitude ofIn the upper layer of theflow, an upstream transport of the TKE flux, slower thanmay be caused by the inertia of the fluid streaks and may result in a negative magnitude ofNear the water surface, the TKE flux transports in the downstream direction again as implied by the positive values ofwhile there are no data obtained by experiment due to the limitations of the measuring equipment. The negativeappears at -0.26<z/h<0, suggesting a downward transport of the TKE flux, which is slower thanAbove the crest bed level,stays positive at the upper area of the flow region, indicating an upward transport of the TKE flux, that is faster than. The peak value of the negativeis -0.32, which is slightly under the crest bed level, and the peak value of the positiveis 0.46 atz/h≈0.3. These two curves are similar to those obtained by the experiments, but the peak location near the crest bed level is slightly higher than the experiment data. This may be caused by the regular bed form.
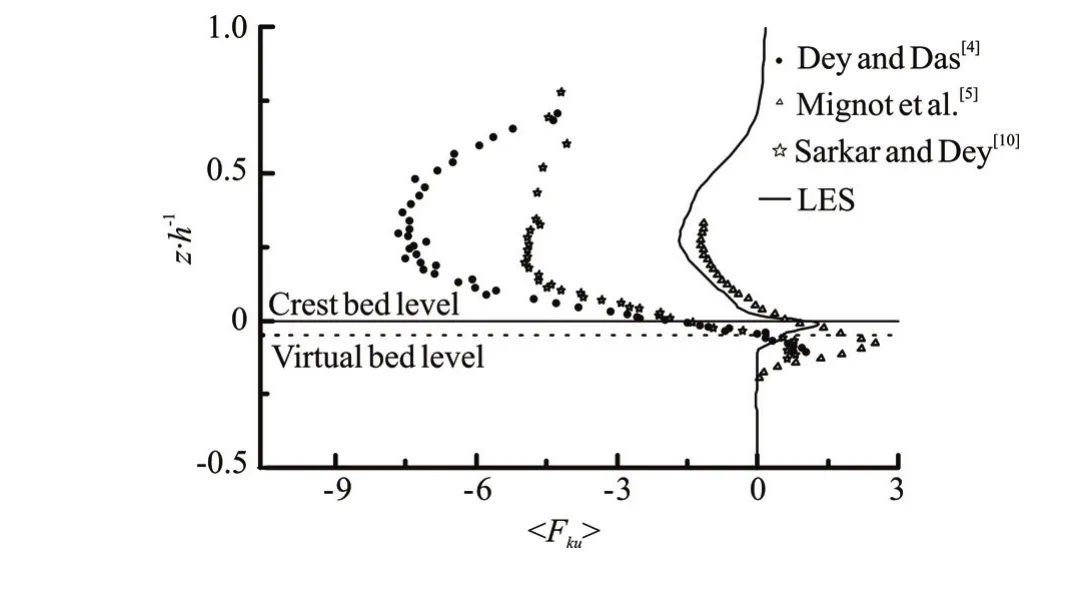
Fig.7 DA streamwise TKE flux against vertical distance
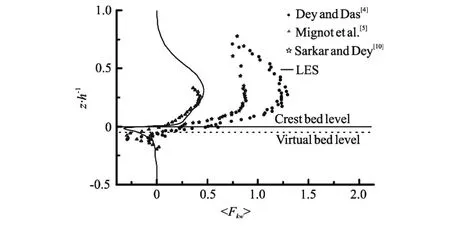
Fig.8 DA TKE vertical flux against vertical distance
2.5 DA turbulent kinetic energy budget
The double averaged TKE budget for a uniform flow over a gravel bed can be written as follows[21]
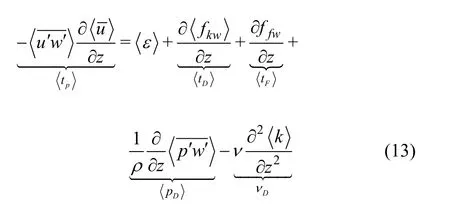

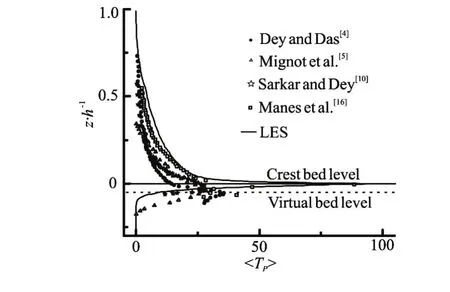
Fig.9(a) DA TKE production rate
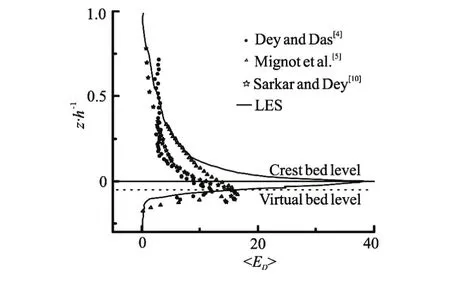
Fig.9(b) DA TKE dissipation rate

Fig.9(c) DA TKE diffusion rate

Fig.9(d) DA form-induced diffusion rate

Fig.9(e) DA residue diffusion rate
3. Conclusions
The investigations of the DA turbulence characteristics and the local flow over a permeable bed are performed by using the LES, focusing on the DA velocity, the DA TKE fluxes and the TKE budget. The results of the LES are compared with previous experiment studies for validation, which also show several dissimilarities. The possible causes of dissimilarities are attributed to the different experimental conditions and the refined numerical simulations.
Over the crest bed level, the DA velocity fits the log law with the von Karman coefficient of 0.286, which is less than 0.4 as a result of the dissipation ofthe mean flow energy.
When 0.2≤k<1.1, the wavenumber energy spectrum fits the Kolmogorov -5/3 scaling law, and whenk>0.2, the greater velocity fluctuationsw′are produced under the virtual bed level.
The TKE fluxes are directed upward and upstream over the entire flow depth above the permeable bed. Meanwhile, the TKE fluxes are directed downward and downstream in the vicinity of the virtual bed level. In the TKE budget, the form-induced diffusion rate is significant near the crest bed level. The TKE production rate and the dissipation rate attain their peaks at the crest bed level and decrease sharply below it. The TKE diffusion rate shows changes in diffusing the turbulence produced in different directions at
There is an intense convective motion and an energy transportation in the vicinity of the roughness bed, and the double-averaging analysis of the turbulent kinetics and the budget can help to understand the turbulence processes near the bed-flow interface. Thus, this study provides some basic insights for the turbulence in hydraulically rough flows.
Acknowledgement
This work was supported by the State Key Laboratory of Hydro-Science and Engineering, Tsinghua University (Grant No. 2014-KY-02).
[1] Hicks B. B., Saylor R. D., Baker B. D. Dry deposition of particles to canopies-a look back and the road forward [J].Journal of Geophysical Research-Atmospheres, 2016, 121(24): 14691-14707.
[2] Ojha S. P., Mazumder B. S. Turbulence characteristics of flow region over a series of 2-D dune shaped structures [J].Advances in Water Resources, 2008, 31(3): 561-576.
[3] Nikora V., Ballio F., Coleman S. Spatially averaged flows over mobile rough beds: definitions, averaging theorems, and conservation equations [J].Journal of Hydraulic Engineering, ASCE, 2013, 139(8): 803-811.
[4] Dey S., Das R. Gravel-bed hydrodynamics: Double-averaging approach [J].Journal of Hydraulic Engineering, ASCE, 2012, 138(8): 707-725.
[5] Mignot E., Barthelemy E., Hurther D. Double-averaging analysis and local flow characterization of near-bed turbulence in gravel-bed channel flows [J].Journal of Fluid Mechanics, 2009, 618: 279-303.
[6] Fang H. W., Rodi W. Three-dimensional calculations of flow and suspended sediment transport in the neighborhood of the dam for the Three Gorges Project (TGP) reservoir in the Yangtze River [J].Journal of Hydraulic Research, 2003, 41(4): 379-394.
[7] Stoesser T., Nikora V. I. Flow structure over square bars at intermediate submergence: Large eddy simulation study of bar spacing effect [J].Acta Geophysica, 2008, 56(3): 876-893.
[8] Fang H., Bai J., He G. Calculations of non-submerged groin flow in a shallow open channel by large-eddy simulation [J].Journal of Engineering Mechanics, 2014, 140(5): 04014016.
[9] Mrokowska M. M., Rowinski P. M., Kalinowska M. B. Evaluation of friction velocity in unsteady flow experiments [J].Journal of Hydraulic Research, 2015, 53(5): 659-669.
[10] Sarkar S. Dey S. Double-averaging turbulence characteristics in flows over a gravel bed [J].Journal of Hydraulic Research,2010, 45(6): 801-809
[11] Balachandar R., Bhuiyan F. Higher-order moments of velocity fluctuations in an open-channel flow with large bottom roughness [J].Journal of Hydraulic Engineering, ASCE, 2007, 133(1): 77-87.
[12] Bagherimiyab F., Lemmin U. Shear velocity estimates in rough-bed open-channel flow [J].Earth Surface Processes and Landforms, 2013, 38(14): 1714-1724.
[13] Hurther D., Lemmin U. Shear stress statistics and wall similarity analysis in turbulent boundary layers using a high-resolution 3-d ADVP [J].IEEEJournal of Oceanic Engineering, 2000, 25(4): 446-457.
[14] Hurther D., Lemmin U., Terray E. A. Turbulent transport in the outer region of rough-wall open-channel flows: The contribution of large coherent shear stress structures (LC3S) [J].Journal of Fluid Mechanics, 2007, 574: 465-493.
[15] Taghinia J., Rahman M. M., Tse T. K. T. Assessment of zero-equation SGS models for simulating indoor environment [J].Heat and Mass Transfer, 2016, 52(12): 2781-2794.
[16] Manes C., Pokrajac D., Mcewan I. Turbulence structure of open channel flows over permeable and impermeable beds: A comparative study [J].Physics of Fluids, 2009, 21(12): 125109.
[17] Bomminayuni S., Stoesser T. Turbulence statistics in an open-channel flow over a rough bed [J].Journal of Hydraulic Engineering, ASCE, 2011, 137(11): 1347-1358.
[18] Yang F. C., Chen X. P. Numerical simulation of two-dimensional viscous flows using combined finite elementimmersed boundary method [J].Journal of Hydrodynamics, 2015, 27(5): 658-667.
[19] Chen X., Lin M., Cheng N. Velocity profile of turbulent open-channel flows over rough and permeable beds [J].Advances in Water Science, 2013, 24(6): 849-854.
[20] Alfonsi G. Coherent structures of turbulence: methods of education and results [J].Applied Mechanics Reviews, 2006, 59(1-6): 307-323.
[21] Mignot E., Hurther D., Barthelemy E. On the structure of shear stress and turbulent kinetic energy flux across the roughness layer of a gravel-bed channel flow [J].Journal of Fluid Mechanics, 2009, 638: 423-452.
[22] Xu D., Chen J. Accurate estimate of turbulent dissipation rate using PIV data [J].Experimental Thermal and Fluid Science, 2013, 44: 662-672.
(Received June 22, 2015, Revised September 22, 2015)
* Project supported by the National Natural Science Foundation of China (Grant No. 11372161, 51209230).
Biography: Xu Han (1991-), Male, Master
Guo-jian He,
E-mail: heguojian@tsinghua.edu.cn
- 水动力学研究与进展 B辑的其它文章
- Spatial relationship between energy dissipation and vortex tubes in channel flow*
- Numerical analysis of flow separation zone in a confluent meander bend channel*
- Mechanics of granular column collapse in fluid at varying slope angles*
- Numerical simulation of submarine landslide tsunamis using particle based methods*
- Prediction of the future flood severity in plain river network region based on numerical model: A case study*
- The influence of wave surge force on surf-riding/broaching vulnerability criteria check*

