Projected area and drag coef ficient of high velocity irregular fragments that rotate or tumble
John F.Moxnes,Øyvind Frøylnd,Ivr J.Øye,Tom I.Brte,Ev Friis, Grd Ødegårdstuen,Tllk H.Risdl
aNorwegian Defence Research Establishment,Land Systems Division,P.O.Box 25,2027 Kjeller,Norway
bNammo Raufoss AS,P.O.Box 162,2831 Raufoss,Norway
cHPVisTech AS,Bjørnstadgutua 21,2092 Minnesund,Norway
Projected area and drag coef ficient of high velocity irregular fragments that rotate or tumble
John F.Moxnesa,*,Øyvind Frøylanda,Ivar J.Øyeb,Tom I.Bratec,Eva Friisb, Gard Ødegårdstuenb,Tallak H.Risdala
aNorwegian Defence Research Establishment,Land Systems Division,P.O.Box 25,2027 Kjeller,Norway
bNammo Raufoss AS,P.O.Box 162,2831 Raufoss,Norway
cHPVisTech AS,Bjørnstadgutua 21,2092 Minnesund,Norway
A R T I C L E I N F O
Article history:
17 March 2017
Accepted 28 March 2017
Available online 10 June 2017
Fragments
Form factor
Mach number
Drag coef ficient
Cauchy area
Tumbling
3 degrees of freedom(DOF)exterior ballistic computer models are used in fragment studies to calculate individual trajectories of each fragment based on drag coef ficient and the projected(presented)area in the direction of velocity of center of mass.The expectation of a randomly distributed projected area is commonly used for fragments that tumble(random rotation)during flight.We forecast a model where the expected drag coef ficient is dependent of shape and Mach number.Rotation or tumbling only affects the expected projected area.Models of projected areas during tumbling and rotation are presented.An examination of the data by McCleskey(1988)indicates that the volume of the fragment to the power of 2/3 is a better parameter to characterize the drag coef ficient of the fragments than the maximum projected area.Hydrocode simulations are used to verify results and to study projected area and drag coef ficient of fragments.
©2017 Published by Elsevier Ltd.This is an open access article under the CC BY-NC-ND license(http:// creativecommons.org/licenses/by-nc-nd/4.0/).
1.Introduction
Range of 3D-rotating irregular fragments from warheads can currently not be simulated directly by computational fluid dynamic (CFD)simulations due to the long computer run time.Even 6 degrees of freedom(DOF)exterior ballistic computer models are commonly not used due to inaccurate models of torques on irregular fragments during flight.In general,the arbitrary shaping of the investigated fragments makes direct numerical simulation or strict analytical study highly complicated and prohibitively expensive when applied to the whole ensemble of fragments.Approaches to estimate drag of the arbitrary body have been based on mimicking that the body drag can be described by the correcting coef ficients to well-studied regular shapes like spheres or ellipsoids[10]and[13].
3-DOF ballistic computer models calculate individual trajectories of each fragment based on time averageddrag coef ficient and time averaged presented(projected)area in the direction of velocity of the center of mass of the fragment.The expectation of the projected area based on a randomly distributed projected area (RDA)is commonly used for fragments that tumble(random rotation)during flight.However,it is notable that only around 35%of the fragments were shown to tumble[14].Few concerns have been raised to the use of RDA for fragments that do not tumble but rotate around some axis.
The drag coef ficients of fragments are dependent on the shape of the fragments,and the Mach number.The maximum projected area of fragments(Amax)divided by RDA,or the volume of the fragment to the power of(2/3)divided by RDA have been used as a measure for shape.However,literature reports on large uncertainties in drag dependency of shape and Mach number,which produces an associated uncertainty in far field impact range of fragments.A good estimate of the projected area of tumbling or rotating fragments is necessary to predict fragment range.
Chartes and Thomas[2]estimated the drag coef ficients on spheres from subsonic to high supersonic velocities.
Hansche and Rinhart[6]measured the drag coef ficient of tumbling cubes at Mach numbers from 0.5 to 3.5.At 0.5 Mach the drag coef ficient was around 0.82,but showed a clear tendency todecline towards lower velocities.Peak drag coef ficient was 1.25 at the Mach number of around 1.25.For higher velocities the drag coef ficient decreased linearly to reach 1.1 at a Mach number of 3.
Dunn and Porter[4]presented one of the first models of drag coef ficient versus Mach number of irregular fragments produced by warheads.The drag coef ficient of irregular fragments is larger than those for a sphere or cube.However,no dependency between dragcoef ficientand theshapeofirregularfragmentswas proposed.
Henderson[8]shows a model for the drag coef ficient of spheres as function of the Mach number,the Reynolds number,and the temperature difference between the sphere and the gas.
Ramsey et al.[16]collected fragment characteristics such as mass,velocity,and projected areas from 155 mm detonating warheads.The RDA of fragments was measured by using an icosahedron gage apparatus.The apparatus consists of a light source, collimating and condensing lenses,a crossed wire support for the fragment and a light level detector.RDA is then measured by means of the light obscured by the fragment in the collimated beam.It was found that a signi ficant number of fragments have shape and drag characteristics approaching a cube.The drag coef ficient versus Mach number was lower than established by Dunn and Porter[4] for subsonic velocities,but was higher for supersonic velocities.It was concluded that the revised values for drag coef ficient and shape lead to an increased range of around 70%.
Heiser[9]presented models for the drag coef ficient as a function of Mach number for irregular fragments.The drag coef ficient at subsonic velocities is even lower than Ramsey et al.[16];but at the same level as Dunn and Porter[4]at supersonic velocities.
Dehn[3]de fined the shape as the maximum projected area of fragments(Amax)divided by RDA,or the volume of the fragment raised to the power of(2/3)divided by RDA.
McCleskey[14]proposed a model where the drag coef ficient is dependent on shape,where shape is given asAmax/RDA.The parameters wereestimated byusing the ARCA Br.vertical wind tunnel at a speed of 0.1 Mach.Additionally,McCleskey proposed a model where the drag as a function of Mach number is constructed by scaling the drag curve for a sphere.
Miller[15]examined,by wind tunnel and air gun tests,the drag coef ficients of fragment number 60 from McCleskey[14].This fragment shows a drag coef ficient of 0.9,while rotating around the T axis with flat spin in the ARCA Br.vertical wind tunnel at a speed of 0.1 Mach[14].Using a transonic and supersonic tunnel up to Mach 4,the drag coef ficient was somewhat higher than established theoreticallybyMcCleskey[14].A new dragfunction was forecasted.
Haverdings[7]presents a table for drag coef ficient on page 19. Catovic et al.[1]proposed a model where shape is de fined as slenderness(aspect ratio),which is the ratio of fragment dimension parallel to velocity vector and fragment dimension perpendicular to velocity vector.CFD simulations(Fluent)of fragments show that the drag coef ficient varies signi ficantly with slenderness [1].
We here forecast a model where the expected drag coef ficient is dependent on shape and Mach number.Rotation or tumbling only affects the expected projected area.Models of projected areas during tumbling and rotation are presented and examination of the data by McCleskey[14]indicates that the volume of the fragment to the power of 2/3 is a better parameter to characterize the drag coef ficient of the fragments than the maximum projected area. Hydrocode simulations are used to verify results and to study projected area and drag coef ficient of fragments.
The accurate trajectory predictions for ballistic applications depend not only on a drag model,but,in lesser degree,also on a lift model.Even for spherical bodies the lift force is induced by rotation via the Magnus effect.Irregular bodies are generating lift without rotation and possible coupling drag-lift forces may apply.These forces may in fluence torque on the body and therefore the spin loss through time.The lift force may in fluence range but is neglected in this work.
The rest of this article is sectioned as followed:Section 2 elaborates the drag model.Section 3 describes models for projected areas during rotation or tumbling.In section 4 we examine the data from McCleskey[14]and apply different models of the drag coefficient.Section 5 analyses drag coef ficient and projected area by the use of CFD simulation,while section 6 concludes.
2.The drag model

Fora given fragmentand orientation in the air flow,dimensional analysis shows that the drag coef ficient is only dependent on the Reynolds number and the Mach number.The Reynolds number isRe=vaρ/η,wherevis the velocity,ρis the density of the air,ais the typical dimension of a fragment andηis the viscosity of the air. Using thatv=100 m/s,a=0.001-0.01 m,ρ=1.3 kg/m3,andη=2 10-5Pa s for air,givesRein the order of 103-105,which indicates that the drag coef ficient is to a good approximation independent of the Reynolds number[12].
Assuming an ensemble average the drag force in equation(1)is written as

The drag is dependent on the orientation of the fragment relatively to the air flow.We hypothesize that the expected drag coef ficient of naturally formed fragments in air is only dependent of bodycharacteristic of the fragment per se,and the Mach number.In particular,volume relative to surface area is a viable parameter to characterize a fragment as a first order signature.The following two models are forecasted for the drag coef ficient,to read

whereVis the volume of the fragment,Mis the Mach number,Amaxis the maximum projected area of the fragment andACis the Cauchy area de fined in this article to be¼times the surface area (As)of the fragment.1An alternative model is to substitutein equation(3).Dehn[3]de fined the shape as the volume of the fragment to the power of(2/3)divided by RDA,or the maximum projected area of fragments(Amax)divided by RDA. McCleskey[14]proposed that the drag coef ficient is dependent onthe ratio of the maximum projected area to the expected projected area during tumbling.Use can be made of the property that for a closed surface which is everywhere convex,RDA is equal toAC.We denote RDA aswhere the superscript“T”means tumbling and the overbar means expectation.A sphere gives the maximum ofis the scaled shape factor and is denoted asCC=K-1[5,7],whileis denoted asAR[14].For simplicity we from now suppress theMthat denotes the Mach dependency.
Most fragments have a varying projected areaApduring flight because of tumbling or rotation.To give expected values the fragment can be conceived as being placed with different orientations in the air stream at a fixed Mach number.The average for all orientations can be termed a forced tumbling situation.Alternatively, the fragment may be released into a uniform air stream and allowed to decelerate and tumble under the in fluence of the aerodynamic forces.
The form factorcFis in the literature de fined by the relation

wheremis the mass of the fragment.The mass can be written asm=ρfV,whereρfis the density of the fragment.Thus

An in finitesimal thin plate is convex.The Cauchy formula gives the expected projected area of an in finitesimal thin plate to be

whereAis the area of each side of the plate.Thus a tumbling plate shows the expected projected area one half the side area of the plate.Note that for an in finitesimal thinplate the form factor is zero since the volume is zero.
3.Mathematical formulas for projected areas
The plate is important to analyze since it is simple,and plates may constructaparallelepiped orothermorecomplicated geometrical objects(see appendix A for a more general object).Let θbe the angle of attack of an in finitesimal thin plate of any shape with area of one side asA.According to the Cauchy relation the expected projected area is during tumblingas found in equation(6).
We apply a direct calculation.The projected areaApθ ()is

Applying two different probability densities for the angle of attackθas an example gives

whereρTθis the distribution corresponding to tumbling,andρRθis a uniform distribution corresponding to fragments rotating around an axis normal to the velocity vector and normal to the normal vector of the plate.The expectation is

Thus for an in finitesimal thin plate the expected area isA/2during tumbling.However,during rotation the area is(2/π)A, which is around 30%larger.
More insight may be established by calculating the distribution of the projected area corresponding to tumbling or rotation around an axis,to read
Tumbling:P(Ap<x)=P(ASinθ ()<x)=P(θ<ArcSin(x/A))
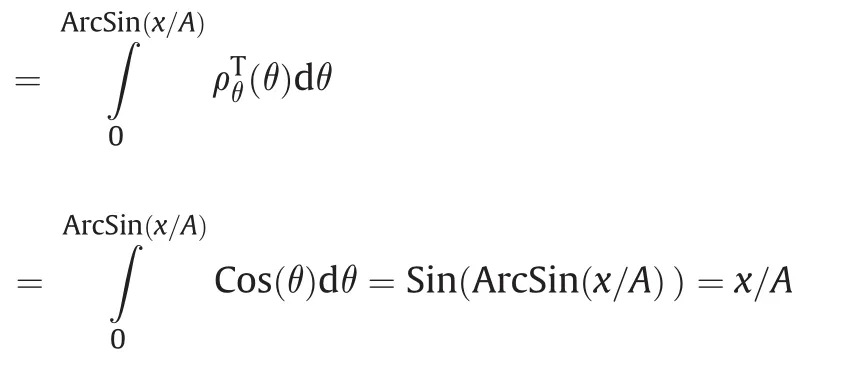
Rotation:P(Ap<x)=P(ASinθ ()<x)=P(θ<ArcSin(x/A))

This gives the distribution for projected areas as

Thus the distribution of the area of the plate during tumbling is uniform.
The expectation is

The variance is

Further,rotation gives

Thus the variance is larger during rotation.
If the plate rotates around any axis that is normal to the velocity vector,the area is
Rotation:

whereλAis the angle between the normal vector to the surface and the rotational axis.
Parallelepiped:
LetA,B,andCdenote the area of the sides of a parallelepiped. The projected area is[5]

It is notable that the angles are only de fined in the first quadrant due to symmetry.Thus absolute values are avoided during calculation.The expectation is
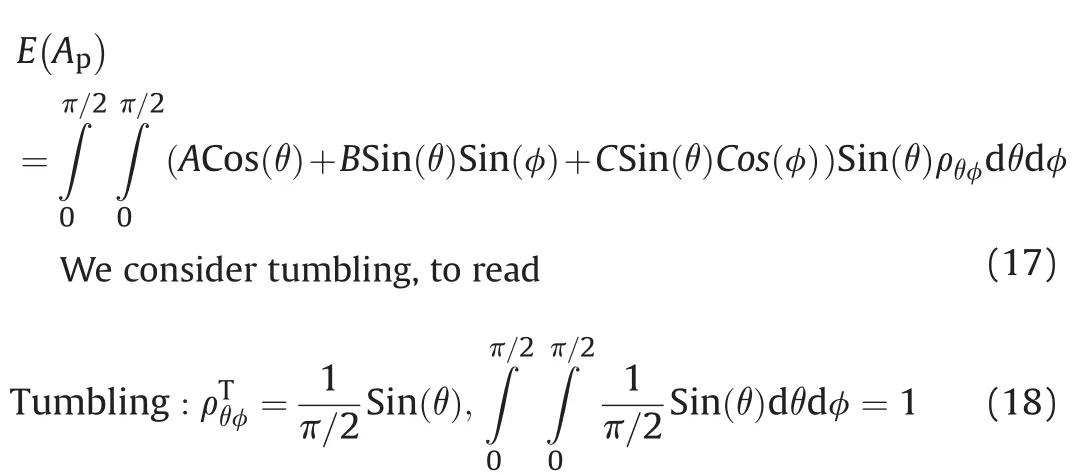
The expectation becomes
The result agrees with the Cauchy formula as it should.In Appendix B we find some relations for the parallelepiped that are not very well known in the literature.The variance is[14]
Tumbling:

The maximum projected area is[14]

We let the parallelepiped rotate uniformly with the axis of rotation normal to the velocity direction.Let the side with area C be the side that does not interact with the air flow.The parallelepiped mimics two plates of areaAandBnormal to each other that rotate. The projected area is thenwhereθis the rotational angle.The expected projected area is during rotation

This is in agreement with the calculation for two independent plates.The expected projected area during tumbling is (A+B+C)/2.If the parallelepiped is long and thin the area C can be neglected.Then the expected projected area during the rotation is around 30%larger than the projected area during tumbling.The drag coef ficient is constructed from expected area and force.Too small estimated expected area will give too large drag coef ficient.
The projected area of the parallelepiped during rotation can be written as

whereOis the circumferential length in the direction of the velocity vector,andLis the length normal to the velocity vector.In general we may write for any rotating convex surface

Assume that the parallelepiped rotates with the rotational axis normal to the velocity vector.The parallelepiped can now be oriented arbitrarily.Set a fixed coordinate system in the parallelepiped.De fine the vector


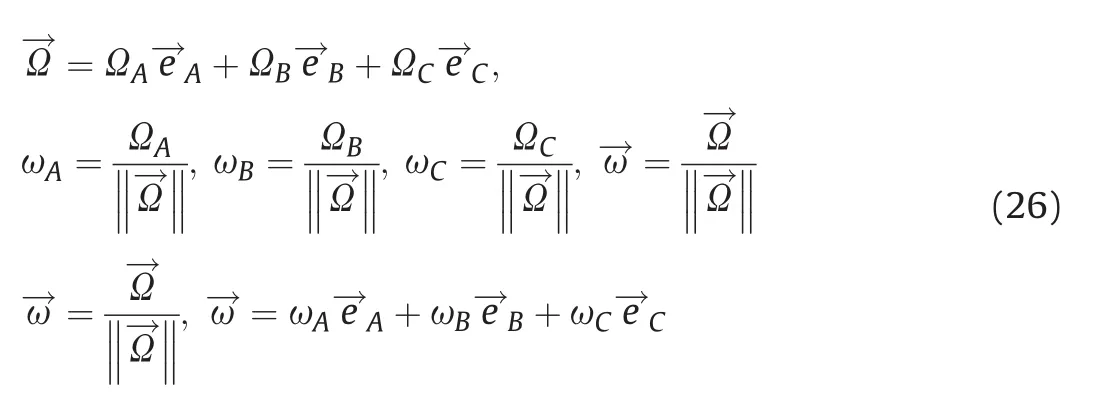
whereωA,ωB,andωCare the components of the rotational vector along the normalaxis ofthe parallelepiped.Note that ω2A+ω2B+ω2C=1.The angles between the rotational vector and the normal vectors of the parallelepiped are

It follows that

Thus

The expected projected area is then

We may write
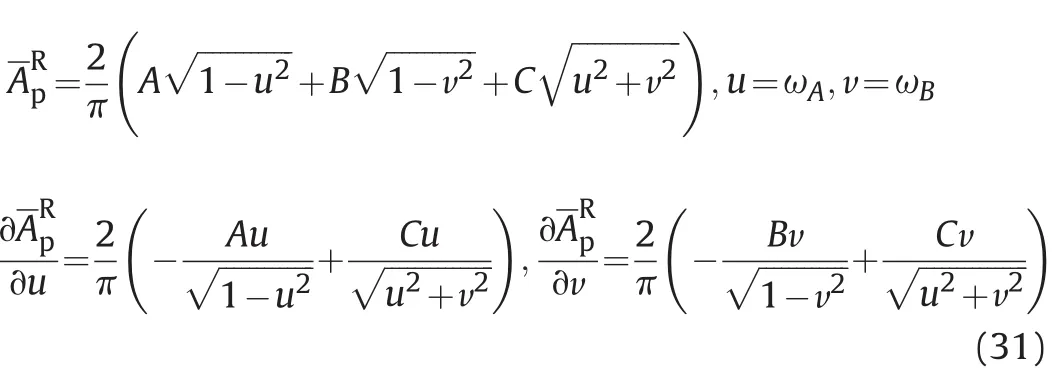

The solutionu=v=0 gives that

This corresponds tothe situationwhere the normalvector toCis normal to the rotational axis.
Appendix C shows that the second solution is given by
Thus during rotation with the rotational axis normal to the velocity direction the maximum average projected area of the parallelepiped istimes the maximum projected area.
Summarizing for the cube whereA=B=C:For a cube with side areaAthe minimum projected area is obviouslyA.The maximum projected area isThe expected projected area is 1.5Aduring tumbling.During uniform rotation around an axis normal to the velocity vector the minimum expected projected area iswhile the maximum expected projected area during rotation is
If the cube changes orientation the bow shock ahead of the cube generates a restoring force,and the cube is statically stable in supersonic flow.Simulation in which the cube is given an initial rotation and then released in supersonic flow may show an oscillatory behavior if the rotation is not too large initially.However,in the transonic or subsonic regime the dynamic pressure is much lower,and the restoring aerodynamic moment on the cube is not suf ficient to maintain stable oscillations,and tumbling will therefore appear more easily.
Rotation around the two principal axes of a fragment corresponding to the smallest and the largest moments of inertia are stable if aerodynamic forces are small.Fragments with three similar moments of inertia,will due to perturbation from the air flow rotate around all axes and show tumbling like behavior.A slender fragment that rotates around the axis corresponding to the smallest or largest moment of inertia may show pitch damping and thus set the rotational axis normal or parallel to the velocity.
Our work does not address the case of the drag in the fragment clusters.Fragments of tight cluster mutually affect each other,thus the increasing or decreasing the individual drag force depending on the geometric parameters of the ensemble.In case of supersonic flow,there is an interaction of the frontal bow shocks from the leading fragments as well as the wake patterns.These interactions make the underlying problemverycomplex.On the other hand,the supersonic drag can be decomposed into friction and wave components,with the latter surpassing the former.Thus to estimate the cumulative supersonic drag of the tight cluster one can apply Whitcomb area rule that states that two fragments with the same velocity have the same drag force provided that the projected area is the same.During fragmentation of a warhead the fragments expand much radially.Thus the fragments will soon approach a separation distance with negligible mutually affections.
4.McCleskey[14]and studies on drag coef ficient and projected area during tumbling and rotation
McCleskey[14]proposed a model where the drag coef ficient is dependent on shape,where shape is modelled as the ratio of maximum projected area to the expected projected area during tumbling.McCleskey[14]further developed a model where the drag coef ficient as a function of the Mach number is constructed by scaling the drag curve for the sphere.The data was categorized in 7 different groups,to be
1:Tumbling of 34 fragments.2:Floating motionless of 6 fragments.3:Flat rotation of 8 fragments.4:Rotating about L and Taxisof 12 fragments.5:Rotating around L and W axis of 3 fragments.6: Rotating around T axis of 13 fragments.7:Rotating around L axis of 7 fragments.8:Coning of 9 fragments.See appendix D for a summary of data and parameters.
Tumbling or rotating fragments show different expected projected area as shown in our last section.Section 2 proposed thatCd=Cd
(V2/3/AC,M)orCd=Cd(AMax/AC,M)as two alternative models.The experimental data of McCleskey[14]do not showACbutWe 3D-scanned some typical fragments from the base of a warhead,and performed a mathematical analysis.ACis not more than 5%larger thanThis gives an error margin in our analysis.
Fig.1 and Fig.2 show the drag coef ficientCdversusV2/3/AC,or versusAmax/ACfor fragments that tumble[14].The correlation is better forV2/3/ACthan forAmax/AC.At low Mach number the drag coef ficient for the sphere and the cube is 0.42 and 0.64 respectively [14].For a sphereAmax/AC=1,whileV2/3/AC=0.83.For a cubeAmax/AC=2 30.5/3=1.15,whileV2/3/AC=2/3.Extrapolation of the regression line in Fig.1 toV2/3/AC=0,which corresponds to a plate,gives the drag coef ficient of 1.4 for a random tumbling plate. For a plateAmax/AC=2.Extrapolation of the regression in Fig.2 toAmax/AC=2 gives the drag coef ficient of 1.2.

Fig.1.The drag coef ficient at Mach=0.1 vsV2/3/ACfor tumbling fragments.Linear regression is applied on the data.Numbers are fragment number according to McCleskey [14].2 isa sphere and 3 isa cube.The regression line isCd=-1.149V2/3/AC+1.41.The big star is a base fragment that we 3D-scanned to find the surface characteristics.

Fig.2.The drag coef ficient at Mach=0.1 vsAmax/ACfor tumbling fragments.Linear regression is applied on the data.Numbers are fragment number according to McCleskey[14].2 is the sphere while 3 is the cube.The regression line isCd=0.481Amax/AC+0.169.The big star is a base fragment that we 3D-scanned to find the surface characteristics.
We calculate the drag coef ficient from McCleskey[14]using the expected projected area during rotation for fragments that rotate only.Fig.3 shows the results for the fragments rotating around the L-axis,where the L-axis of the fragment is normal to the velocity direction[14].The drag coef ficient is much the same for fragments that tumble or rotate,and rotation or tumbling only affects significantly the expected projected area.A model may be that tumbling applies for fragments withV2/3/AC>=0.55,while fragments withV2/3/AC<0.55 tumble or rotate.Further studies are necessary to model whether fragments tumble or rotate.
Fig.4 shows drag coef ficients of fragments from the literature. Hansche and Rinhart[6]measured the drag coef ficient of cubes at Mach numbers from 0.5 to 3.5.We use the small cube and extrapolate to 0.64 atM=0.1[14].Dunn and Porter[4]presented one of the first models for drag coef ficient vs Mach number of irregular fragments produced by warheads.Ramsey et al.[16] modi fied Dunn and Porter[4].The established drag coef ficient versus Mach number was lower than established by Dunn and Porter[4]for subsonic velocities,but was higher for supersonic velocities.LetCd,Sphere(M)denote the drag curve for spheres as function of the Mach numberM.For fragments McCleskey[14]set thatCd,McCleskey=Cd,Sphere(M)-Cd,Sphere(0)+D1.D1is a function of the shape,where a maximum and a minimum function forD1based on wind tunnel measurements at ARCA Br.vertical tunnel at a speed of 0.1 Mach was used.McCleskey[14]gives the average drag coef ficientD1=0.82 for all the fragments that tumble.Rotation givesD1=1.04,and all fragments show the drag average coef ficient ofD1=0.975.We find that theV2/3/AC=0.59 for somefragments from a warhead that we examine,and this is the input to the McCleskey to giveD1=0.72 according to Fig.3.However,Fig.4 shows that scaling of the sphere drag curve by McCleskey does not give the drag coef ficient for the cube for higher Mach numbers.It may be reasonable to use the drag coef ficient for the cube for varying Mach numbers since our fragments withV2/3/AC=0.59 is close to the cube whereV2/3/AC=0.67.

Fig.3.The drag coef ficient at Mach=0.1 vsV2/3/ACfor tumbling(blue)and rotating (red)fragments.The small stars show all fragments of McCleskey[14].The big star is a base fragment that we 3D-scanned to find the surface characteristics. Tumbling:Cd=-1.10V2/3/AC+1.37,Rotation:Cd=-1.34V2/3/AC+1.43.

Fig.4.The drag coef ficient as a function of the Mach number.Black:Ffimodel,Brown: The sphere[11],Red:Dunn-Porter,Blue dotted:McCleskey,Black dotted:Heiser,Red dotted:Ramsey et al.,Cyan dotted:Miller with fragment number 60 of McCleskey that rotates,Green dotted:The cube(Hansche and Rinhart).
Miller[15]examined further by wind tunnel and air gun tests the drag coef ficients of fragment number 60 from McCleskey[14]. The drag coef ficient was somewhat higher than established theoretically by McCleskey[14].An alternative drag curve was forecasted.Heiser[9]presented models for drag coef ficient as a function of Mach number for irregular fragments.
Summarizing:The literature shows large scatter in drag coef ficient of fragments.The data of McCleskey[14]show that the time averaged drag coef ficient is dependent on body shape.The scatter in the drag coef ficient data is reduced when applying that fragments that rotate do not have the same projected area as fragments that tumble.A model is forecasted where tumbling applies for fragments withV2/3/AC>=0.55,while fragments withV2/3/AC<0.55 tumble or rotate.
5.CFD-studies of fragments generated by IMPETUS computer fracture simulations
The steel base fragments of a spinning projectile were examined by using the IMPETUS Afea computer code(IMPETUS for short)to simulate mechanical fragmentation using the numerical node split approach when reaching failure in the damage model.The base of the projectile had a spherical dome shape and the corresponding fragments have a large rotation rate due to torque generated during the fragmentation process.Fig.5 shows a time series of the fracture behaviour of the base.
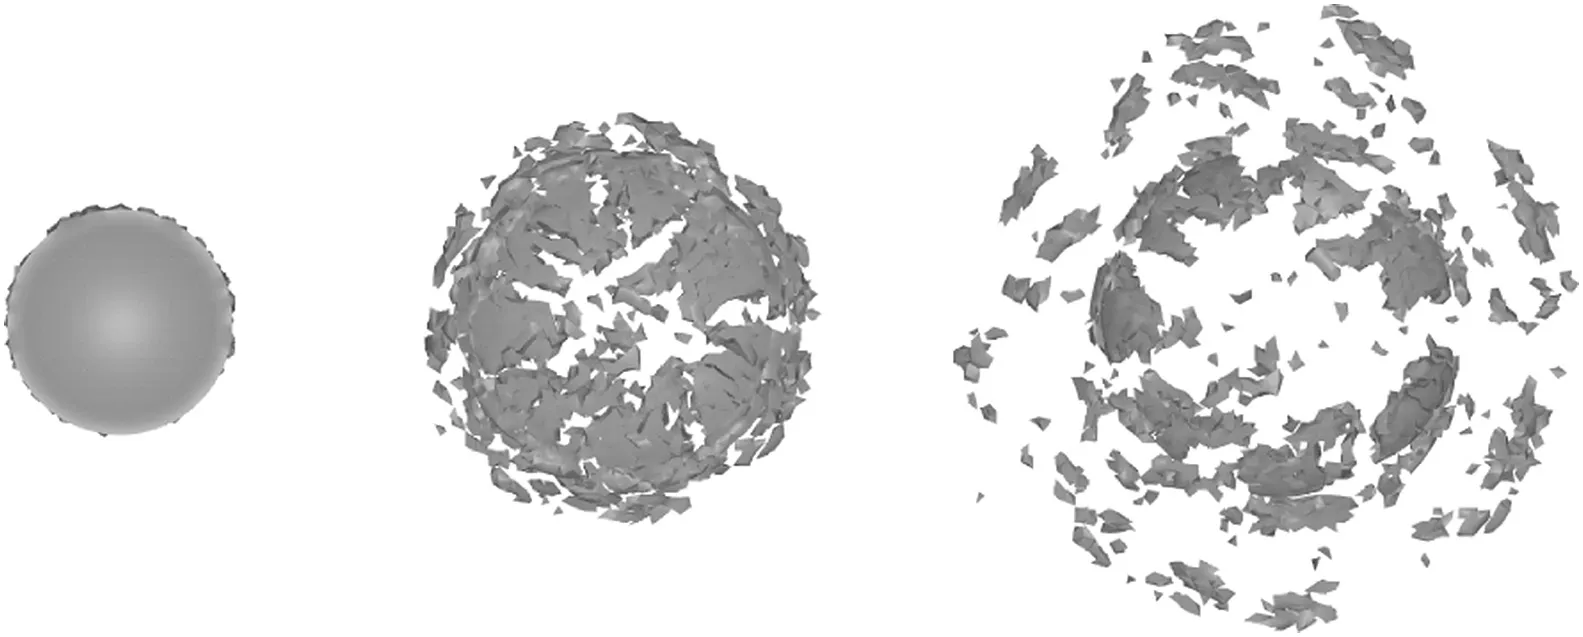
Fig.5.The fracture behaviour of the base shown at different times(0,20 and 40μs).
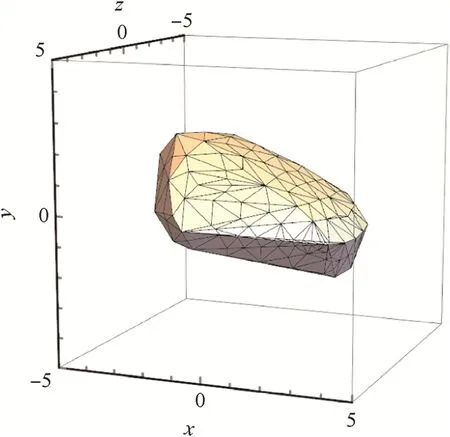
Fig.6.The convex fragment in the global coordinate system.
A typical fragment from the base of the projectile was taken out from the IMPETUS output file.The fragment was simpli fied by creating a convex surface from its nodes.The convex fragment is shown in Fig.6.The presented drag model and its validation in this section deal with convex shapes.This may impose some limitations from the practical point of view.For instance the concave golf ball exhibits lower drag than its convex spherical counterpart due to small-scale local vortices.We 3D-scanned some typical fragments from the base of a warhead,and performed a mathematical analysis.During tumbling the expected projected area of the fragment that was made convex,was not more than 5%larger than the expected projected area of the true fragment.This gives an error margin in our analysis.
The mass of the convex fragment is 0.51 g.The volume,V,is 65.3 mm3.The surface area,As,is 98.3 mm2.This gives the Cauchy area,AC=¼As,to be 24.58 mm2.The form factor is thencF=4.2 g/ cm3,while the scaled form factor isV2/3/AC=0.66.The initial velocity of the centre of mass in the global system isvx=980 m/s,vy=51 m/s,andvz=-11 m/s.xis the velocity direction of the projectile.The directions of the principal axes of the fragment are=(-0.63,0.3,0.71),=(0.55,-0.49,0.68),=(0.55,0.82, 0.14).The principal moments of inertia areI1=1 g mm2,I2=2.04 g mm2,andI3=2.65 g mm2.The initial rotation rate(spin) vector of the fragment (in the global system) is=(0.37,-0.69,-2.16)104rad/s.In general the spin around thexaxis is due to the nature of the fragmentation process less than the root of the sum of squaredspin components around theyandzaxis.
The convex fragment was inserted into IMPETUS and simulated as a rigid body.Two cases were simulated.The first case was a free moving and rotating fragment.The second case was with air interaction.The air in IMPETUS is modelled using discrete particles with an air density of 1.225 kg/m3and a particle density of 6400 particles/cm3.The necessary density of particles was found by simulating a steel sphere with the same mass and velocity as the fragment.The number of particles was chosen such that the drag coef ficient of the sphere was 1 at our initial velocity,980 m/s.
The convex fragment was also simulated in the hydrocode STARCCM+.A 3D-implicit unsteady compressible flow model with a time step of 10-6s was used.The grid consisted of 1.6 106cells.Thek-ε SST DES model for turbulence was used.The temperature was 15 degrees Celsius.The mesh was over set and a 6-DOF rigid body model was coupled to the flow.Fig.7 shows the grid.Also here a sphere was initially used to validate the solution methodic.The drag coef ficient was found to be 1.02 for the sphere.The spherical was also studied by applying a beta-version of the X flow lattice Boltzmann numerical code.The grid size was 0.15 mm and the sphere did show a drag coef ficient of 0.8.This is somewhat lower than the results from STAR-CCM+code.
The IMPETUS and the STAR-CCM+simulations air were run for 0.003 s.Fig.8 shows a pressure and a velocity plot at 0.003 s fromSTAR-CCM+.

Fig.7.The grid of the STAR-CCM+simulation.

Fig.8.Pressure and velocity plot.

Fig.9.The projected area vs time in seconds.
We examine the projected area and the drag coef ficient.Fig.9 shows the projected area during free rotation based on a 6 DOF model of the fragment and during simulations by STAR-CCM+.We observe that up to around 0.001 s the projected area during free rotation is much like the areain air simulated with the STAR-CCM+. The time average projected area for a free fragment is also shown together with the time average area in STAR-CCM+.We note that that the time average area is much like the Cauchy area.
The true projected area given by the STAR-CCM+code can be used to find the drag coef ficient by inverse modelling.We set thatCd=2m˙vx/ρ/vx/v/Ap(t),where v is the absolute value of the velocity from STAR-CCM+.Fig.10 shows the drag coef ficient vs the Mach number.Note that the drag coef ficient is strongly varying since the projected area varies with time.
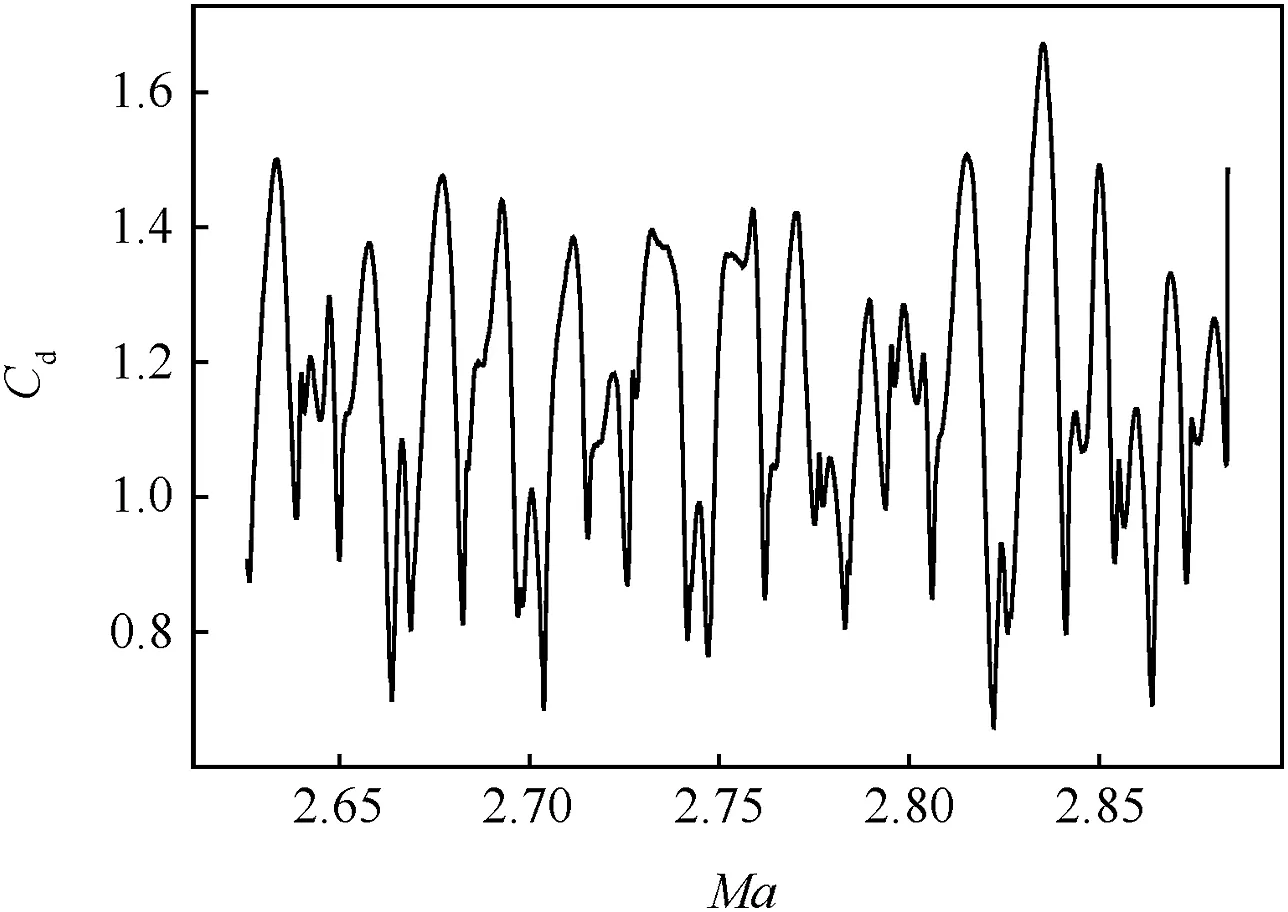
Fig.10.The drag coef ficient vs the Mach number according to STAR-CCM+.

Fig.11.The drag coef ficient vs the scaled projected area where the Cauchy area is used as the reference.The star is the estimated time averaged drag coef ficient based on the Cauchy area plotted vs reference value of 1.
We examine the drag coef ficient and its dependency of the projected area by plotting the drag coef ficient vs the scaled projected area.The scaling parameter is the Cauchy area.Fig.11 shows the results.The drag coef ficient is positively correlated with the projected area.Higher projected area means lower slenderness and the drag coef ficient is found to increase with lower slenderness[1]. The star in Fig.11 shows the estimated average drag coef ficient of 1.14 based on the Cauchy area vs the Cauchy area.Different methods can be used to estimate the average drag coef ficient.We use inverse modelling and set thatThe objective is to find the drag coef ficient that best fits to the STARCCM+data.Fig.12 shows results of the computer simulations and the STAR-CCM+simulations.Best fit is achieved forThe average Mach number is 2.75.The sphere then shows a drag coef ficient of 0.97 while the cube gives 1.09 according to Fig.4.Given that the STAR-CCM+shows a drag coef ficient of 1.02 for the sphere it is seems reasonable to set that the drag coef ficient of the fragment roughly equal to the drag coef ficient of cube for our Mach number.
6.Conclusion
We show different novel analytical models for expected projected area and drag coef ficient of fragments that tumble or rotate with the rotational axis normal to the velocity vector.Examination of the data of McCleskey[14]shows that the volume of the fragmenttothe powerof 2/3 is abetterparameterforthe expecteddrag coef ficient of the fragments than the maximum projected area.We forecast a model where the expected drag coef ficient is dependenton shape and Mach number.The McCleskey data supports the model.It is hypothesized that tumbling applies for fragments with scaled shape factor larger or equal to 0.55,while fragments with scaled shape factor less than 0.55 tumble or rotate.

Fig.12.The velocity is in thexdirection.

We apply a direct calculation.The projected areaApθ ()of the cylinder is

We write(A1)as

WhenAp≤Max(A,B′)there is only one possible angle of attack, ,and the probability density of the projected area is therefore given by

However,whenAp>Max(A,B’)there are two possible angles of attack corresponding to anygivenprojected area,hence the general formula:

from a warhead by CFD modelling using the STAR-CMM+code.The input physical characteristics of the fragment were found by applying fragmentation in the IMPETUS Afea computer code applying the node splitting method.
The CFD modelling by the STAR-CCM+shows that the Cauchy area is a good measure of the time averaged projected area during time.The time averaged drag coef ficient based on the Cauchy area was found to be 1.14 for the Mach number of 2.75.The drag coefficient for a sphere with the same mass and velocity was 1.02. Simulations show that the drag coef ficient is positive correlated to projected area for our fragment.Further studies are necessary to develop models that forecast whether fragments tumble or rotate during a large range of Mach numbers.
Appendix A
2A+B,whereA=πR2,andB=2πRL,whereRis the radius of the end surface,andLis the length.Consider an object withθas the angle of attack.Bdifferent from zero de fines a thin cylinder with area of a cylinder.However,ifBis zero we set the body as an in finitesimal thin plate of any shape with areaA.According to the Cauchy relation the expected projected area is during tumbling
The expectation is

Appendix B.Relations for the parallelepiped
We find that

Thus the variance is[14]
Tumbling:

The derivative of the projected area is given by

The maximum area is found when∂Ap/∂φ=∂Ap/∂θ=0.This gives

The maximum projected area then becomes[14]

Appendix C
We set thatx=u2,y=v2.The other solution is given by

This gives

Appendix D.McCleskey fragments and parameters
McCleskey on page D-4 states a number of fragments that tumble.However,we do not include all of them in our matrix.In Table 2 we have listed some fragments used in[14]and fragments we use in our matrix,with some comments.
Rotation around theLaxes(the axis normal to the velocity and along the longest direction of the fragment).
We include all the fragments of Figure D-7 on page D-8 except fragment 85 where the projected area is not measured.Since thenumber of fragments is small we include fragment number 5 that have some additional coning which we neglect.It is notable that only fragment 8 and 46 rotates around L only.The other fragments also rotates aroundT(the axis is along the velocity direction).
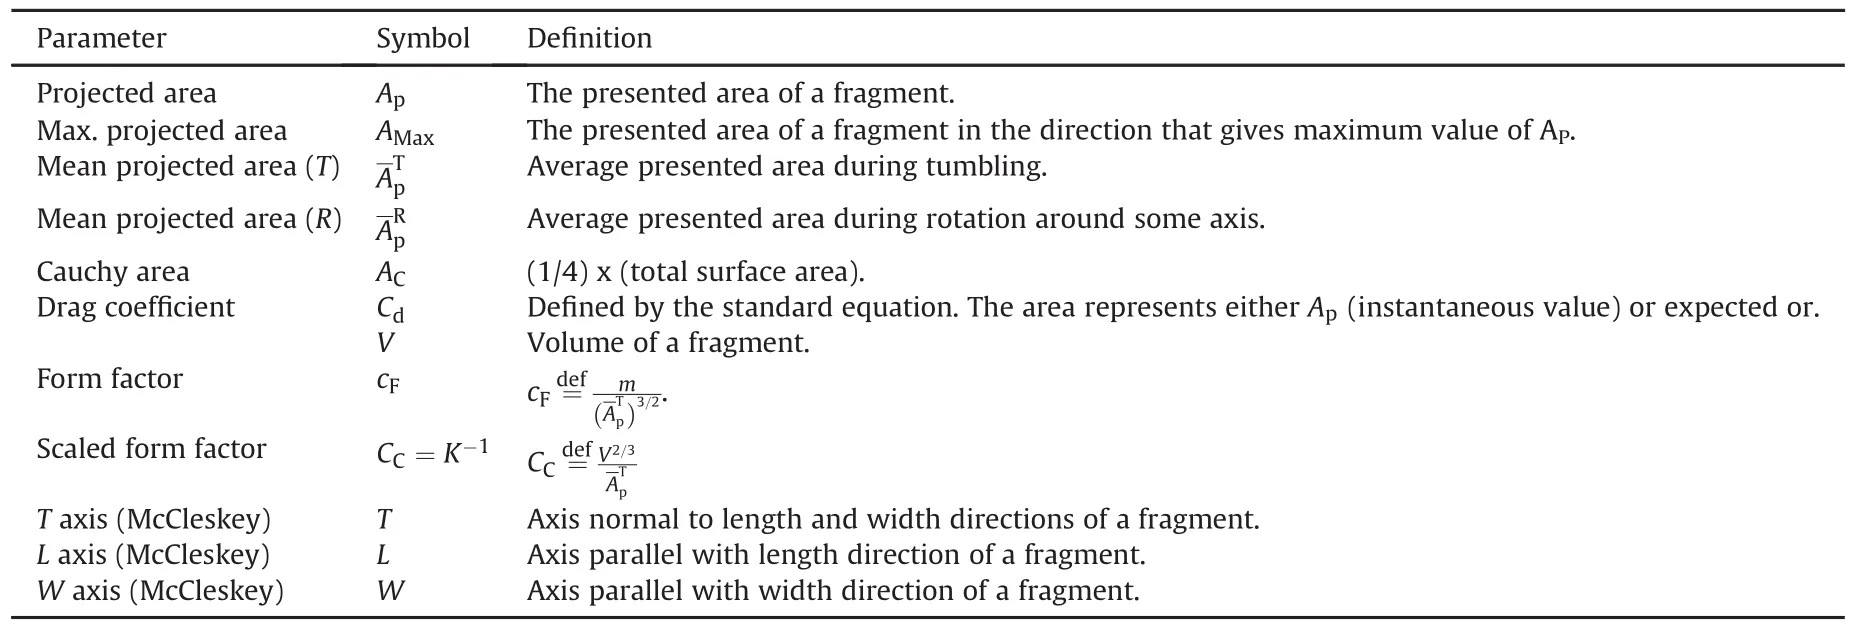
Table 1 Parameters that are used in the literature and in the present article.
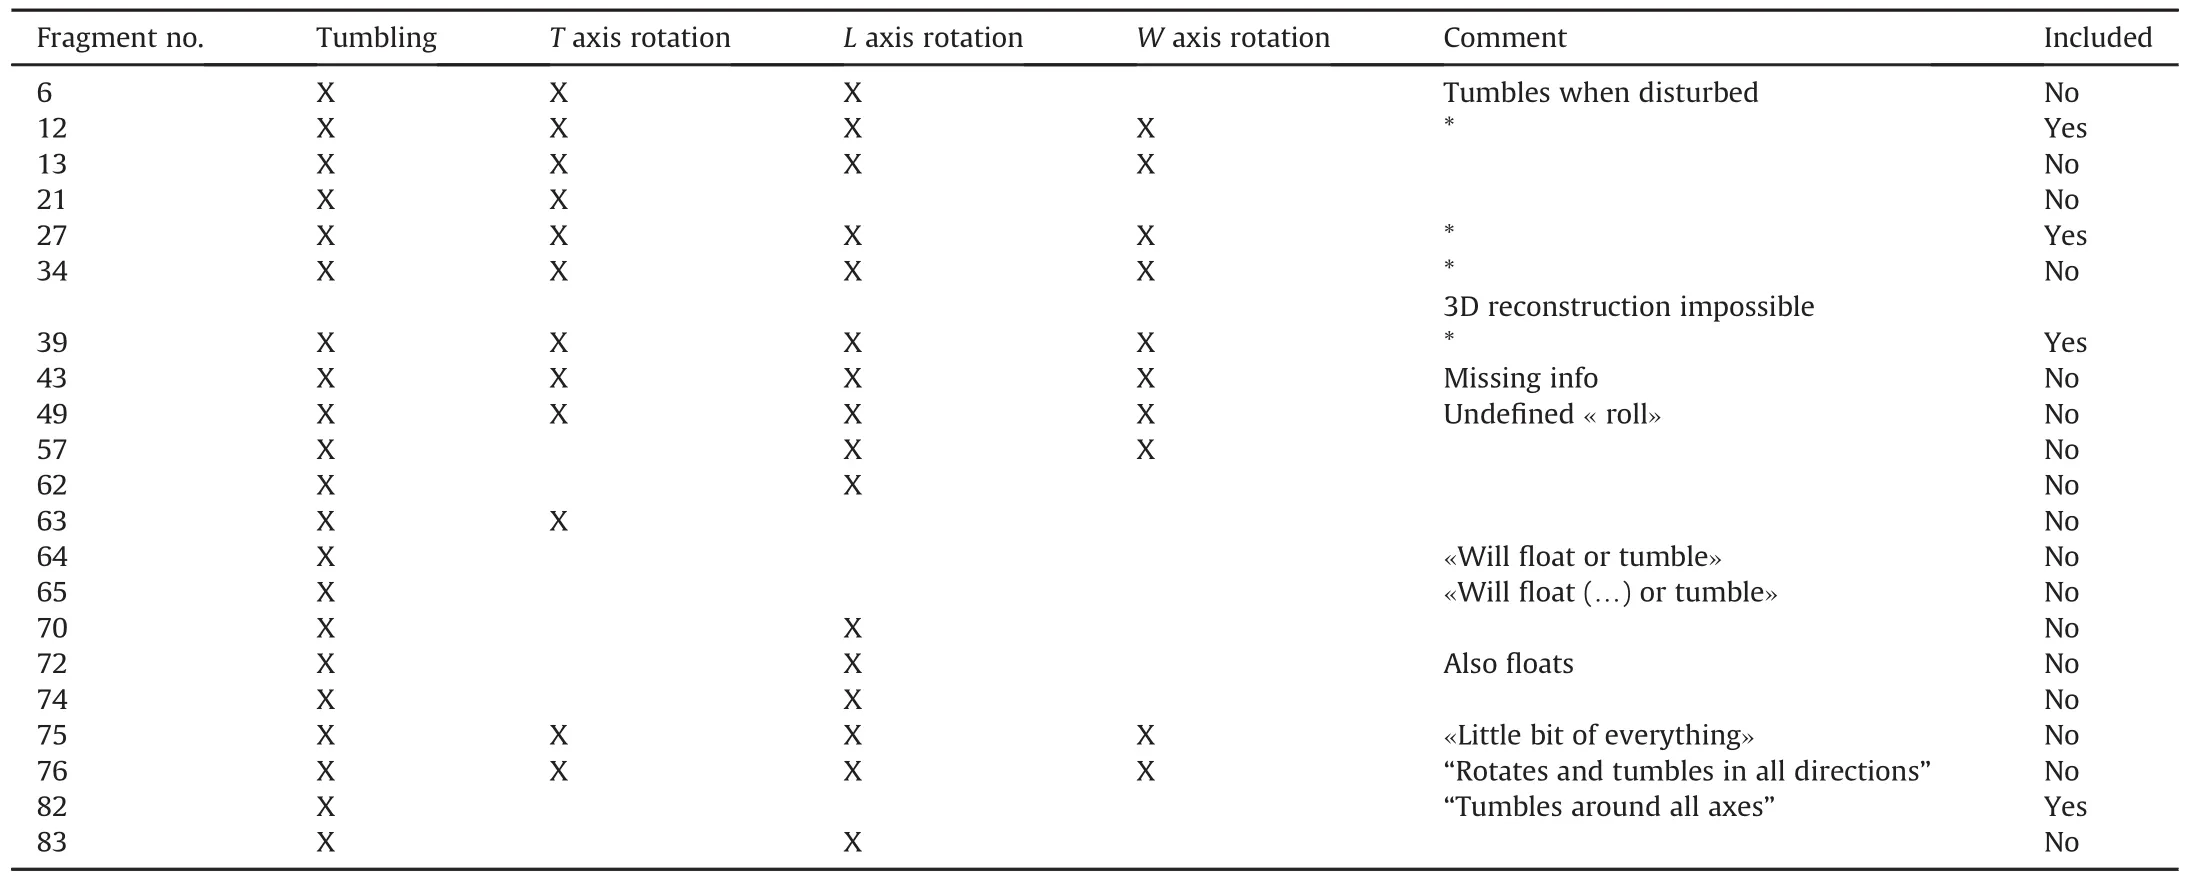
Table 2 Overview of the fragments studied by McCleskey[14]exhibiting tumbling as a mode of motion.*It appears that McCleskeyassociates tumbling with rotation around all 3 axes.
TheT,LandWaxes as used by McCleskey are de fined in Table 1.
[1]Catovic A,Zercevic B,Serdarevic S,Terzic J.Numerical simulations for prediction of aerodynamic drag on high velocity fragments from naturally fragmenting high explosive warheads.15 th Seminar“New Trends in Research of Energetic Materials”,Part III.ISBN 978-80-7395-480-2.Czech Republic:University of Pardubice;2012.p.475-84.April 18-20,2012.
[2]Charters AC,Thomas RN.The aerodynamic performance of small spheres from subsonic to high supersonic velocities.J Aeronautic Sci 1945;12(4):468.
[3]Dehn JT.Terminal effectiveness,vulnerability methodology and fragmentation warhead optimization.1.A technical survey from historical perspective ARBRL-TR-02234.April 1980,AD-A085021.1980.
[4]Dunn D,Porter J.Air drag measurements of fragments.BRL Memorandum Report No 915,APG,MD[August].1955.
[5]Galle LF.A statistical method for the employment of fragment hit area in penetration equations or codes,Proc.12th Int Symposium on Ballistics.March 1990.Rijswijk,Netherlands:San Antonio,1990 Prins Maurits Laboratory TNO; 1990.
[6]Hansche GE,Rinhart JS.Air drag on cubes at Mach numbers 0.5 to 3.5. J Aeronautical Sci 1952;19(2(1952)):83-4.
[7]Haverdings W.TNO Report TD94-0474:general description of the missile systems damage assessment code(MISDAC@).Prins Maurits Laboratorium TNO;1994.
[8]Henderson CB.Drag Coef ficient of spheres in continuum and rare fied flows. AIAA J 1976;15(6).
[9]Heiser.Manual of NATO Safety principles for the storage of military ammunition and explosives,NATO/PFP UNCLASSIFIED,AASTP-1(Edition 1),PART II, May 2006.1979.
[10]Hidy GM.Aerosols,an industrial and environmental science.New York:Academic Press;1984.
[11]Hoerner SF.Aerodynamic Drag.Practical data on aerodynamic drag evaluated and presented by Sighard F.Hoerner,Dayton,Ohio,USA.1951.
[12]Landau LD,Lifshitz EM.Fluid mechanics,course of theoretical physicsvol.6. England:Pergamon Press;1982.p.171.
[13]Lerman A.Geochemical processes:water and sediment environments.New York:Wiley-Interscience;1979.
[14]McCleskey F.Drag coef ficients for irregular fragments.Naval surface warfare center(R15),NSWC TR 87-89.881227060.1988.
[15]Miller M.Drag coef ficient measurements for typical bomb and projectile fragments.August.US Army Research,Development and Engineering Center, Aberdeen Proving Ground,MD;1990.
[16]Ramsey R,Powell J,Smith W.Fragment hazard investigation program,NSWC TR-3664.Dahlgren,VA,Oct.,1978.1978.
29 January 2017
*Corresponding author.
E-mail address:john-f.moxnes@f fi.no(J.F.Moxnes).
Peer review under responsibility of China Ordnance Society
http://dx.doi.org/10.1016/j.dt.2017.03.008
2214-9147/©2017 Published by Elsevier Ltd.This is an open access article under the CC BY-NC-ND license(http://creativecommons.org/licenses/by-nc-nd/4.0/).
in revised form
- Defence Technology的其它文章
- The uncertainty propagation analysis of the projectile-barrel coupling problem
- Studies on composite solid propellant with tri-modal ammonium perchlorate containing an ultra fine fraction
- Study on the effect of RDX content on the properties of nitramine propellant
- Simulation of two-dimensional interior ballistics model of solid propellant electrothermal-chemical launch with discharge rod plasma generator
- The in fluence of nozzle diameters on the interaction characteristic of combustion-gas jets and liquid
- Electrostaticspray preparation and properties of RDX/DOS composites

