Optimal nitrogen fertilization of boreal conifer forest
Timo Pukkala
Optimal nitrogen fertilization of boreal conifer forest
Timo Pukkala
Background:Forest fertilization offers a means to increase the production of renewable resources.Nitrogen is the most common fertilizer in boreal upland forests.There is plenty of research on the effect of nitrogen fertilization on volume growth,but less research on the optimal timing of fertilization and optimal management of fertilized stands.
Methods:This study used simulation and optimization to analyze the profitability of fertilization,optimal management of fertilized stands and the effects of fertilization on cash flows and timber yields.The management of 100 stands representing the most common growing sites of Scots pine and Norway spruce was optimized.
Results:Fertilization improved profitability in most of the analyzed stands.Profitability improved most in spruce stands growing on mesic site.Improving stem quality increased the economic benefit of fertilization.The timber yields of medium-aged conifer stands can be increased by almost 1 m3ha-1a-1(15%)in sub-xeric pine and mesic spruce sites and about 0.5 m3ha-1a-1(5%)in mesic pine and herb-rich spruce sites when the recommended nitrogen dose(150 kg ha-1) is applied once in 30 years.
Conclusions:Nitrogen fertilization of boreal conifer forest should be used mainly in spruce-dominated stands growing on medium sites.The gains are the highest in stands where the mean tree diameter is 16–20 cm and stand basal area is 14–20 m2ha-1.
Forest fertilization,Optimal management,Response model
Background
Fertilization is a way to increase the biomass production of forests(Saarsalmi and Mälkönen 2001).Fertilization was commonly used in Nordic countries during the 1970’s when the annual fertilization areas could reach 200 000 ha in Sweden and 150 000 ha in Finland(Hedwall et al. 2014).The areas have drastically decreased from those peak years but they may increase again in the near future because of the increasing importance of bioeconomy. Fertilization has been seen as a means to enhance the production of renewable resources(Hedwall et al.2014).
In boreal conifer forests,nitrogen(N)is the most common fertilizer on mineral soils(Saarsalmi and Mälkönen 2001)whereas phosphorus(P)and potassium are used in peatland forests.Fertilizers developed for mineral soils often include some phosphorus,in addition to nitrogen,especially when Norway spruce stands are fertilized(Kukkola and Saramäki 1983;Hedwall et al.2014).Forests that have been under slash and burn cultivation in the past often suffer from the lack of boron,resulting in growth disturbances.These disturbances are easily mitigated by boron fertilizers(Bergh et al.2014).Wood ash and lime are also used as forest fertilizers(e.g.Nohrstedt 2001).
Fertilization has been practiced already for several decades in the management of boreal forests.Long-term experiments for analyzing the effects of site,growing stock,and the amount and type of fertilizers have been established and measured at regular intervals.These experiments have produced information for modelling the effect of fertilization on volume increment in Finland (Kukkola and Saramäki 1983;Kukkola and Nöjd 2000: Hökkä et al.2012)and elsewhere(e.g.Nilsen 2001; Nohrstedt 2001;Pettersson and Högbom 2004).
A typical nitrogen(N)dose in forest fertilization is 150 kg/ha(Nohrstedt 2001;Pettersson and Högbom 2004). The growth response to this dose has commonly been reported to be 20–25 m3.ha-1,most of which is obtainedwithin 5 years.The effect of N fertilization is over in about 10–12 years(Kukkola and Saramäki 1983).
Although the growth response of fertilization is wellknown,there is less research on the profitability of fertilization and its optimal timing(Hedwall et al.2014).It is rather clear that fertilization is profitable at least with low discount rates if the additional growth is realized in a cutting within 10 years.This is because the value of the additional growth is typically two to three times larger than fertilization cost if majority of the additional growth can be harvested as saw logs.However,knowing the overall costs and benefits of fertilization does not reveal the optimal timing of fertilization or the optimal management of fertilized stands.The additional value increment obtained with fertilization depends on the stage of stand development and the technical quality of trees,among other things.Fertilization affects profitability also through harvesting costs since it affects the mean size and total volume harvested trees.Moreover, improving growth rate affects the competition among trees,which may result in increased self-thinning and size differentiation of trees.These,in turn,affect the future management of the stand.
Information on the response of growth to fertilization is not sufficient for making optimal decisions on the use of fertilization and managing fertilized stands in an optimal way.This study used simulation and optimization to find the optimal timing of fertilization as well as the optimal post-fertilization treatment of the stands.The optimizations were first done with a fixed dose on 150 kg N. ha-1. In a second set of optimizations the N dose was also optimized.The timber yields and cash flows of fertilized stands were compared to those of unfertilized stands.
Methods
Calculating growth response
The models of Kukkola and Saramäki(1983)were used to predict the growth response obtained by fertilization:

where ΔItis the incr.ease in volume growth t years after fertilization(m3ha-1),Atis the effect of time and the amount and type of fertilizer and B is the effect of site and growing stock characteristics on the response.N is the amount of added nitrogen(kg. ha-1),T is the type of the nitrogen component of the fertilizer,P is indicator variable telling whether the fertilizer also includes phosphorus.Fre is number of trees per hectare,Hdomis dominant height of the stand at the moment of fertilization (m)and SI is site index(dominant height at 100 years,m). The models were developed separately for pine and spruce forests.The two nitrogen types(T)with slightly different responses are:(1)urea,and(2)ammonium sulfate or ammonium nitrate with lime(Kukkola and Saramäki 1983). Examples of calculated responses are shown in Fig.1.
The fertilizer used in this study is a commercial product containing 25%of N and 2%of P.50%of N is in ammonium sulfate and the other 50%is in nitrate.The dose of 150 kg N. ha-1means that 600 kg of fertilizer was used per hectare.The price of the fertilizer was 0.6€.kg-1and a“fixed”cost of fertilization was assumed to be 10€.ha-1.The total fertilization cost was 10€.ha-1+ 600 kg. ha-1×0.6€.k g-1=370€.ha-1,which corresponds to the actual cost of N fertilization in upland forests.
To find the relationship between additional volume increment(obtained from the response model)and additional diameter increment(required in simulation and optimization)the growth of several pine and spruce stands growing on different sites was simulated using individualtree models(Pukkala et al.2013).The obtained results for volume and diameter increment were used to calculate the relationship between volume growth multipliers and diameter growth multipliers.The multipliers were obtained when comparing the growths of similar growing stocks on different sites.The following relationship was found:
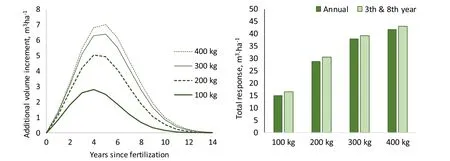
Fig.1 Growth response of spruce stand when the nitrogen dose is 100,200,300 or 400 kg. ha-1.In this example,the dominant height of the stand is 20 m,number of trees per hectare is 800 and site index is 27 m(left).The diagram on the right shows the total response when calculated from the annual responses(Annual)or from the responses of the 3rdand 8thyear,corresponding to the first and second 5-year period

After finding this relationship,the growth response was simulated as follows.First,the volume increment of the stand without fertilization was calculated using the model set of Pukkala et al.(2013).Second,the additional volume incrementobtained from fertilization was predicted using the model of Kukkola and Saramäki (1983).Then,the volume increment multiplier was calculated as follows:

This multiplier was raised to power 0.9 to obtain diameter increment multiplier.For example,if the predicted annual volume increment without fertilization was 6 m3.ha-1and the additional increment due to fertilization was 2 m3.ha-1,the volume growth multiplier was(6+2)/6=1.333,resulting in a diameter increment multiplier of 1.3330.9=1.295.
The models of Kukkola and Saramäki(1983)give the response separately for different years.In the current study,growth was simulated in 5-years steps because the used models(Pukkala etal.2013)predict5-year growths.When calculating the response,3rdyear since fertilization was used for the first 5-year period and 8thyear for the second 5-yeafr period.It was verified that this simplification gives almost the same total response as calculating the response separately for each year (Fig.1).
Optimizations
The growth and yield simulator was linked with a non-linear optimization algorithm(Hooke and Jeeves 1961).Three different management alternatives regarding fertilization were optimized:
Management without fertilization;this provided a reference.
Management schedules which included the possibility to fertilize once with 150 kg N per hectare;this aimed at identifying stands in which profitability can be increased most by using the currently recommended amount of N.
Management schedules in which the amount of fertilizer was also optimized and more than one fertilization treatments were allowed;these optimizations aimed at finding out how much the profitability of forestry can be increased by fertilization and what is the impact of optimal fertilization on timber production.The maximum number of fertilizations was equal to the number of optimized cuttings(i.e.,three since three cuttings were optimized).The maximum allowed N dose was 300 kg. ha-1in one fertilization treatment.
The simulation-optimization system used in this study is the same as in Pukkala et al.(2014a),with the exception that the response function of fertilization was added to the simulator and the year of fertilization as well as the amount of added N were added as optional decision variables.In addition,a decision variable telling whether or not a fertilization treatment is conducted was included in the problem formulation.
The simulation begins with an initial stand,and any number of future cuttings can be optimized.The value of the ending growing stock,after the last optimized cutting,is calculated with a model and added to the net present value(NPV)of the simulated cuttings(Pukkala 2005,2016).The higher is the number of optimized cuttings,the smaller is the influence of the ending growing stock on NPV and optimization result.
The variables optimized for each cutting were:number of years since the beginning of simulation or previous cutting and two parameters of a model for the harvest percentage in different diameter classes(Fig.2).Three cuttings were optimized in this study,which means that the number of optimized decision variables was 3×3=9 when fertilization was not used,3×3+2=11 when the schedule included one fertilization with a fixed dose (150 kg N. ha-1)and 3×3+3×3=18 when also the N dose wasoptimized with a maximum ofthree fertilization treatments.
Themodelforharvestintensitywasasfollows (Pukkala 2015):

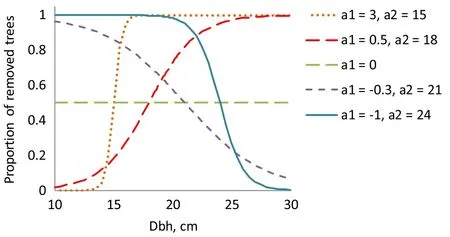
Fig.2 Effect of parameters a1and a2of Equation 2 on the thinning intensity of different diameter classes.Thinning was optimized via optimizing parameters a1and a2,separately for each thinning treatment
where premoveis the proportion of harvested trees and d is diameter at breast height(cm).
The stem quality was assumed to be normal(Q2 in the list of quality classes shown below)in all optimizations except when the effect of stem quality was analyzed.Normal quality means that the volume of saw log was calculated with the taper models of Laasasenaho(1982),taking into account the minimum top diameters(15 cm for pine,16 cm for spruce)and minimum piece lengths of saw logs(4.3 m for both species).Then,quality deductions were made according to the models of Mehtätalo(2002),the predictions of which were corrected based on the empirical results of Malinen et al.(2007).The following four cases were compared when the effect of stem quality on fertilization benefit was analyzed:
·Q1:No quality deductions
·Q2:Normal quality as described above
·Q3:Saw log volume was reduced by 50%compared to Q2
·Q4.The quality was so poor that no saw logs were obtained
Quality deduction was simulated by transferring a part of the theoretical saw log volume(based on the taper model and minimum log dimensions)to pulpwood volume.The incomes from cuttings were calculated using roadside timber prices and harvesting cost functions(Rummukainen et al.1995).Roadside timber price was 55€.m-3for saw log and 31€.m-3for pulpwood.
The used software allows even-aged management, continuous cover forestry(CCF)and so-called anyaged forestry(AAF)in which the silvicultural system is not specified beforehand.Always when the postcutting stand basal area falls below the Finnish legal limits(see Pukkala et al.2014a),there is artificial regeneration if the amount of existing advance regeneration is insufficient(less than another legal limit).
When Pukkala et al.(2014a)used the software to optimize the AAF management of 200 real stands, final felling followed by artificial regeneration was included in few optimal management schedules.Therefore,most of the optimal schedules represented CCF management.To exclude managementschedules where fertilization is made in a distant future,during the next rotation,all management schedules optimized in this study included only thinning treatments, i.e.they were forced to represent CCF management. However,the type of thinning,as specified by parameters a1and a2of Eq.2 was not restricted.The CCF constraint was implemented by preventing the postthinning stand basal area from falling below the legal limit(8–9 m2.ha-1depending on site fertility).The objective variable was NPV,calculated to infinity with a 3%discount rate.
Two most common Scots pine and Norway spruce sites were included in the analyses.For Scots pine, the sites were sub-xeric(VT,Vaccinium type)and mesic(MT,Myrtillus type)and for Norway spruce they were mesic(MT)and herb-rich(OMT,Oxalis-Myrtillus type).Twenty-five initial stands were included for each site and species.The basal area of the stands varied from 10 to 26 m2.ha-1at 4-m2intervals(10,14,18,22 and 26 m2.ha-1)and with each stand basal area the mean dbh of trees varied from 12 to 24 cm at 3-cm intervals(12,15,18,21 and 24 cm).Tree height and stand age varied with mean dbh,differently on different growing sites.All these stands were in such a stage that fertilization would soon be a realistic option.All stands were assumed to represent the growing conditions of the southern part of Finland(temperature sum was 1200 degree-days>5°C).
Results
Effect of fertilization on net present value
Fertilization was included in 68–100%of the optimal management schedules.The proportion was lowest in mesic(MT)pine(68%with fixed N dose and 84% with optimized dose)and highest in mesic spruce (92%with fixed dose and 100%with optimal dose). The proportions of stands having fertilization prescriptions increased in both species and on all sites when the amount of fertilizer was not constrained to be 150 kg N. ha-1.
The improvements in profitability were by far the greatest on mesic spruce sites(Spruce MT),both with fixed and optimized N dose(Fig.3).The fixed dose of 150 kg N. ha-1had the smallest effect on fertile spruce site(Spruce OMT)and the optimized dose had the smallest effect on mesic pine sites(Pine MT). In pine,fertilization increased profitability more on sub-xeric(VT)than mesic sites.Optimized amounts of nitrogen resulted in substantially larger economic benefits than using a fixed dose of 150 kg N. ha-1. The relative improvements in NPV ranged from 1.6% (mesic pine,one fertilization with 150 kg N. ha-1)to 13.2%(mesic spruce,a maximum of three fertilizations with optimized N doses).
Effect of stem quality on fertilization benefit

Fig.3 Effect of fertilization on net present value(NPV).The upper diagram shows the average increase of the NPV in all stands(of which 68–100%were fertilized)and the lower diagram shows the increase in NPV in those stands where fertilization belonged to the optimal management schedule(68–100%of stands)
The effect of stem quality on fertilization benefit was analyzed in sub-xeric pine and mesic spruce stands. Fertilization benefit decreased with worsening stem quality(Fig.4).The absolute improvements in profitability were the largest when stem quality was very good(Q1)or normal(Q2).Profitability improvements were the smallest when stem quality was so poor that no saw log was obtained(Q4).The proportion of fertilized spruce stands did not decrease much with worsening stem quality;76%of stands were fertilized on mesic site when the quality was Q4.In pine,the proportion of fertilized stands was 80%when stem quality was Q1(no deductions)but only 8%when stem quality was Q4(no saw log).It can be seen from Fig.4 that fertilization was more profitable in poor quality spruce stands growing on mesic sites (Spruce MT)than in good quality pine stands growing on sub-xeric sites(Pine VT).
Optimal timing of fertilization
The scatter plots of stand basal area and mean tree diameter at the moment of fertilization reveal that fertilizations were conducted at many different stand basal areas and mean tree diameters(Fig.5).However,the youngest pine stands(mean dbh 12 cm) were never fertilized immediately and the youngest spruce stands were rarely fertilized immediately.The results suggest that pine stands should not be fertilized before the mean tree diameter reaches 14–16 cm,which also applies to fertile spruce stands (with some exceptions).The average of the mean tree diameter at the moment of fertilization,calculated over all stands,was 20.5–21.7 cm,depending on site fertility and tree species.The average stand basal area ranged from 15.6 to 19.7
Although the scatter plots of Fig.5 do not reveal any narrow stand stage which is optimalfor fertilization,it can be concluded that very young stands or dense mature stands should not be fertilized.Dense mature stands should be thinned before fertilization.Young stands should be left to continue growing until the trees are near saw-log sized.This makes it possible to harvest a part of the volume increment as saw log,which is much more valuable than pulpwood.
When looking at the results of individual optimizations(examples shown in Fig.6),it can be seen that fertilization was mostly conducted 5 or 10 years before the next cutting.Fertilization was commonly(but not always)conducted in the middle of two consecutive cuttings.The growing stock volume of the optimal management schedule was often between 75 and 200for most of the time.

Fig.4 Effect of fertilization on the relative and absolute increase in NPV for four different stem quality classes.The diagrams show the combined effect of fertilization,i.e.decreased number of fertilized stands with worsening quality,and decreased effect of fertilization in those stands where fertilization is included in the optimal management schedule
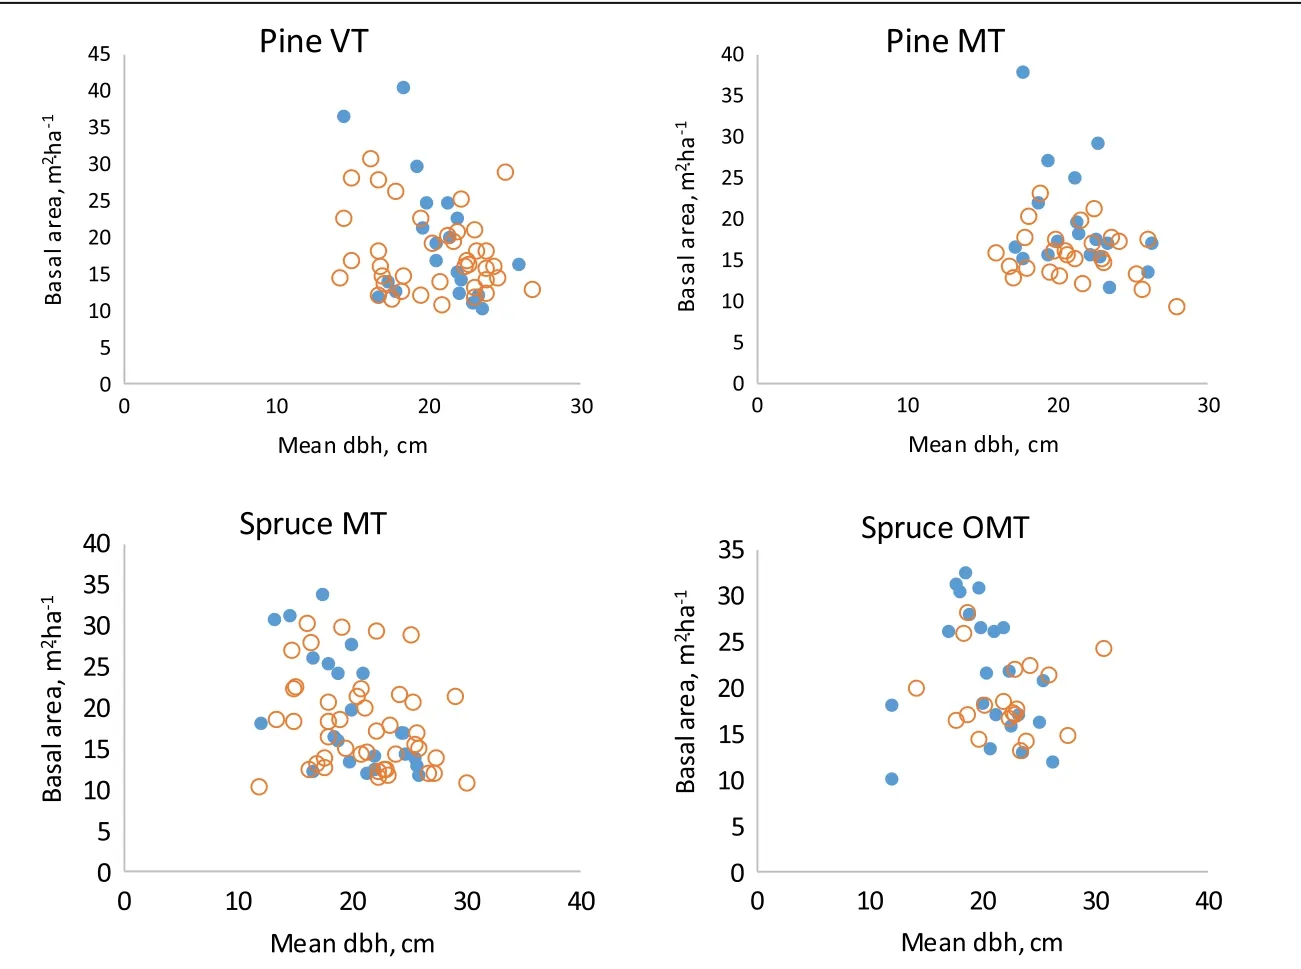
Fig.5 Mean tree diameter and stand basal area at the moment of fertilization in the optimized management schedules.Filled blue dots are from optimizations with a fixed doseand the open circles are from optimizations were the amount of nitrogen was also optimized
Inspection of the results suggested that the improvements in NPV depended on mean tree diameter and stand basal area so that the benefit decreased towards small and large diameters,and towards small and large stand basal areas.Therefore,there should be a certain optimal stand state,which maximizes the benefit obtainable with fertilization.This issue was analyzed by modelling the effect of mean tree diameter and stand basal area on the increment in NPV.The following models were obtained:

Fig.6 Development of growing stock volume in four spruce stands growing on mesic site(MT)when fertilization is not allowed(thick light green line),one fertilization with is allowed(thick dark green line)and a maximum of three fertilizations with optimized N doses are allowed(thin dark green line).The percentages in parentheses are the relative improvements in NPV obtained with fertilization(the first percentage is the effect of fixed N dose and the second is the effect of optimized doses).The bottom right diagram is for the stand in which the absolute increase in NPV was the largest
One fertilization with 150 kg N/ha is allowed:

A maximum of three fertilizations with optimized N doses are allowed:
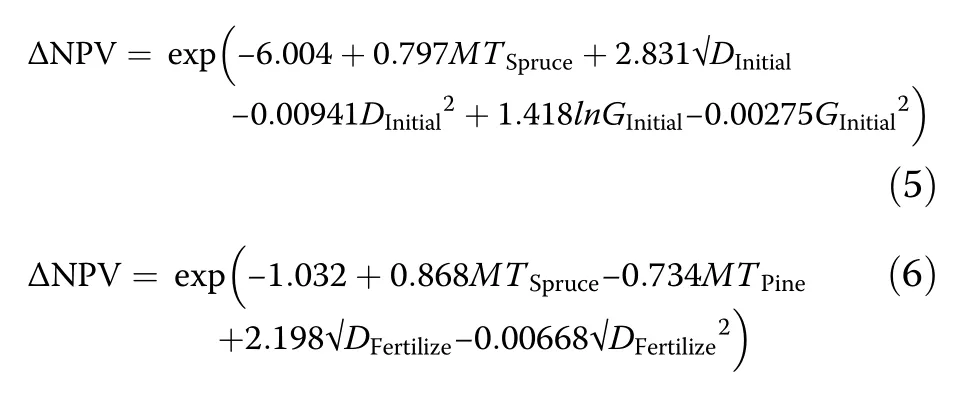
where ΔNPV is the difference in NPV between fertilized and non-fertilized stand,DInitialis mean diameter of the initial stand(cm),GInitialis basal area of the initial stand, DFertilizeis mean diameter at the moment of first fertilization(cm),MTSpruceis indicator variable for mesic spruce and MTPineis indicator variable for mesic pine. The relative RMSEs of Eqs.3,4,5 and 6 were 1.02,1.04, 0.56 and 0.58,respectively.
The models that use the characteristics of initial stands as predictors(Eqs.3 and 5)can be used to pinpoint stands in which greatest improvements can be obtained if the stand is fertilized at the optimal moment.If the dose is fixed(150 kg N. ha-1)the optimal dbh is 17 cm (Eq.3).Stand basal area was not a significant predictor of fertilization gain.When the N dose was also optimized,both dbh and stand basal area were significant predictors of the expected gain(Eq.5,Fig.7).In this case,the stands most suitable for fertilization(immediately or later)had a mean diameter of approximately 18 cm and stand basal areas of 14–17 m2.ha-1.
When fertilization gain was predicted as a function of stand characteristics at the moment of fertilization(Eqs.4 and 6),the optimal dbh for the first treatment was 19 cm when the dose was not fixed and 24 cm when only one fertilization of 150 kg N ha-1was allowed(Fig.8).However,when the dose was fixed,the gain did not vary strongly with dbh,and stand basal area was not a significant predictor of the gain within the ranges analyzed in this study.
When the N doses were optimized they were often close to the maximum allowed,300 kg N. ha-1.The average doses were as follows:pine VT 279 kg N. ha-1,pine MT 259 kg N. ha-1,spruce MT 289 kg N. ha-1and spruce OMT 277 kg N. ha-1.
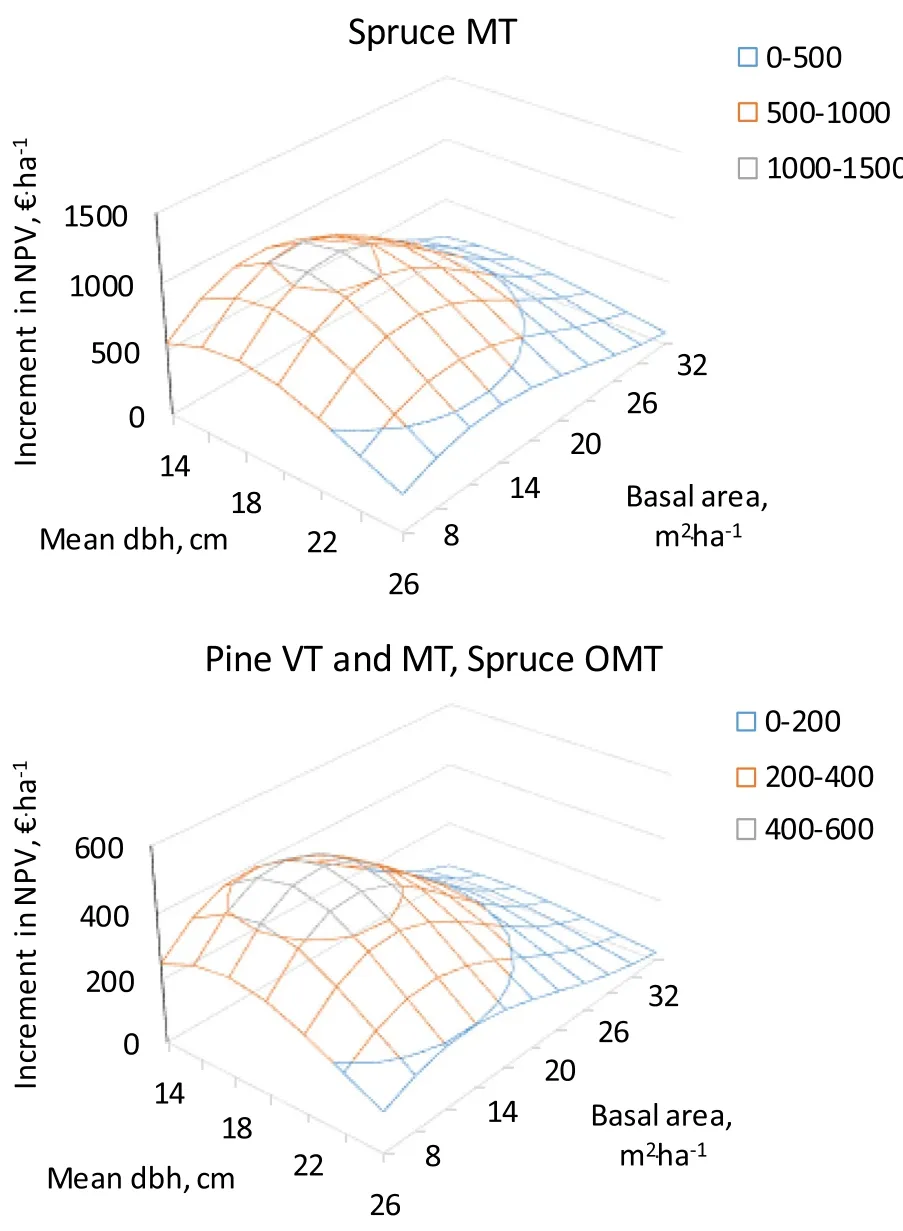
Fig.7 Dependence of fertilization gain on mean tree diameter and basal area of the initial stand when the nitrogen doses are optimized and the maximum number of fertilization treatments is three
The management of mesic spruce stands with the fixed dose of 150 kg N. ha-1was optimized also with 1%, 5%and 7%discount rates.Increasing discount rate decreased the stand basal area and mean diameter at the moment of fertilization.With a 1%discount rate the growing stock volume at the moment of fertilization was,on average,about 200 m3.ha-1,from which it decreased to 150 m3.ha-1when discount rate was 7%.Stand balsa area decreased from 25 to 17 m2.ha-1and mean tree diameter decreased from 22 to 20 cm.The results reflect the fact that increasing discount rate calls forreducing the value of the growing stock.Similarly as with the 3%discount rate,the stand basal area and mean tree diameter varied widely atthe momentof fertilization(Fig.3).Discount rate had no clear effect on the proportion of fertilized stands.

Fig.8 Dependence of fertilization gain on mean tree diameter at the moment of the only(150 kg)or the first(Optimal)fertilization
Effect of fertilization on timber yields and cash flows
The average annual timber yield for different optimization scenarios was calculated for a 30-year period as follows

When each of the 25 stands per growing site was assumed to cover an equal area,the effect of fertilization on timber production was as shown in Fig.9.It can be seen that timber production increased most in mesic spruce(0.95 m3.ha-1.a-1with the fixed dose and 2.42 m3.ha-1.a-1with optimized doses),followed by sub-xeric pine sites(0.87 m3.ha-1.a-1with the fixed dose and 1.59 m3.ha-1.a-1with optimized doses).Optimal fertilization decreased the yield difference between sub-xeric(VT) and mesic(MT)pine stands,as well as between mesic (MT)and herb-rich(OMT)spruce stands.This was partly because fertilization was used more often on the poorer site.Another explanation is that the response to fertilization decreased with improving site fertility.
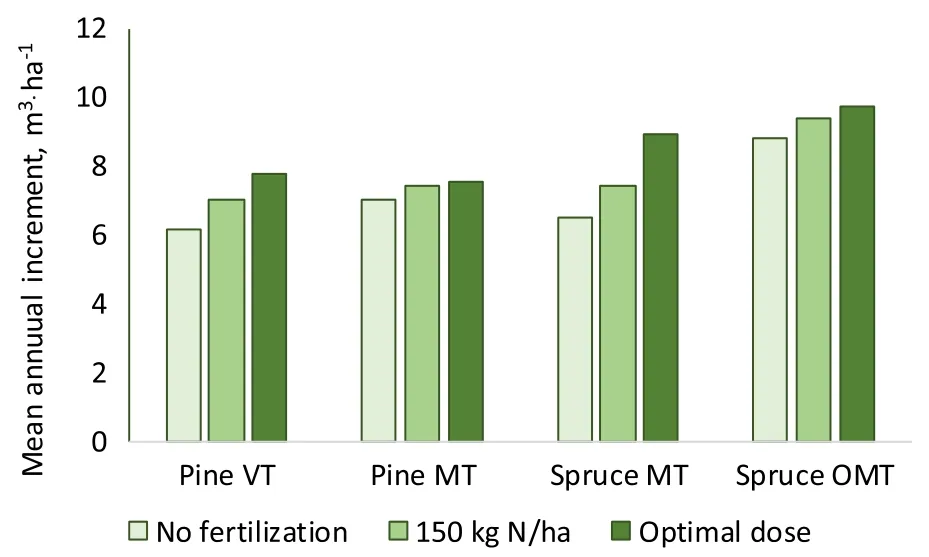
Fig.9 30-year timber production in the optimized management schedule when fertilization was not allowed,one fertilization with 150 kg N. ha-1is allowed,or a maximum of three fertilizations with o ptimal dose(0–300 kg N. ha-1)are allowed
When assumed that each of the 100 stands(25 stands on each site)had the same area,the effectsof fertilization on cash flows and timber supply were as shown in Fig.10.A single fertilization treatment with 150 kg N. ha-1had quite a small influence on net incomes and timber drain.The effect was negative for one to two decades,which is explained by the additional costs and the fact that fertilization tends to increase the optimal growing stock volume(Fig.10,bottom).The influence of fertilization increased gradually with time,and more in the scenario where several fertilization treatments with optimized doses were allowed.After 30 years, the influence of“moderate”N fertilization(a maximum of one application of 150 kg N. ha-1)on timber drain was 10%.Economically optimal intensive fertilization increased timber supply by 20%.The effects were clearly larger in mesic spruce stands(Fig.10,right panel).The results pertain to conifer forests where all stands have mean dimeters between 12 and 24 cm,and stand basal area between 10 and 26 m2.ha-1.
Discussion
The study showed that fertilization improves the profitability of forestry;the sum on discounted net benefits from forest management is increased,at least with 3% discount rate.The analyses do not indicate the internal rate of return(IR)of a single fertilization investment. However,is can be easily calculated that if 75%of the additional volume increment is harvested as saw logs (and 25%as pulpwood)10 years after fertilization,the IR of the investment would be around 8%.If only 50%of additional harvest is saw log,the IR would be 6%and with 25%share of saw log the IR would be 4%.If the cutting is earlier,or fertilization increases the share of saw log,as compared to non-fertilized stand,the IR may be substantially higher.
However,calculating the IR in this way is a too simplistic way to analyze the profitability of fertilization.It may not be optimal to cut a fertilized and a nonfertilized stand in the same year(Fig.6).In addition, fertilization may influence the long-term stand development.It may affect the timing and removal of several subsequent cuttings.Moreover,if the additional growth is not realized soon enough in a cutting the nonfertilized stand may catch-up the fertilized stand since increasing competition and tree size start to decrease growth sooner in the fertilized stand.Fertilization improves profitability also through reduced harvesting costs since higher removal per hectare and larger size of removed trees decrease the harvesting costs per cubic meter(Rummukainen et al.1995).This may improve the obtained unit price of timber.Although fertilization makes it possible to cut earlier,it may also lead to the postponement of cutting since fertilization makes it possible to maintain a sufficient relative value increment for a longer time.
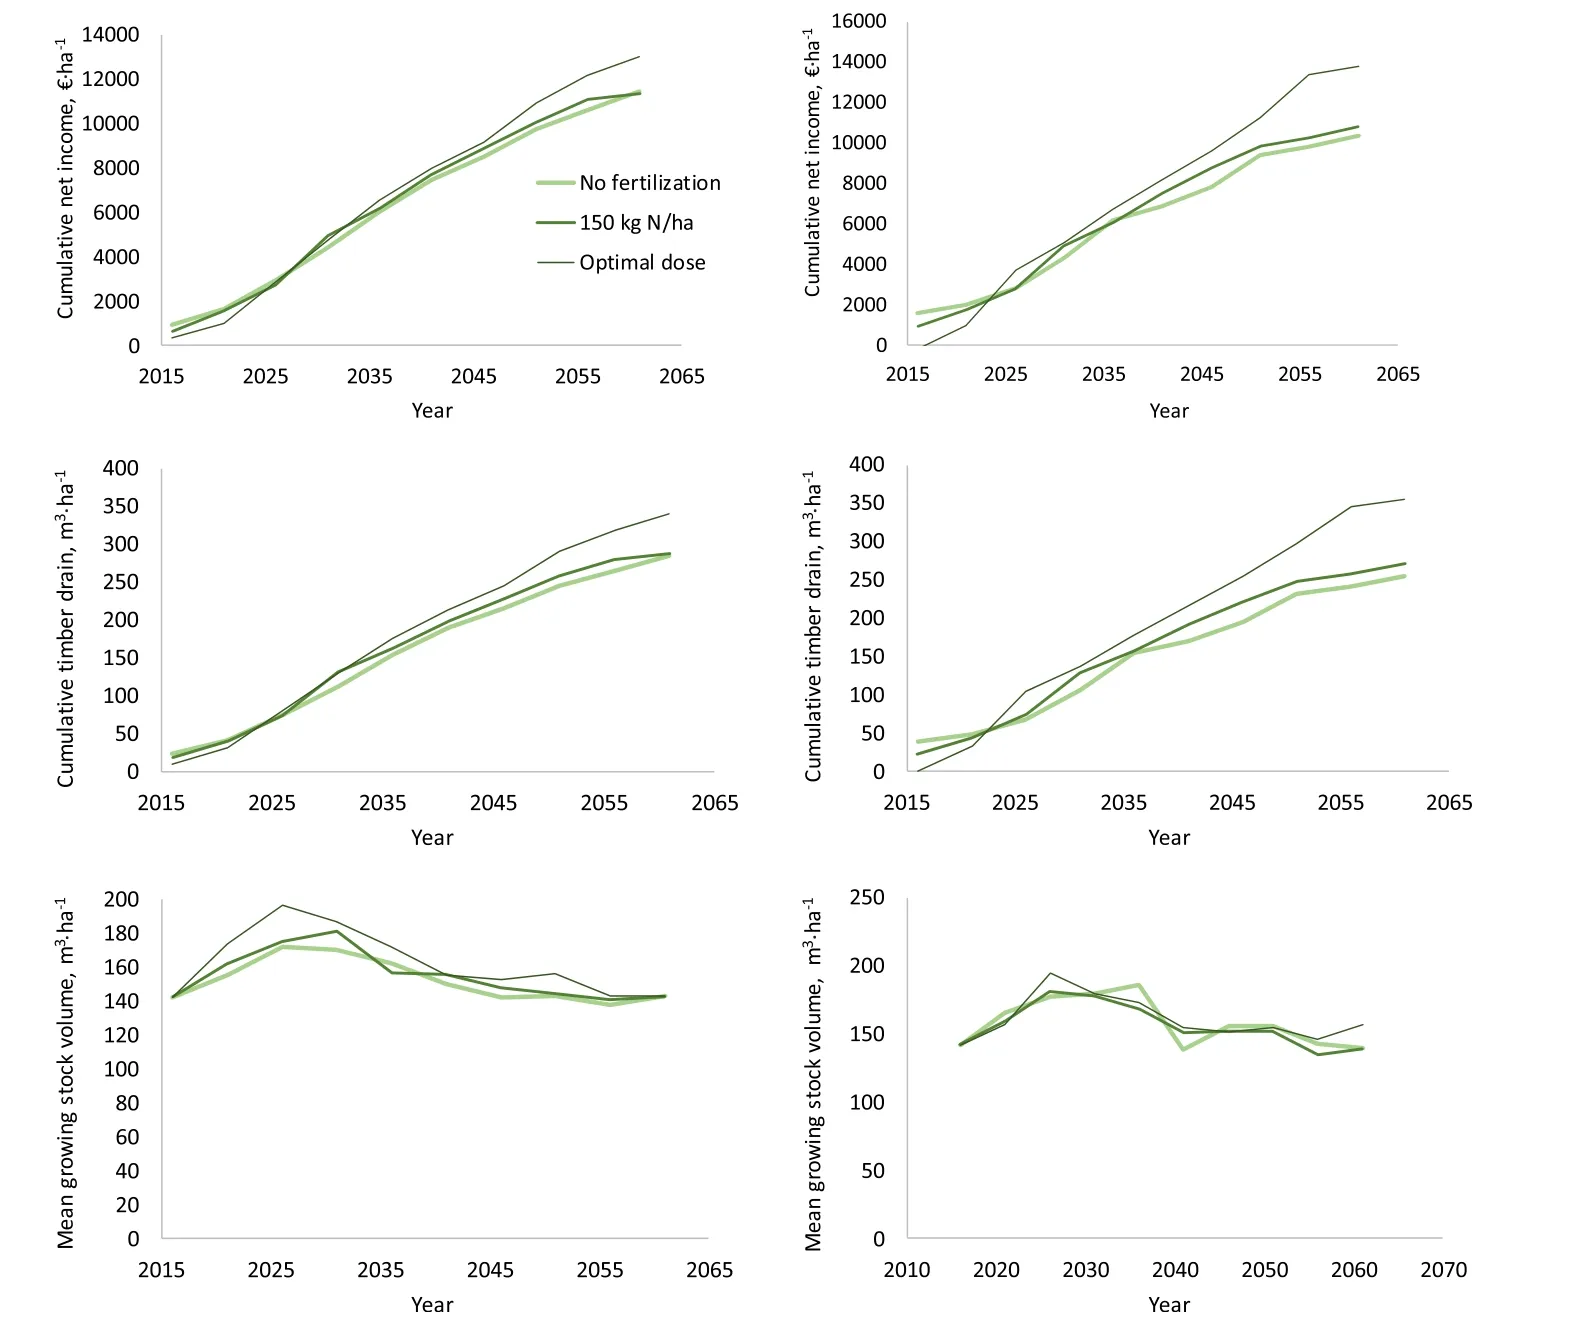
Fig.10 Cumulative net income and timber drain,and the average growing stock volume in three different management scenarios(No fertilization, 150 kg,Optimal dose of N)in a forest where Pine VT,Pine MT,Spruce MT and Spruce OMT each cover 25%of the surface area and each stand type has 25 different stands differing in basal area and mean tree size(left).The right panel shows the results for Spruce MT
The potential shortcomings related to simplified analyses were avoided in this study,which used longer-term simulation and optimization to optimize a sequence of cuttings.The effect of fertilization on future stand dynamics,harvesting cost and optimal timing of several subsequentcuttings were alltaken into account. Interestingly,the conclusions about the profitability of fertilizing pine and spruce stands were different from Saarsalmi and Mälkönen(2001)who based their conclusions on IR calculations.Saarsalmi and Mälkönen(2001) concluded that fertilization is more profitable in pine stand whereas the current study showed that fertilization is more profitable in spruce stands.Both studies suggest that fertilization is more profitable in sub-xeric than mesic pine stands and more profitable in mesic than herb-rich spruce stands.
The results of the current study suggested that the optimal N dose was in most cases clearly higher than the recommended 150 kg N. ha-1.This is partly because the growth increases almost linearly until 300 kg N. ha-1(Fig.1),after which the marginal befit begins to decrease substantially.However,the negative effects of fertilization, for instance nutrient leaching,toxic effects on microorganisms,deteriorated wood quality and increased browsing may also increase with increasing N dose(Saarsalmi and Mälkönen 2001;Hedwall et al.2014).Therefore,although the optimal amounts of N were often higher than the recommended 150 kg N. ha-1,it may be wise to follow the recommendation and perhaps fertilize more often.
Fertilization increases biomass growth,which means that it also increases carbon sequestration into living biomass.Also the carbon balance of forest soil may improve since fertilization increases litter production, which provides input to soil carbon pool.N fertilization may decrease the decomposition rate of soil organic matter,at least in the short term (Saarsalmi and Mälkönen 2001;Hedwall et al.2014).On the other hand,N fertilization may have harmful longer-term effects on soil carbon balance as it may gradually start to increase the decomposition rate of dead organic matter, especially if large amounts of nitrogen are used.(Khan et al. 2007;Mulvaney et al.2009).In addition,N fertilization may increase N2O emissions from forest soils(Brumme and Beese 1992).Manufacturing and transport of fertilizers also cause carbon releases.
Nitrogen fertilization has been shown to decrease the biomass of ectomycorrhizal fungi(Bahr et al.2013), which may have an effect on the nutrient intake of trees. Fertilization also affects the species composition of forest floor so that the abundance of herbs and grasses increases at the cost of dwarf-shrubs(Hedwall et al.2014).The growth of grass and herb vegetation may decrease thecrops of wild berries(Issakainen and Moilanen 1998)and fertilization may also decrease mushroom yields(Ohenoja 1994).Leakage may also be a problem,especially if high amounts of N are used(Insam and Palojärvi 1995;Ring 1995;Gundersen et al.2006).Leaching can be minimized by proper timing of the fertilizer application(season of the year)and by using fertilizer types that are not prone to leaching(Saarsalmi and Mälkönen 2001).In addition,it may be expected that leaching is minimized when the ability of trees to use the nutrients is good and the N dose is not too large.
Conclusions
Although the analyses of this study suggest that N fertilization often improves the profitability of the management of boreal conifer forest,fertilization should be used with caution since N fertilization has several potentially harmful side effects.In addition,the results suggested that fertilization benefit is by far higher in spruce stands on mesic sites(MT site)than in pine stands and more fertile spruce stands.The effects of fertilization on timber drain and cash flows are clearly higher in mesic spruce stands than in other stand types.Therefore,it may be recommended that N fertilization of boreal conifer forest should be mainly used in spruce-dominated stands growing on mesic sites(medium fertility).The mean tree diameter of the stands should be 16–20 cm. Although the analyses of this study concern CCF management,the results could be applied to even-aged forestry as well.This is because the optimal way to thin even-aged stands does not differ much from the optimal thinning in CCF.In both silvicultural systems,it is optimal to conduct high thinnings,which are repeated several times if the stand structure can be maintained as uneven-sized(Pukkala et al.2014a,2014b;Tahvonen et al.2010;Jin et al.2017).
Competing interests
The Author declares that he has no competing interests.
Author’s contributions
TP conducted the analyses and wrote the manuscript.
Publisher’s Note
Springer Nature remains neutral with regard to jurisdictional claims in published maps and institutional affiliations.
Bahr A,Ellström M,Akselsson C,Ekblad A,Mikusinska A,Wallander H(2013) Growth of ctomycorrhizal fungal mycelium along a Norway spruce forest nitrogen deposition gradient and its effect on nitrogen leakage.Soil Biol Biochem 59:38–48
Bergh J,Nilsson U,Allen HL,Johansson U,Fahlvik N(2014)Long-term responses of Scots pine and Norway spruce stands in Sweden to repeated fertilization and thinning.Forest Ecol Manage 320:118–128
Brumme R,Beese F(1992)Effects of liming and nitrogen fertilization on emissions of CO2and N2O from a temperate forest.J Geophys Res 97:851–858
Gundersen P,Schmidt IK,Raulund-Rasmussen K(2006)Leaching of nitrate from temperate forests–effects of air pollution and forest management.Environ Rev 14:1–57
Hedwall P-O,Gong P,Ingerslev M,Bergh J(2014)Fertilization in northern forests–biological,economic and environmental constraints and possibilities. Scand J Forest Res 29(4):301–311
Hökkä H,Repola J,Moilanen M(2012)Modelling volume growth response of young Scots pine(Pinus sylvetris)stands to N,P,and K fertilization in drained Peatland sites in Finland.Can J Forest Res 42:1359–1370
Hooke R,Jeeves TA(1961)“Direct search”solution of numerical and statistical problems.J ACM 8:212–229
Insam H,Palojärvi A(1995)Effects of forest fertilization on nitrogen leaching and soil microbial properties in the Northern calcareous Alps of Austria.Plan Soil 168–169:75–81
Issakainen J,Moilanen M(1998)Lannoituksen vaikutus puolukka-ja mustikkasatoihin ja marjojen ravinnepitoisuuksiin kangasmailla(Effects of fertilization on the yields and nutrient concentrations of blueberry and lingonberry on mineral soils).Folia For 3:379–391,In Finnish
Jin X,Pukkala T,Li F,Dong L(2017)Optimal management of Korean pine plantations in multifunctional forestry.J Forest Res(in print)
Khan SA,Mulvaney RL,Ellsworth TR,Boast CW(2007)The myth of nitrogen fertilization for soil carbon sequestration.J Env Qual 36:1821–1832
Kukkola M,Saramäki J(1983)Growth response in repeatedly fertilized pine and spruce stands on mineral soils.Commun Inst Forest Fenn 114:55
Kukkola M,Nöjd P(2000)Kangasmetsien lannoitusten tuottama kasvunlisäys Suomessa 1950–1998.Metsätieteen aikakauskirja 4/2000:603–612
Laasasenaho J(1982)Taper curve and volume equations for pine spruce and birch.Commun Inst Forest Fenn 108:74
Malinen J,Kilpeläinen H,Piira T,Redsven V,Wall T,Nuutinen T(2007)Comparing model-based approaches with bucking simulation-based approach in the prediction of timber assortment recovery.Forestry 80(3):309–321
Mehtätalo L(2002)Valtakunnalliset puukohtaiset tukkivähennysmallit männylle, kuuselle,koivulle ja haavalle.Metsätieteen aikakauskirja 4(2002):575–591
Nilsen P(2001)Fertilization experiments on forest mineral soils:A review of the Norwegian results.Scand J Forest Res 16(6):541–554
Mulvaney RL,Khan SA,Ellsworth TR(2009)Synthetic nitrogen fertilizers deplete soil nitrogen:A global dilemma for sustainable cereal production.J Env Qual 38:2295–2314
Nohrstedt H-Ö(2001)Response of coniferous forest ecosystems on mineral soils to nutrient additions:a review of Swedish experiences.Scand J Forest Res 6:555–573
Ohenoja E(1994)Forest fertilization and the fruiting body production of larger fungi.Effect of fertilization on forest ecosystem.Biol Res Rep 38:140–155
Pettersson F,Högbom L(2004)Long-term growth effects following forest nitrogen fertilization in Pinus sylvestris and Picea abies stands in Sweden.Scand J Forest Res 19:339–347
Pukkala T(2005)Metsikön tuottoarvon ennustemallit kivennäismaan männiköille, kuusikoille ja rauduskoivikoillle.Metsätieteen aikakauskirja 3(2005):311–322
Pukkala T,Lähde E,Laiho O(2013)Species interactions in the dynamics of evenand uneven-aged boreal forests.J Sustain Forest 32(4):371–403
Pukkala T,Lähde E,Laiho O(2014a)Optimizing any-aged management of mixed boreal under residual basal area constraints.J Forest Res 25(3):627–636.
Pukkala T,Lähde E,Laiho O(2014b)Stand management optimization–the role of simplifications.Forest Ecosyst 1:3(11 p)
Pukkala T(2015)Optimizing continuous cover management of boreal forest when timber prices and tree growth are stochastic.Forest Ecosyst 2(6):1–13
Pukkala T(2016)Plenterwald,Dauerwald,or clearcut?Forest Policy Econ 62:125–134
Ring E(1995)Nitrogen leaching before and after clear-felling on fertilised experimental plots in a Pinus sylvestris stand in central Sweden.Forest Ecol Manage 72(2-3):151–166
Rummukainen A,Alanne H,Mikkonen E(1995)Wood procurement in the pressure of change–resource evaluation model till year 2010.Acta Forest Fenn 248:1–98
Saarsalmi A,Mälkönen E(2001)Forest fertilization research in Finland:a literature review.Scand J Forest Res 16:514–535
Tahvonen O,Pukkala T,Laiho O,Lähde E,Niinimäki S(2010)Optimal management of uneven-aged Norway spruce stands.Forest Ecol Manage 260:106–115
12 December 2016 Accepted:14 March 2017

Correspondence:timo.pukkala@uef.fi
University of Eastern Finland,PO Box 11180101 Joensuu,Finland
©The Author(s).2017 Open Access This article is distributed under the terms of the Creative Commons Attribution 4.0 International License(http://creativecommons.org/licenses/by/4.0/),which permits unrestricted use,distribution,and reproduction in any medium,provided you give appropriate credit to the original author(s)and the source,provide a link to the Creative Commons license,and indicate if changes were made.
- Forest Ecosystems的其它文章
- Improved allometric equations for tree aboveground biomass estimation in tropical dipterocarp forests of Kalimantan, Indonesia
- Response of understory vegetation over 10 years after thinning in an old-growth cedar and cypress plantation overgrazed by sika deer in eastern Japan
- Indicators and tools for assessing sustainability impacts of the forest bioeconomy
- Estimating the carbon fluxes of forests with an individual-based forest model
- The carbon fluxes in different successional stages:modelling the dynamics of tropical montane forests in South Ecuador
- The influence of canopy-layer composition on understory plant diversity in southern temperate forests

