A Model-Based Soft Decision Approach for Speech Enhancement
Xianyun Wang, Changchun Bao,*, Feng Bao
1 Speech and Audio Signal Processing Laboratory, Faculty of Information Technology, Beijing University of Technology,Beijing 100124, China
2 Department of Electrical and Computer Engineering, The University of Auckland, Auckland 1142, New Zealand
* The corresponding author, email: baochch@bjut.edu.cn
I. INTRODUCTION
For the speech communication system in a natural environment, the background noise is one of the main impairments to the desired speech signal. Thus, it is necessary to introduce the module of noise reduction for reducing listener’s fatigue and improving intelligibility of noisy speech signals in speech communication systems. In recent years, many current techniques for noise reduction are based on the principle of masking. And they attempt to estimate clean speech from a noisy signal by selectively retaining time-frequency(T-F) components dominated by the speech and masking out the other components.
For the T-F mask, it is often estimated through computational models of segmentation and grouping, which is an approach often termed computational auditory scene analysis(CASA) [1]. Motivated by human perceptual principles, CASA aims to segregate acoustic source of interest by exploiting inherent acoustic cues of speech. In the grouping stage,according to the underlying relationship of acoustic cues, computational models may group relevant spectral components to estimate the T-F mask [2, 3]. In addition to the aforementioned methods based on inherent acoustic cues, an alternative approach is to estimate T-F masks from known statistical characteristic of the T-F units. In this algorithm,given an input mixture and the distributions of two underlying signals, one estimates the underlying desired signal. However, it is not easy to describe the statistical characteristic of two underlying signals and construct the relationship between the underlying models and noisy model in the transform domain, particularly in log-spectral domain. To solve this underdetermined case, a general approach is to represent the underlying signals by two trained models (each from one signal). For example,an early study [4] employs a hidden Markov model (HMM) to model the distribution of the log-spectral vectors of the underlying signal and derives the T-F mask from the cross-product. Gaussian mixture model (GMM) [5, 6,7, 8] and Gaussian composite source model(CSM) [9] are used to model underlying signals by using different numbers of the mixture Gaussian for separating speech. In addition to these models, other models are applied to capture speech, including eigenvectors to model speakers [10], and the known Autoregressive(AR) models [11, 12].
These above studies have reported positive results on restoring speech signal. Here, there is a problem in describing the noise signal by employing a trained model for speech enhancement. Namely, since the noise is ever-changing and there are a great number of noises in actual environment, it is obviously difficult to model the statistical characteristics of all noises in the application process. In order to solve the problem, the system [5] obtains the log-spectral parameters from the noise spectrum calculated in the frequency-domain so that noise classification is not considered. Later a study [7] employs the noise model in the frequency-domain instead of the log-spectral domain to avoid classification problem and achieves the better performance in restoring speech. In this system, firstly, only a trained model is used to represent the speech signal in the log-spectral domain, and the noise model is represented in the frequency-domain. Then the system converts the speech model into the frequency-domain. Subsequently since neither the individual estimator nor the posterior state probability is easy to compute for each state,the noise model and the speech model in the frequency-domain can be only used to obtain an approximate Bayesian estimator. In this paper, in order to solve the above-mentioned problem about noise, we also start with a T-F domain for the noise model which is similar to the method [7]. However, different from the method [7], the noise model in this paper is converted into the log-spectral domain directly for fitting to a log-max model [13]. Finally on this basis, we derivate two soft decision techniques for separating out the speech signal from noisy speech.
One technique is to estimate a normalized ratio mask (RM) value. In this study, we can obtain the exact MMSE estimators of speech and noise instead of the approximate estimators in [7]. In the second technique, we compute a probability that the component is dominated by the target speech. For the probability,we consider an issue that an optimal LC for a certain SNR may not be appropriate for other SNRs. Brungart et al. [14] has found that optimal LC values are dependent on the signalto-noise ratio (SNR) values. And the studies in[15, 16] has shown nearly perfect performance of ideal binary mask (IBM) when the value of LC is varied from −12 to 0 dB. So we attempt to obtain the probabilistic mask without fixed constraint of LC value for improving speech quality.
The rest of the paper is organized as follows. A brief overview of the log-max model is introduced in Section 2. Section3 describes the details of the proposed method. The performance evaluation is given in Section 4, and Section 5 presents the conclusions.
II. THE LOG-MAX MODEL
Consider two signals simultaneously into a single microphone. The mixed noisy speech signal can be expressed as: y(n)= s(n)+d(n).Where y(n), s(n) and d(n) are considered as noisy speech, speech and noise, respectively.Decomposing the noisy signal into the T-F domain using a gammatone filterbank [8] and assuming that speech and noise are uncorrelat-ed with each other at each channel, we have,

where S(c,m) and N(c,m) denote the power spectrum at the T-F unit of channel c and time frame m of speech and noise, respectively, and Y(c,m) is the power spectrum of noisy speech signal. And we give their logarithmic vectors as follows,

III. THE PROPOSED APPROACH
3.1 Signals models
The input noisy signal is decomposed into different frequency channels by using a gammatone filterbank consisting of 64 filters. The center frequencies of the filters spread from 80 to 4000 Hz. In our work, only speech signal is represented by a trained model. Here, we build a multi-dimensional GMM to model the log-spectral vector of speech as,

where c is the index of frequency channels, K is the number of Gaussians indexed by k. Theand varianceis the mean and variance of the Gaussian distribution.
To avoid the noise classification, we use the statistical distribution of noise in the T-F domain. According to [17], the probability function of signal energy could obey exponential distribution, which means the model of the signal amplitude can be represented as a Rayleigh distribution in practice. Here we can model the T-F units vectorof noise by an exponential distribution with zero mean and covariance matrixi.e.,
In this work, the average value of noisy speech energy is considered as a simple way to obtain the covariance of noise. In order to illustrate the viability of the noise distribution used in our work, we evaluate the statistical characteristic of the T-F units of noise in different transform domains. Here, for a test signal x of noise, we use a moment test[18] to describe the noise distribution in the Discrete Cosine Transform(DCT) domain, Fast Fourier Transformation(FFT) domain and cochleagram domain. The theory of the moment test is based on the generalized Gaussian distribution model, when the parameter θxis close to 0.8, the test signal is often assumed to be Gaussian distribution model;and when θxis close to 0.71, it indicates that the test signal is Laplace distribution. The moment value for the Gamma distribution is 1/sqrt(3).Here, figure 1 (a) and figure 1 (b) give the moment test values for the signals of white noise and babble noise. From these figures, compared with 0.71 and 1/sqrt(3), we can see that most of the moment test values are close to 0.8 in the DCT and FFT domain, which indicates that Gaussian distribution is more suitable for the statistical characteristics of noise. Meanwhile,once the distribution of the noise signal is modeled by Gaussian model, its amplitude could often be described by a Rayleigh distribution and its energy could be described by an exponential distribution [17]. And for the T-F units of noise in the cochleagram domain, we can get the similar results. Thus, we could use an exponential function to describe the noise energy in this paper. Note that, we use 128 filters to decompose the input noise signal for facilitating to evaluate the T-F units from different transform domains in figure 1.
In our study, the speech is described in the log-spectral domain and noise is described in the T-F domain. Generally, the distributions of speech and noise need be represented in same domain for achieving the spectral restoration of speech, which often includes two cases.First, the speech model in the log-spectral domain is converted into the T-F domain. However, as pointed out in [7], exact signal estimation is a computationally intractable problem in this case so that the approximate Bayesian estimator can be only obtained. In this paper,we adopt the other case, namely, the noise model in the T-F domain is converted into the log-spectral domain. In this case, we derivate the exact estimators of speech and noise to replace the approximate scheme generated in the first case. In order to achieve the spectral restoration of speech, we need to convert the probability density functions (PDF) of noise in the T-F domain into the log-spectral domain.So we first calculate the cumulative distribution functions of the log-spectral domain of noise, i.e.,
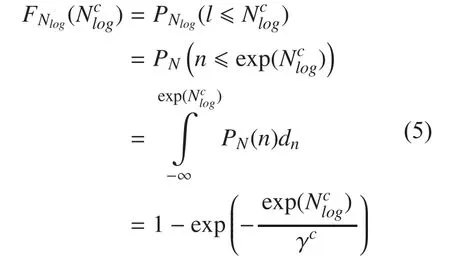
The log-PDF of noise can be obtained by differentiating its cumulative function with respect to

According to the log-max approximation among speech, noise and noisy speech, we can derive the per-channel PDF of
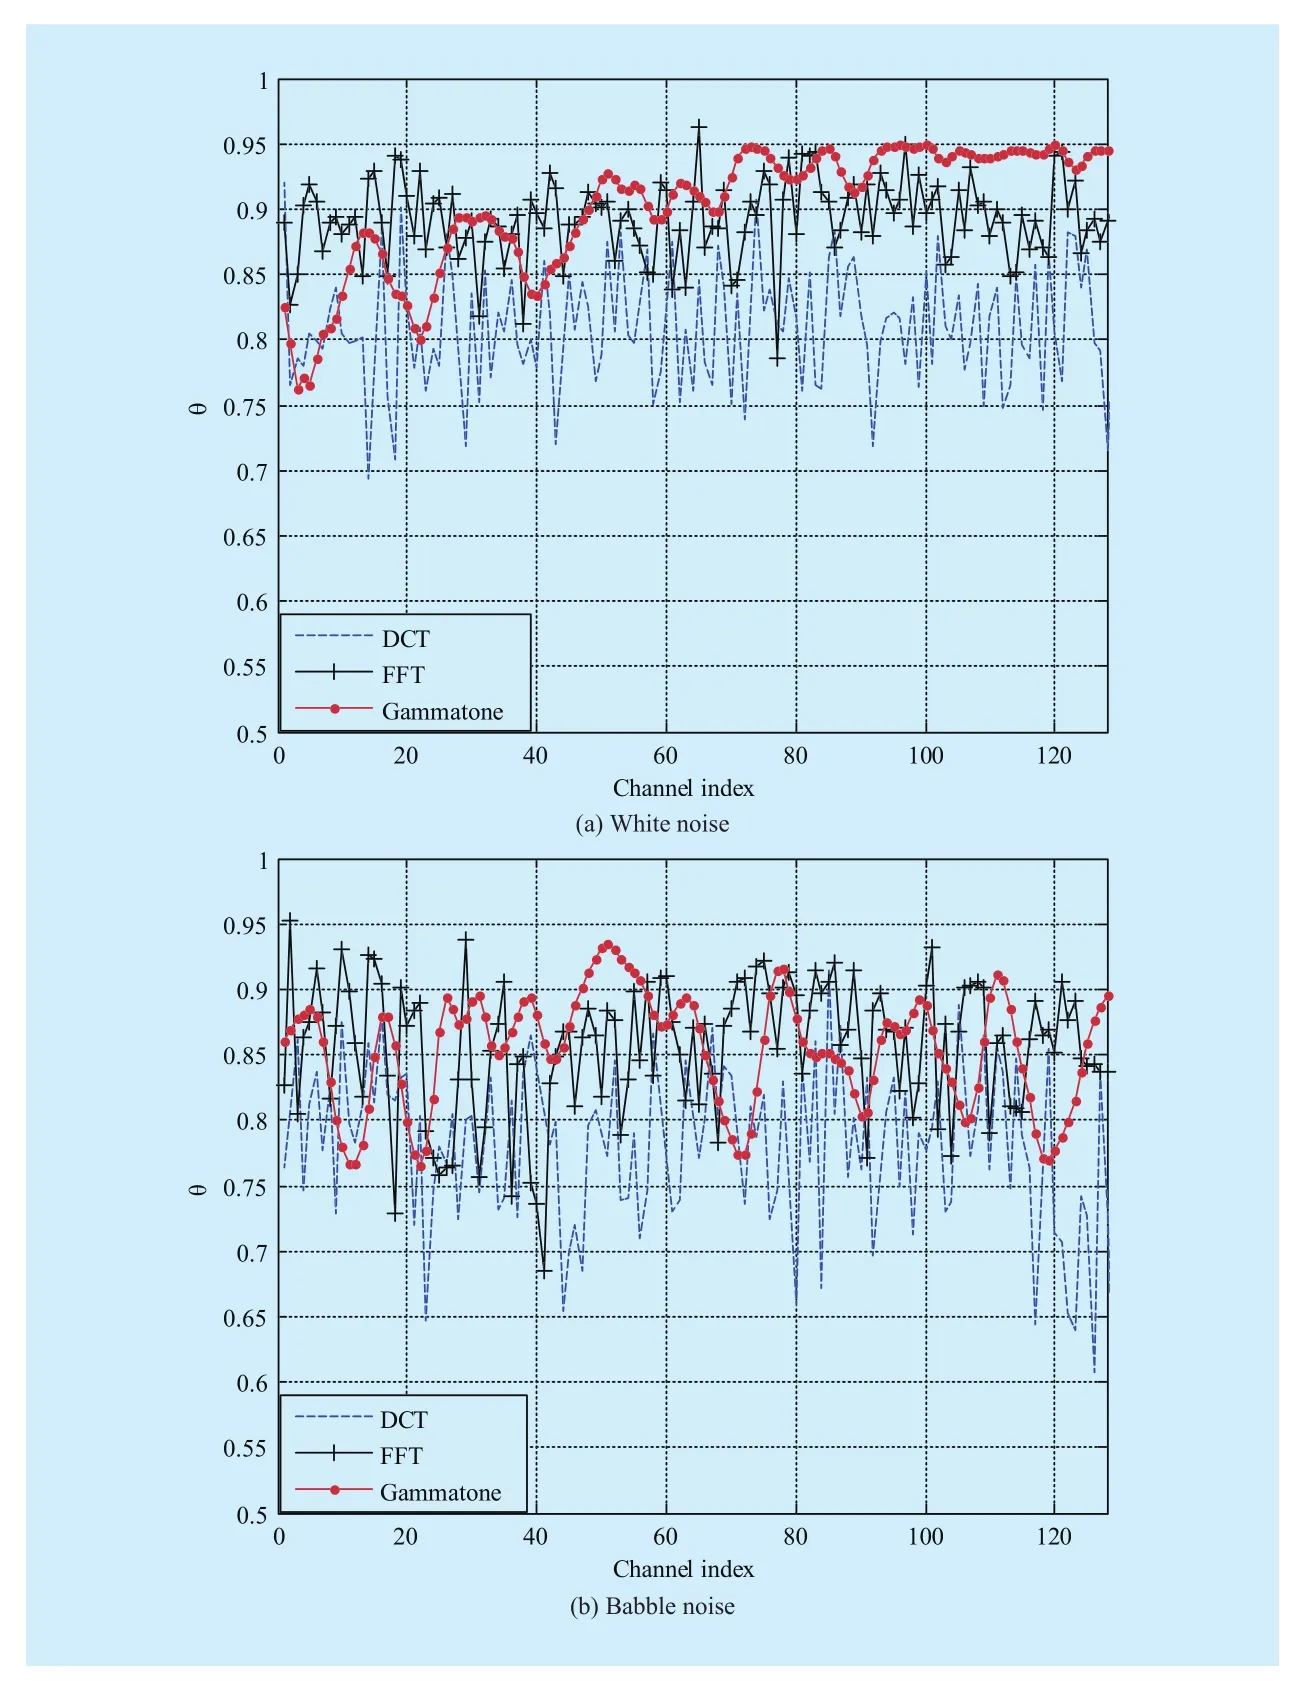
Fig. 1 The moment test value for white and babble noise signal in the DCT domain, FFT domain and cochleagram domain


where the error function

3.2 Ratio mask estimation
In this section, to generate the normalized ratio mask given the energies of speech and noise,we attempt to obtain their MMSE estimations.
We first get the cthelement of the log spectrum estimation of speech by exploiting the following MMSE estimator of

where the conditional probability densitycan be written as
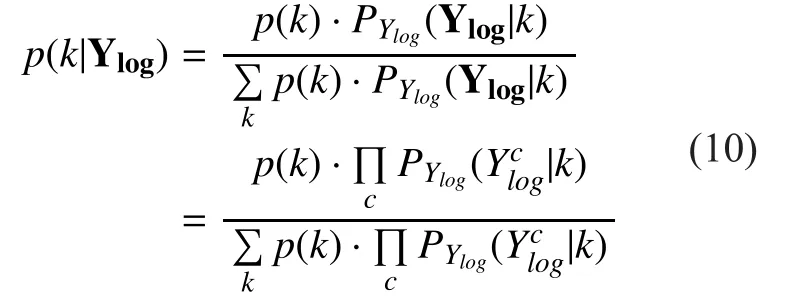
Given the state k and the observationwe can get the MMSE estimator of the log spectrum

where the conditional probability densitycan be obtained from its cumulative distribution function represented asTheis the unit step function. Finally, the log-spectral estimator of speech can be given as (12) shwon in the bottom at this page.
In [8,9,10,12], compared with the log-spectral estimator of speech, the MMSE estimate of the noise signal has a similar form since the same models are represented for speech and noise. In our work, Because of the different model between speech and noise, we can obtain a new exact estimator of the noise energy.The cthlog-spectral component of noise can be given by (13) shown in the bottom at this page.
Given the log spectrum of noise, we can obtain the noisy conditional probability distributionwhich is similar to
For the portion of the integral in (13), we can exploit [19, Eq. 4.331.1, Eq. 4.331.2, Eq.8.211.1] to achieve its accurate result. Thus the log-spectral energy of noise is estimated as
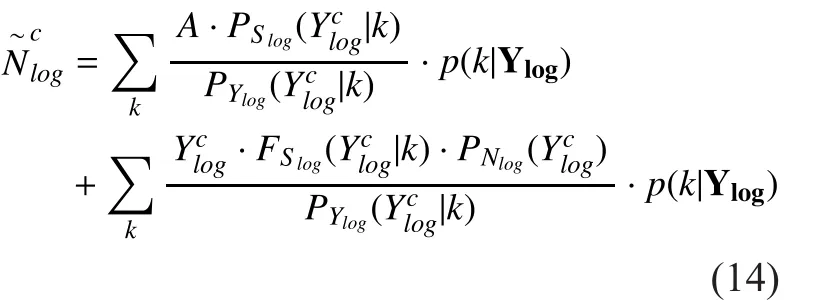
where


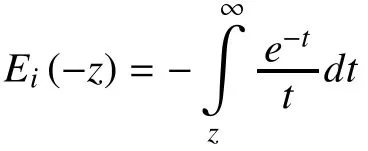

3.3 Probabilistic mask estimation
According to the log-spectral relationship among speech, noise and noisy speech,is equal to the larger ofandSo a probabilistic mask can be viewed as the observed log-spectral component belonging to speech and not to noise conditioned on the entire noisy vector Ylog, i.e.,However the probability could consider LC of 0 dB as an appropriate value to determine the mask for all SNR levels, which may be similar to the concept of IBM with a fixed LC=0 dB.In practice, as pointed out in [16], an optimum LC for a certain SNR may not be appropriate for other SNRs, and the system has also shown that optimal LC are dependent on the SNR values. Therefore, we attempt to obtain the probabilistic mask with the different LC.For convenience, the abbreviation LC is represented by lc in the following section.

If lc is greater than zero, the probabilistic masking is rewritten as
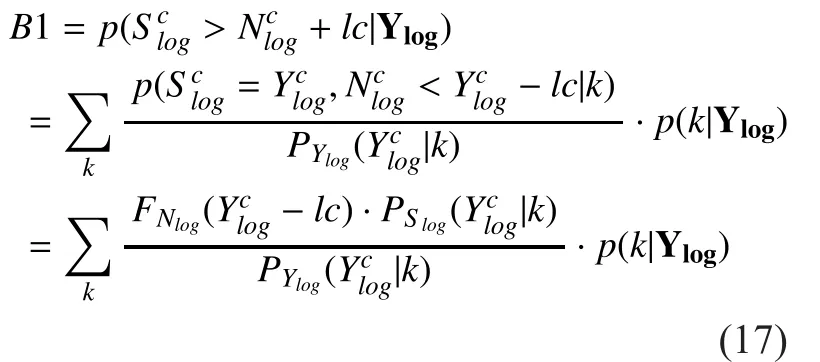
When lc is less than zero, we can obtain the corresponding probabilistic masking by combining with (1), i.e.,

In this section, in order to obtain the optimal probabilistic masking, we need to seek an appropriate lc for each different SNR level.The study in [15] has shown that the local SNR value of T-F units in the range of -12 to 0 dB has an important impact on selecting the local criterion value and obtained a good performance of IBM processed noisy speech when the value of lc is varied from −12 to 0 dB. Based on this application of IBM depending on the relationship between the SNR and lc, we give a simple form to obtain the probabilistic masking with changing SNRs.
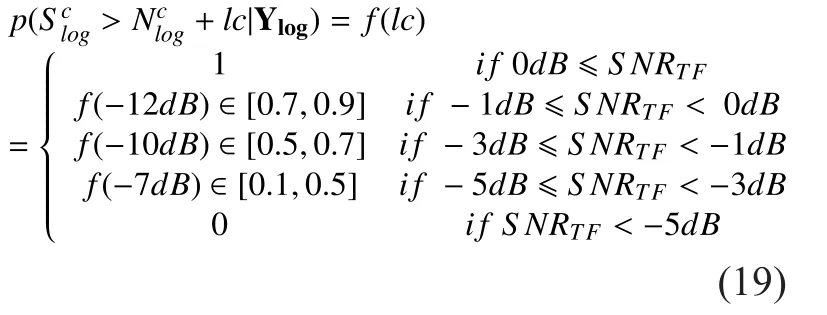
Where f(x) represents the result ofThe SNRTFdenotes the SNR value of T-F unit, which is simply obtained by the output ofin advance in this work.
In this paper, for a probabilistic masking which was also mentioned in [6,8], we consider it as an ideal mask estimation, so we exploit the resynthesized procedure [8,16] of applying the ideal mask estimation to generate the target speech for restoring enhanced speech.
IV. EXPERIMENTAL RESULT

Fig. 2 Speech spectrogram comparison
In this section, the performance of the enhanced algorithms is evaluated. In our experiments, since the main contribution of this paper is to show the effectiveness of the model-based method without noise training for improving the speech quality, we select two counterpart systems avoiding the problem of noise classification [5] [7] and a known model-based system [12] (named as Ref.1)which includes noise classification as reference methods. Here, the ratio mask obtained by [5] and the ratio mask based on the Gaussian approximate in [7] are defined as Ref.2 and Ref.3 for our evaluation. Note that the two counterpart systems and the Ref.1 with two training models are implemented by us in cochleagram domain for matched comparisons.The RM and PMV are the enhanced speech signals reconstructed by the proposed ratio mask and probabilistic masking with different LC, respectively. In this paper, one hour of“training” utterances are used from the NTT database. The length of each utterance is eight seconds and the sample frequency of speech signal is 8 kHz. Four different types of background noises are chosen from NOISEX-92 noise databases, including white noise, babble noise, f16 noise and factory noise. For the Ref.1, the LBG algorithm [25] is used to train the noise codebooks offline for each noise.The size of shape codebook of the four noises is empirically set as 3bit, 4bit, 3bit, and 3bit,respectively. A speech codebook with 5 bit shape is obtained from one and half hours of clean speech by the LBG algorithm [21].Tenth-order LP analysis was used for both speech and noise. Our system is evaluated with eighty mixtures composed of twenty clean speech signals mixed with four noises for each input signal to noise ratio (SNR). The input SNR is set to -5dB, 0dB, 5dB and 10dB,respectively. The frame size is 32ms (256 samples), windowed using normalized Hamming window with 50% overlap between the adjacent frames. In training GMMs, we follow the system [7] which uses 30 Gaussians in GMMs. In this paper, some quality evaluation methods are used as the evaluation for speech enhancement.
4.1 The spectrograms
In this subsection, in order to observe the details of speech structure, we give the speech spectrograms of the restored speech obtained by the proposed method and reference methods. Figure 2 shows an example of the input noisy speech and the enhanced speech reconstructed by the different methods at 5 dB SNR for the Babble noise. In this example, all algorithms can achieve a good performance in reducing noise. However, it seems that the Ref.2 method discards some regions belonged to clean speech at the output because of the inaccurate estimation of log-statistical parameters of the noise. For the Ref. 3, more energy loss is generated at the output, which may imply that a direct method to predict log-spectrum is superior to that to predict frequency spectrum in protecting speech energy. As a comparison, although the Ref.1 method exploiting the training model of the noise can obtain more speech energy, it has more residual background noise. As expected, the proposed methods can achieve lower residual noise and less speech distortion, which could lead to the better results as compared to reference methods. And the RM-based method has the better quality in reducing the noise than the method using PMV.
4.2 The SSNR evaluation
The SNR is often applied to evaluate the de-noising performance of speech enhancement method. Higher values of SNR improvement is an indication of higher speech qualities. It is often used in CASA-based method[16] and is computed as,

where n is the time index, Sallone(n) is the clean speech signal that is resynthesized by an allone mask and is termed as the ground truth signal, andis the enhanced speech signal obtained by ideal T-F mask estimation.
Table 1 shows the SNR improvement(SNRI) obtained by processing noisy signals with the proposed method and reference methods, at different input SNRs, and for the White, Babble, F16 and Factory noises,respectively. As seen from table 1, the reconstructed speech signal from the Ref.2 gets relatively lower SNR results than the other methods without noise classification in most cases. The reason for this case may be the inaccurate estimation of log-spectral parameters in noise model, which is indirectly calculated by exploiting the noise power spectrum in the T-F domain. In the proposed framework, giv-en the noise model in the T-F domain, we can directly obtain the log-spectral distribution of noise by the model transformation so that we can derive the exact estimators of speech and noise. From the result of SNR improvement,the RM-based system used in this work can help to reduce the more residual noise than the Ref.3 with the approximate estimator. In our work, due to the MMSE estimators used in the normalized ratio mask technique specifically attempt to minimize the mean squared error in the log spectrum for achieving an optimal enhanced spectrum. This is reflected by the fact that the RM-based algorithm could help to consistently achieve better improvements in terms of SNR. So the PMV-based method achieves relatively lower SNRI results than the RM-based method. Furthermore we have also a problem about the method with employing PMV in this paper. That is, we do not find an optimal way to construct the relationship between LC and SNR so that we have to employ the outstanding achievement of the empirical study in [16]. But the relationship may not be optimal for our estimation, which may give the poor degree of improvement in the SNRI results for PMV-based method.
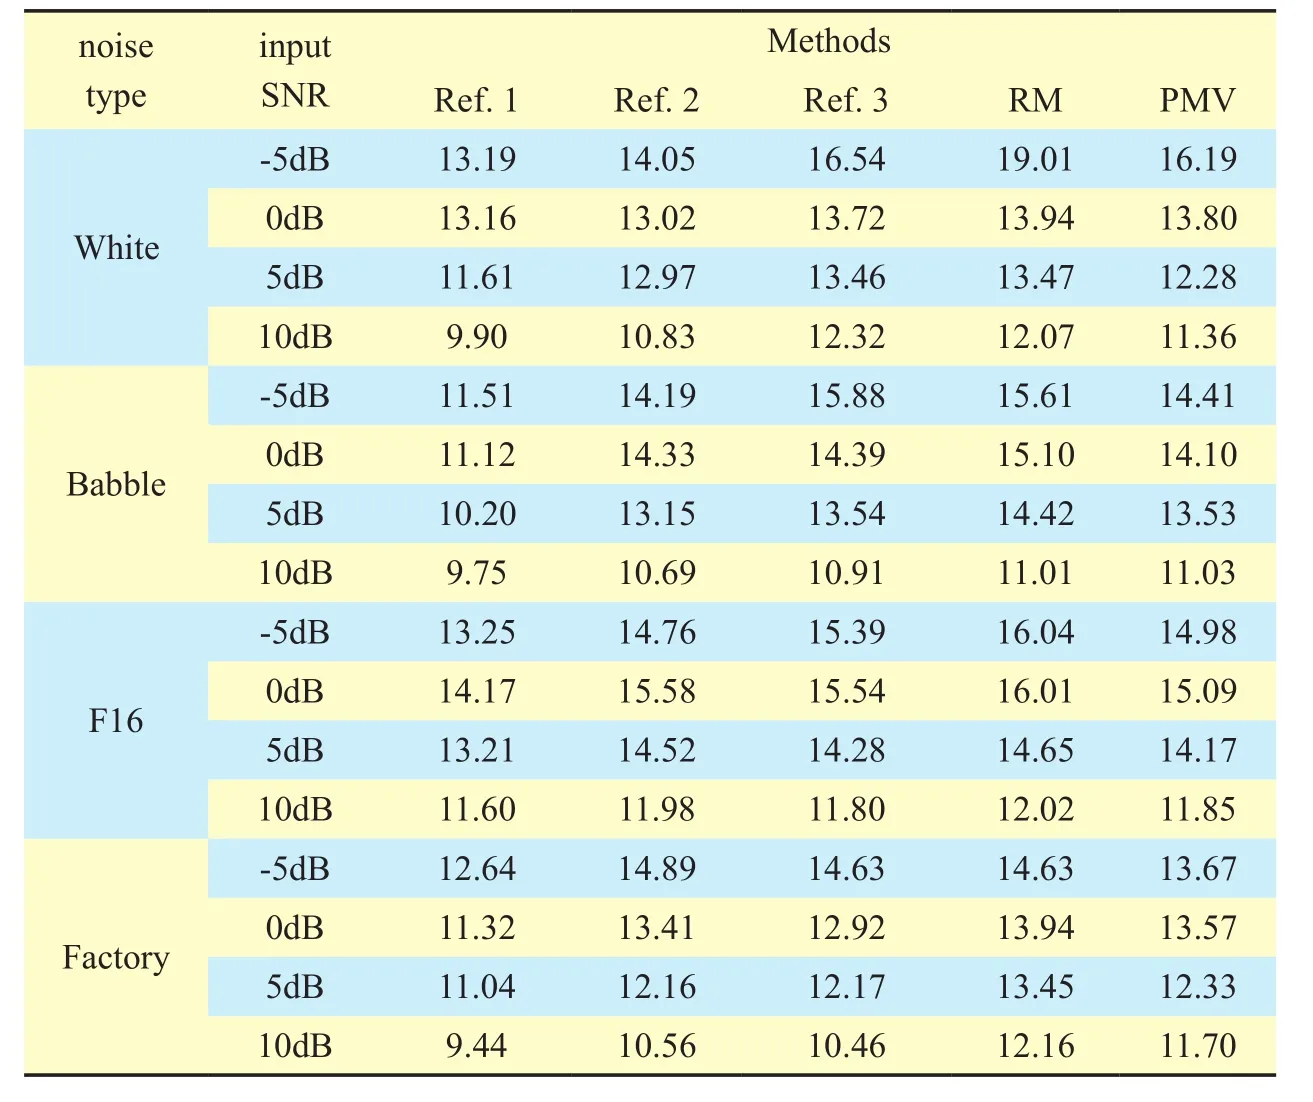
Table I Test results of SSNR improvement
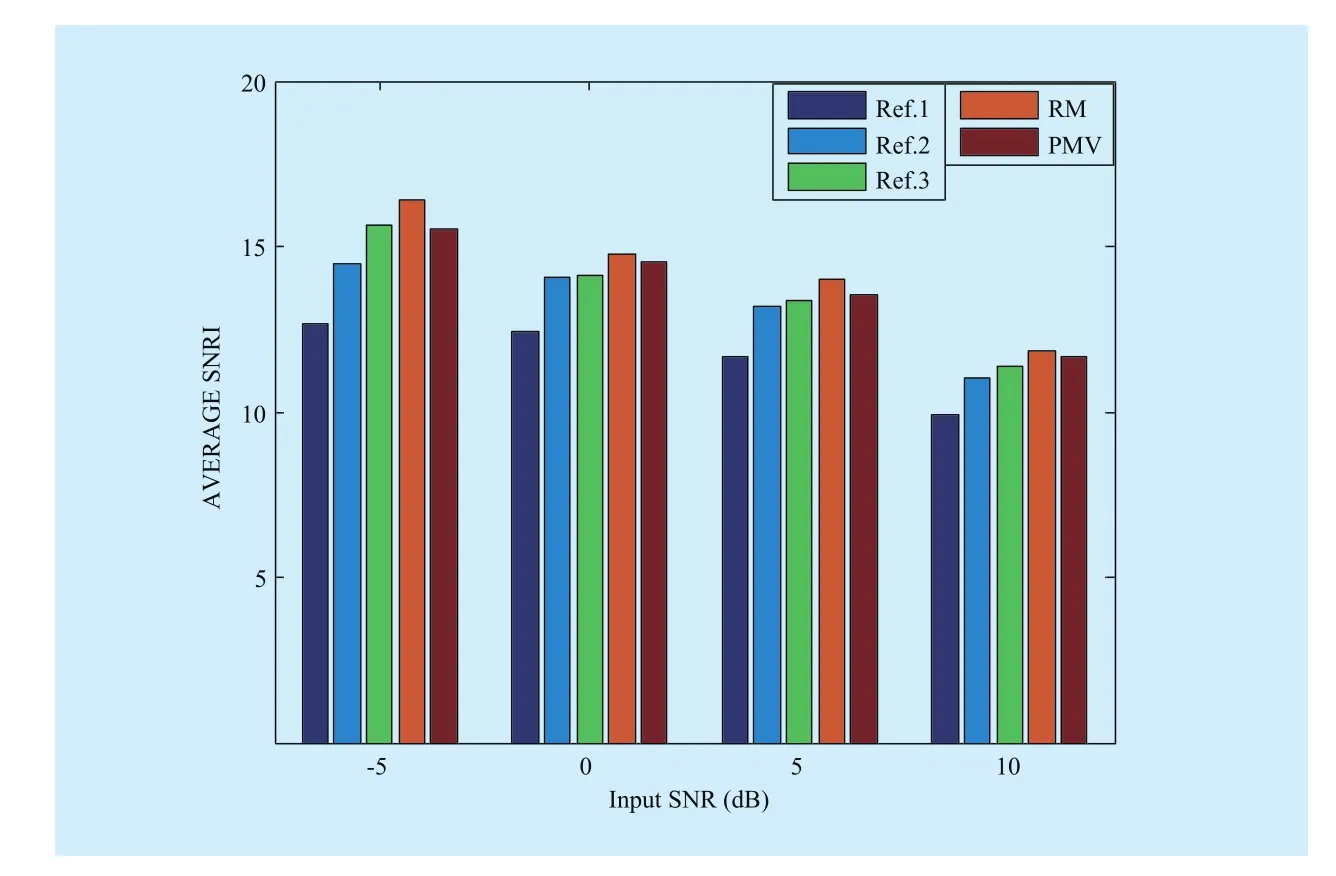
Fig. 3 Test results of average SNRI
From figure 3, we can find that the Ref.1 having the noise classification does not obtain a better performance than the other methods,which may reflect the relative lower influence of noise classification on reducing the residual noise. Our proposed RM-based method can yield much more SNR improvements than the other methods.
4.3 The STOI evaluation
In order to evaluate our system and its counterpart methods in the intelligibility, we use a short-time objective intelligibility (STOI)[22], which is shown to be highly correlated to human speech intelligibility.
Table 2 gives the STOI values for the proposed method and reference methods at different noisy conditions and input SNR values.As it can be seen from the table 2, compared with the Ref.2 and Ref.3, the Ref.1 with the noise classification does not obtain a better performance in lower input SNR. Our proposed methods give a higher STOI value than the reference methods. And we can observe that although the probabilistic mask-based reconstruction has lower SNRI result than the RM-based reconstruction, the signals obtained from the RM algorithm appear often to be inferior to those obtained with PMV masks for the STOI results. This seems to imply that the ratio mask still attempt to seek the maximiza-tion of SNR instead of considering the intelligibility improvement.
Figure 4 gives the average STOI value of different methods in different input SNR conditions. From the figure, we can find that the proposed method can obtain a higher average STOI value than the reference methods in all cases. Furthermore, the PMV-based method can obtain the best performance than the other methods.
4.4 PESQ evaluation
The PESQ is an objective evaluation of speech quality, which is often used to evaluate the quality of the restored speech. The higher PESQ score is obtained, the better the objective quality of speech signals.
Figure 5 shows the average PESQ values for the proposed method and reference methods at different input SNR levels. As it can be seen from the figure, the PESQ improvements of the proposed algorithms are larger than the Gaussian approximate reference method and the Ref.2 which is short of the accurateness of noise spectrum in the log-spectral domain. As a comparison, the amount improvement from the Ref.1 algorithm which uses two trained models is more than that from the proposed methods except for lower input SNR (e.g.,-5dB), which may demonstrate that noise classification could not provide enough accurate information for improving the speech quality in lower input SNR. In the proposed estimation framework, we can see that the result obtained by processing noisy speech with PMV is often greater than that obtained by RM processing speech in most conditions, which may show that the decision form from PMV is superior to that from RM which is similar to Wiener filtering.
V. CONCLUSIONS
In this paper, we have presented two model-based “soft-decision” algorithms for restoring clean speech signal from noisy speech signal. Our algorithms are observed to result in effective restoration of speech signal atvarious levels. In the proposed scheme, we attempt to solve two problems for speech enhancement.

Table II Test results of STOI

Fig. 4 Test results of average STOI
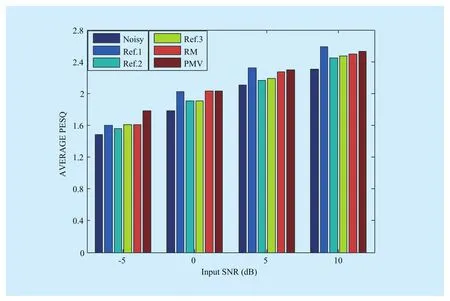
Fig. 5 Test results of average PESQ
First, in order to solve the problem of noise classification, which is often considered in the model-based methods, the speech signal is only represented by a trained model in the log-spectral domain, whereas the noise signal is considered by T-F domain model which is relative easy to calculated. In this processing,the noise statistical parameter in the T-F domain is firstly obtained. Then, the noise model is converted into the log-spectral domain directly for fitting to a log-max model. Then,two exact MMSE estimators can be achieved by invoking the log-max model for generating a normalized ratio mask. Second, an optimal LC for a certain SNR may not be appropriate for other SNRs. In view of the problem, we expect to seek the corresponding optimum LC for each SNR level so that a probabilistic mask with different LC can be obtained for improving the speech quality. In proposed estimation, the MMSE estimators used in the RM technique contain a fact that the SNR of the enhanced speech needs to be to some extent maximized as much as possible so that the RM algorithm has a better ability in reducing the noise than a simpler PMV algorithm. However, the signals obtained from the RM algorithm appear often to be inferior to that obtained by the probabilistic mask in the intelligibility.
The current algorithms also do not incorporate any spatial information in the statistical models. These may be done through the mechanism of a hidden Markov model or a Markov random field. These and other issues remain topics for future work.
ACKNOWLEDGMENT
This work was supported by the National Natural Science Foundation of China (Grant No.61471014, 61231015).
[1] M. P. Cooke, “Modeling auditory processing and organization,” Ph.D. dissertation, Dept Comput.Sci., Univ. Sheffi eld, Sheffi eld, U.K., 1991.
[2] G. Hu and D. L. Wang, “Monaural speech segregation based on pitch tracking and amplitude modulation,” IEEE Trans. Neural Netw., vol. 15,no. 5, 2004, pp. 1135–1150.
[3] Y. Shao, S. Srinivasan, Z. Jin, and D. L. Wang, “A computational auditory scene analysis system for speech segregation and robust speech recognition,” Comput. Speech Lang., vol. 24, 2010,pp. 77–93.
[4] S. T. Roweis, “One microphone source separation,” Adv. Neural Inf. Process. Syst., vol. 13,2001, pp. 793–799.
[5] D. Burshtein and S. Gannot, “Speech enhancement using a mixture-maximum model,” IEEE Trans. Acoustic, Speech, Signal Process., vol. 10,no. 6, 2002, pp. 341–351.
[6] A. Reddy and B. Raj, “Soft mask methods for single-channel speaker separation,” IEEE Trans.Audio, Speech, Lang. Process., vol. 15, no. 6,2007, pp. 1766–1776.
[7] H. Jiucang and A. Hagai, “Speech Enhancement,Gain, and Noise Spectrum Adaptation Using Approximate Bayesian Estimation,” IEEE Trans.Acoustic, Speech, Signal Process., vol. 17, no. 1,2009, pp. 24–37.
[8] K. Hu and D. L. Wang, “An iterative model-based approach to cochannel speech separation,”EURASIP J. Audio, Speech, Music Process., vol. 14,2013, pp. 1-11.
[9] M. H. Radfar and R. M. Dansereau, “Single-channel speech separation using soft masking filtering,” IEEE Trans. Audio, Speech, Lang.Process., vol. 15, no. 8, 2007, pp. 2299–2310.
[10] R. Weiss and D. Ellis, “Speech separation using speaker-adapted eigenvoice speech models,”Comput. Speech Lang., vol. 24, 2010, pp. 16–29.
[11] S. Srinivasan, J. Samuelsson, and W. B. Kleijn,“Codebook driven short-term predictor parameter estimation for speech enhancement,” IEEE Trans. Audio, Speech, Lang. Process., vol. 14, no.1, 2006, pp. 163–176.
[12] S. Srinivasan, J. Samuelsson, and W. B. Kleijn,“Codebook-based Bayesian speech enhancement for nonstationary environments,” IEEE Trans. Audio, Speech, Lang. Process., vol. 15, no.2, 2007, pp. 441–452.
[13] M. H. Radfar and A. H. Banihashemi, R. M.Dansereau, and A. Sayadiyan, “A non-linear minimum mean square error estimator for the mixture-maximization approximation,” Electron.Lett., vol. 42, no. 12, 2006, pp. 75–76.
[14] D. S. Brungart , P. S. Chang , B. D. Simpson and D. L. Wang, “Isolating the energetic component of speech-on-speech masking with ideal time–frequency segregation”, J. Acoust. Soc. Amer.,vol. 120, no. 6, 2006, pp. 4007-4018.
[15] M. C. Anzalone, L. Calandruccio, K.A. Doherty,and L. H. Carney, “Determination of the potential benefit of time-frequency gain manipulation,” Ear Hear. vol. 27, no. 5, 2006, pp. 480–492.
[16] M. Geravanchizadeh and R. Ahmadnia, “Monaural speech enhancement based on multi-threshold masking,” In blind source separation, G.R.Naik, W. Wang, Springer Berlin Heidelberg, 2014,pp. 369-393.
[17] A. Papoulis and S. U. Pillai, “Probability, Random Variables and Stochastic Processes,” 4th ed. New York: McGraw-Hill, 2002.
[18] S. Gazor and W. Zhang, “Speech probability distribution,” IEEE Signal Process. Lett., vol. 10, no.7, 2003, pp. 204-207.
[19] I. S. Gradshteyn and Z. M. Ryzhik, “Table of Integrals, Series, and Products,” New York: Academic, 1980.
[20] IBM Application Program, System/360 Scientific Subroutine Package 360A-CM-O3X, Version 111, 1968, pp. 368-369.
[21] Y. Linde, A. Buzo, and R. MmGray, “An algorithm for vector quantization design,” IEEE Trans.Commun., vol. C-28, no. 1, 1980, pp. 84–95.
[22] C. H. Taal, R. C. Hendriks, R. Heusdens, et al, “An algorithm for intelligibility prediction of time–frequency weighted noisy speech,” IEEE Trans.Audio, Speech, Lang. Process., vol. 19, no. 7,2011, pp. 2125-2136.
- China Communications的其它文章
- An Iterative Detection/Decoding Algorithm of Correlated Sources for the LDPC-Based Relay Systems
- Homomorphic Error-Control Codes for Linear Network Coding in Packet Networks
- Polar-Coded Modulation Based on the Amplitude Phase Shift Keying Constellations
- A Privacy-Based SLA Violation Detection Model for the Security of Cloud Computing
- An Aware-Scheduling Security Architecture with Priority-Equal Multi-Controller for SDN
- A Flow-Based Authentication Handover Mechanism for Multi-Domain SDN Mobility Environment

