Transonic wing stall of a blended flying wing common research model based on DDES method
Tao Yang,Li Yonghong,Zhang Zhao,Zhao Zhongliang,Liu Zhiyong
aState Key Laboratory of Aerodynamics,China Aerodynamics Research and Development Center,Mianyang 621000,China
bHigh Speed Aerodynamic Institute,China Aerodynamics Research and Development Center,Mianyang 621000,China
Transonic wing stall of a blended flying wing common research model based on DDES method
Tao Yanga,b,*,Li Yonghongb,Zhang Zhaob,Zhao Zhongliangb,Liu Zhiyongb
aState Key Laboratory of Aerodynamics,China Aerodynamics Research and Development Center,Mianyang 621000,China
bHigh Speed Aerodynamic Institute,China Aerodynamics Research and Development Center,Mianyang 621000,China
Numerical simulation of wing stall of a blended flying wing configuration at transonic speed was conducted using both delayed detached eddy simulation(DDES)and unsteady Reynolds-averaged Navier-Stokes(URANS)equations methods based on the shear stress transport(SST)turbulence model for a free-stream Mach number 0.9 and a Reynolds number 9.6×106.A joint time step/grid density study is performed based on power spectrum density(PSD)analysis of the frequency content offorces or moments,and medium mesh and the normalized time scale 0.010 were suggested for this simulation.The simulation results show that the DDES methods perform more precisely than the URANS method and the aerodynamic coefficient results from DDES method compare very well with the experiment data.The angle of attack of nonlinear vortex lift and abrupt wing stall of DDES results compare well with the experimental data.The flow structure of the DDES computation shows that the wing stall is caused mainly by the leeward vortex breakdown which occurred at x/xcr=0.6 at angle of attack of 14°.The DDES methods show advantage in the simulation problem with separation flow.The computed result shows that a shock/vortex interaction is responsible for the wing stall caused by the vortex breakdown.The balance of the vortex strength and axial flow,and the shock strength,is examined to provide an explanation of the sensitivity of the breakdown location.Wing body thickness has a great influence on shock and shock/vortex interactions,which can make a significant difference to the vortex breakdown behavior and stall characteristic of the blended flying wing configuration.
1.Introduction
The development of studying and understanding the phenomenon of vortex lift has greatly impacted the aerodynamic con figuration of the modern fighters,and the aerodynamic configuration using delta wing with large sweep angle has become one of the research topics.1–3This kind of aerodynamic layout has the evident advantages of maneuverability,agility and stall incidence increase.4,5The occurrence of shocks on delta wings introduces complex shock/vortex interactions,particularly at moderate to high angles of incidence.These interactions can make a significant difference to the vortex breakdown behavior.With the increase in angle of attack,flight vehicles would suffer abrupt wing stall due to the condition change such as adverse pressure gradient.The reason for abrupt wing stall is nonlinear lift loss caused by the leeward vortex breakdown,and the mechanism and impact factors are very complicated.5–7The strengthening of the shock which stands off the sting as the incidence is increased can lead to a shock/vortex interaction triggering breakdown.The location of breakdown can shift upstream by as much as 30%of the chord at a single 1°incidence interval2,3due to this interaction.Much literature has reported studies of this problem via theoretical analysis,experiments and numerical computations.8Because the wing stall and vortex breakdown phenomenon involve the computation offlow separation,the accuracy of unsteady Reynoldsaveraged Navier-Stokes(URANS)equations method is insuff icient and thus causes the deviation between the calculated stall angle and experimental data.9,10As a hybrid method applied to simulating this kind of separation flow,delayed detached eddy simulation(DDES)takes the advantages of higher precision and acceptable computation consumption.It has been applied to many problems,such as shock vibration of transonic wing,cavity flow,and wing separation flow.11–15
Aerodynamic efficiency defined as MaCL/CDhas been steadily increasing from 13 in 1960 to 16 in the mid-1990s16,where Ma is stream velocity Mach number,CLis lift coefficient and CDisdragcoefficient.Higheraerodynamicefficiencywillbenefit the flight range and fuel economy,and thus aircraft designers pursuehighercruisingspeedaswellaslowerdragandhigherlift to drag ratios.As an example the cruising speed increases from Ma=0.78 for A320 to about Ma=0.85 for A380.
Blended-wing-body(BWB)configuration takes an advantage of lift to drag ratios compared with traditional configurations.The developing BWB aircraft of Boeing Company aims at a design cruising Ma=0.85.The low aspect ratio blended flying wing con figuration has more potential on increasing cruising speed.The most typical example is X47b which is de fined as a cruising speed at high subsonic speed and some literature explicitly refers to it as about Ma=0.9.
The measured data from 2.4 m×2.4 m transonic wind tunnel at transonic conditions17(Ma=0.8 and 0.9)showed a sudden jumpofthebreakdownlocationtowardthewingapexofablended flying wing common research model when a critical angle of incidence was reached.All the computation study was conducted at Ma=0.9 because the flow condition at this Mach number was more similar to the design cruising speed and the shock wave/vortex interaction phenomenon was more typical.DDES model wasemployedtostudythetransonicstallproblem,andbycomparing with URANS and experimental data,the accuracy and applicability were validated.The flow structures and the role of vortex breakdown at stall angles of attack were brie fly analyzed,too.
2.Mathematical formulation and numerical method
2.1.Governing equations and numerical procedure
The governing equations,which are the three-dimensional time-dependent compressible Navier-Stokes equations,can be written in terms of generalized coordinates as

where^Q is the vector of conserved variables,density,momentum and total energy per unit volume,^E,^F,^G are inviscid flux terms and,^Ev,^Fv,^Gvare viscous flux terms.A general,3D transformation between the Cartesian variables(x,y,z)and the generalized coordinated(ξ,η,ζ)is implied.
The equation of state for an ideal gas is used and the molecular viscosity is assumed to obey Sutherland’s law.To nondimensionalize the equations,we use the free-stream variables including the density,temperature,speed of sound,and root chord of the blended wing as characteristic scales.
The initial and boundary conditions are presented as follows.The initial condition is set as the free-stream quantities.The far field boundary conditions are treated by local onedimensional Riemann-invariants.No-slip and adiabatic conditions are applied on the aircraft surface.
The governing Eq.(1)is discretized using finite volume method and the time term is discretized by an implicit approximate-factorization method with sub-iterationsto ensure the second-order accuracy Simon et al.18.In this paper,the convective terms were adopted by second-order central difference scheme and a fourth-order artificial viscous term was introduced to restrain the numerical oscillation Lu et al.19and Wang et al.20.To capture the discontinuity caused by shockwave,a second-order upwind scheme with the Roe_s flux-difference splitting is introduced into the inviscid flux.The arti ficial dissipation is also turned off in the region where the upwind scheme works.
A binary sensor function Φi+1/2at cell face i+1/2 is used for the detection of shockwaves.Φi+1/2is determined by the pressure and density curvature criteria proposed by Hill et al.21

2.2.Turbulence modeling
DDES simulation is implemented in the present work for turbulence closure.22–24The k-ω based shear stress transport(SST)model was designed to give highly accurate predictions of the onset and the amount offlow separation under adverse pressure gradients by the inclusion of transport effects into the formulation of the eddy-viscosity.We can refer to the Ref.23for details on the constants and the quantities involved.
The original DES method depends on the mesh scale seriously.If the mesh is too intensive within the boundary layer,the RANS will prematurely switch to large eddy simulation(LES)inducing Reynolds modeled stress depletion(MSD)and grid induced separation(GIS).25Focusing on this problem,Menter improved the SST-DES model to SST-DDES method.23
The governing equations of the SST-DDES model read as23
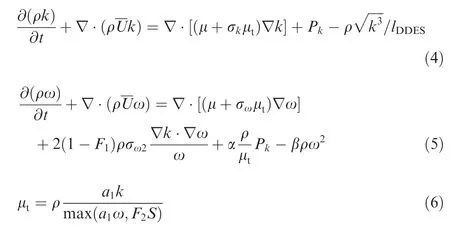
where k is the turbulent kinetic energy,U the velocity,ω the specific dissipation rate,ν the kinematic viscosity,t the time,μ viscosity coefficient,μtthe turbulence viscosity coefficient,Pkthe turbulence production term,lDDESthe DDES length scale,and S the magnitude of the strain rate tensor.F1and F2denote the SST blending functions which read as follows

Here hmaxis the maximum edge length of the cell.Finally,the empiric blending function fdis computed with the use of the following relations:

Here Ω is the magnitude of vorticity tensor.The model constantsread asfollows:Cμ=0.09,k=0.41,a1=0.31,CDES1=0.78,CDES2=0.61,CD1=20,CD2=3.
All the constants are computed by a blend from the corresponding constants of the k-ω model via α = α1F1+ α2(1-F1). α1=5/9, α2=0.44, β1=0.075, β2=0.0828,σk1=0.85,σk2=1,σω1=0.5,σω2=0.856.
3.Model and simulation cases
3.1.Model
In order to meet the needs offuture aircraft aerodynamic test and research,the relevant domestic institutions independently have designed a blended flying wing common research model,as a low-aspect ratio flying wing shape of general research platform.17The basic geometry parameters of the low aspect ratio flying wing model are shown in Fig 1:the leading edge sweepback angle is 65°,the rear sweepback angle is±47°,the length of the whole model cris 15.32 m,the averaged aerodynamic chord length crefis 9.56 m,and the distance between the moment reference point and the leading edge is 6.9 m.To compare with the experiments,the model used for simulation and wind tunnel test scaled to 1/19.
3.2.Mesh accuracy and time step
Structured mesh is applied and far-field boundary condition is set 15 times of the root chord length to the model surface and non-reflection condition.Unsteady simulation was employed;Mach number is 0.9,and Reynolds number based on the averaged aerodynamic chord length is 9.6×10⁶.Each case is calculated for 10000 steps.The first 3000 steps are used to gain stable flow field while 3000–10000 steps are the effective data for analysis.
Before calculating physical problem by unsteady computation,at first the density of the mesh used should be considered if it is enough for the spatial flow field structures and whether the time step is proper for revealing unsteady fluctuation information.In this paper,the method proposed in Ref.22is used to check the mesh independence and the time step.Power spectrum density(PSD)analysis is applied to analyzing the aerodynamic force and the moment time history.For a given amount of the mesh,the physical time step should be short enough to keep the frequency offluctuations unchanged.
The independence of mesh dense and time step is studied at the angle of attack of 14°.As shown in Fig.2,three mesh types of different densities are adopted,namely coarse mesh(5 million),medium mesh(10 million),fine mesh(20 million),and the normalized time scale is taken as t*=0.020,t*=0.010 and t*=0.005,whereΔt is real time step length,U∞is stream velocity,¯c is root chord length,and f is frequency offore and moment.
It takes 100 physical time steps for the free-stream flow to pass the root chord length when t*=0.010.For medium mesh,the PSD of pitching moment time history of different time steps is analyzed as shown in Fig 3.When normalized time scale is less than 0.010,the main frequency of the pitching momentalmostremainsinvariableatSt=1.85.Thus t*=0.010 is proper for the time normalization for medium mesh.
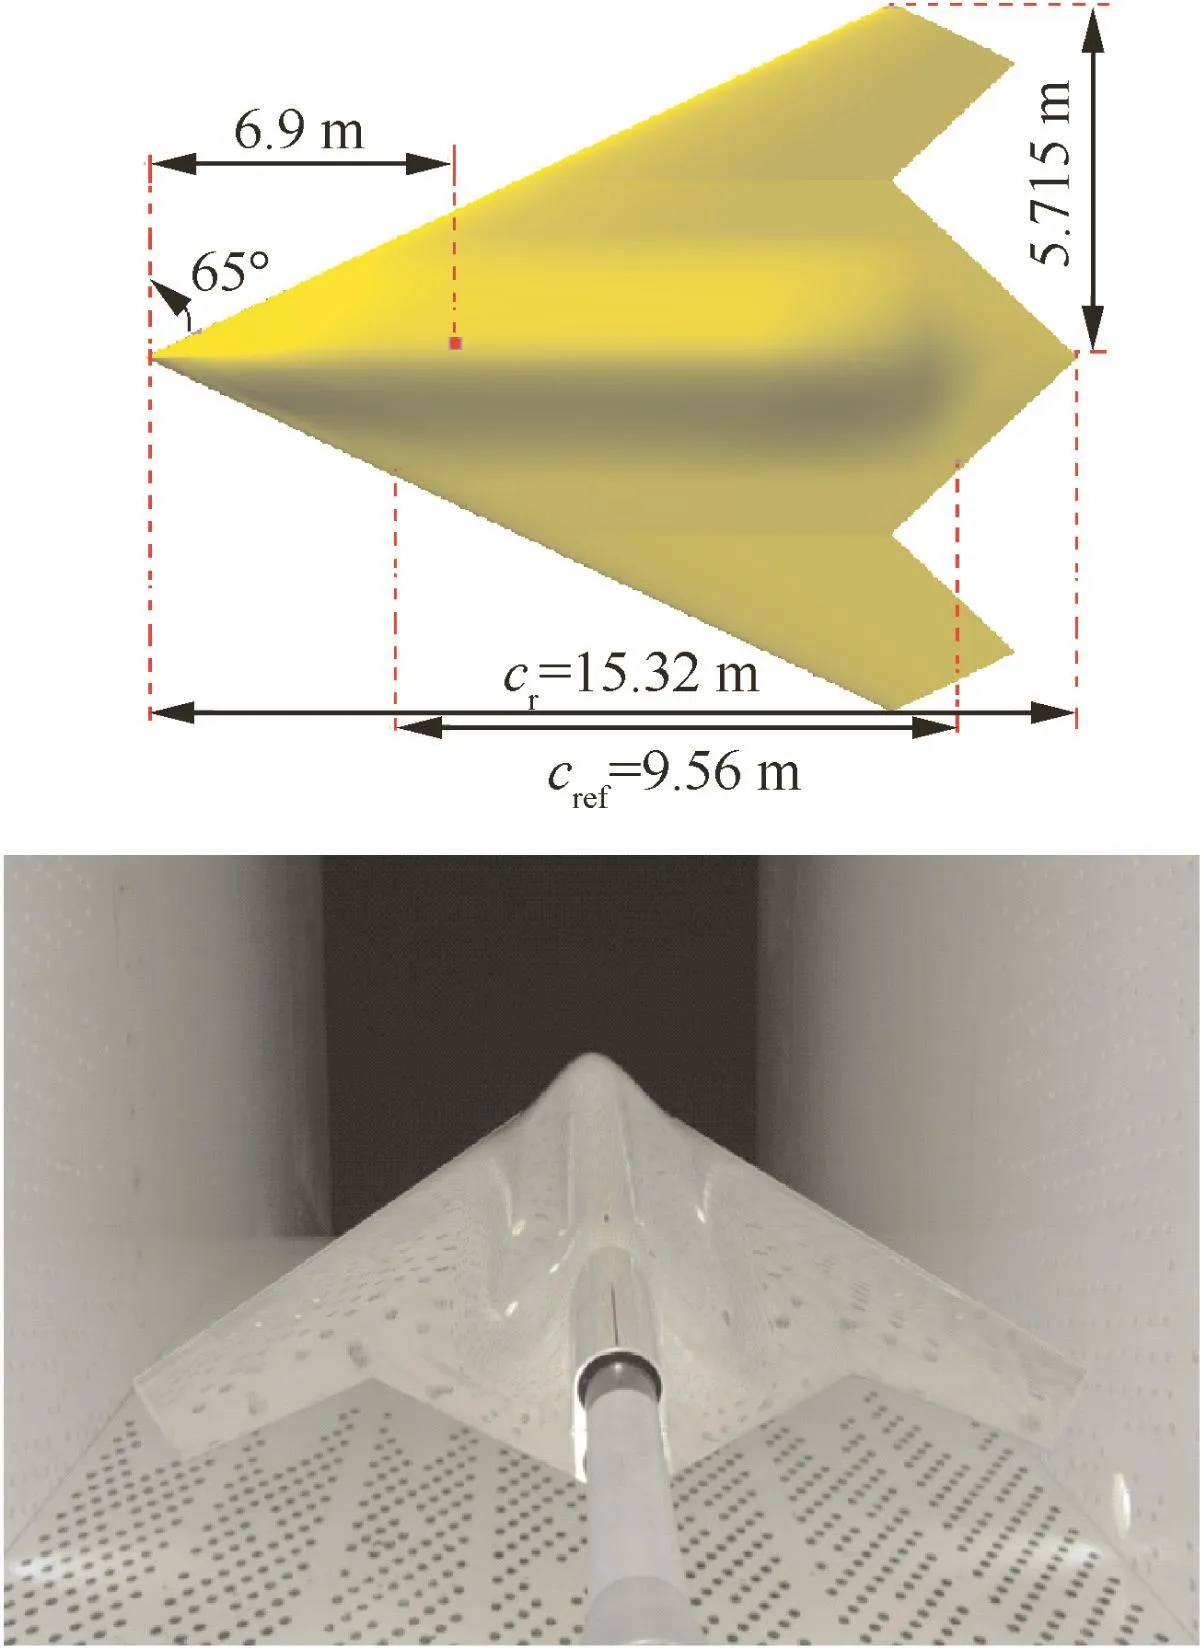
Fig.1 Basic geometry parameters of model.
The grid refinement factor is defined as22

where N1and N2are the number of grid points in the finer and coarser of the two grids being compared respectively and d is the spatial dimension(three in our case).The grid convergence index(GCI)is defined as

where Fsis a safety factor of 3.0,n is the order of accuracy for the spatial scheme employed,and f1,f2are the finer and coarser grid global solution quantities(CL,CD,Cm)considered.
The GCI values for the force and moment coefficients are provided in Table1 forsimulationsat α=14° and t*=0.01.The GCI values are relatively low when comparing the three grids,and slightly decrease when comparing with the medium and fine grids.Through the GCI values we can see that the grid volume has little effect on the aerodynamic coefficients of the model,and the medium grids can afford the simulation.
4.Results and analysis
4.1.Comparison of simulation results of DDES and URANS
In order to compare DDES and URANS on the simulation ability of the transonic aerodynamic features of the low aspect ratio flying wing configuration,the SST turbulent modeling is applied to both DDES and URANS.Based on the results of simulation and experiment data17as shown in Fig.4,the lift increases linearly when the angle of attack is less than 4°,while evident vortex lift appears at the angle of attack higher than 4°.At the angle of attack smaller than 12°,both methods can reveal the vortex lift well.However,when the angle of attack is higher than 14°,the lift drops down abruptly,namely abrupt wing stall,and after that it goes up gradually.This phenomenon can be revealed from the curves of drag and pitching moment,which is the abrupt drop of drag and the increase in nose-up pitching moment.It can be found from the results of the two methods that DDES can capture the abrupt wing stall and gain the aerodynamic force which matches the experimental data well.Although URANS reveals the abrupt wing stall too,the calculated stall incidence is 2°larger than the experiment results.Thus it can be gained that DDES is better than URANS to reveal the abrupt wing stall and has the advantage of simulating this kind of separation flow.
The flow field structures at stall incidence of α =14°are analyzed using Q criterion(namely the second invariant tensor of velocity gradient)to describe the vortex system structure.The instantaneous Q criterion isosurface calculated from these two methods is shown in Fig.5.It can be seen from Fig.5(a)that in the flow field calculated by URANS method,two main vortexes in the whole lee side did not break down until it was dissipated at the rear of the model.This corresponds to the aerodynamic force of non-abrupt wing stall calculated by URANS.Fig.5(b)represents the vortex structures of the flow field calculated by DDES method.It can be found that the two main vortexes break down at the location around x/xcr=0.6 on the lee side,which matches the location where the lift coefficient drops down abruptly,where x is streamwise location and xcris chord length.The pressure coefficient is larger downstream of the vortex breakdown location than that upstream.Flow field simulated by DDES matches the experiment results qualitatively,and this method can explain the abrupt wing stall phenomenon reasonably.Thus the results analyzed below are gained by DDES method.
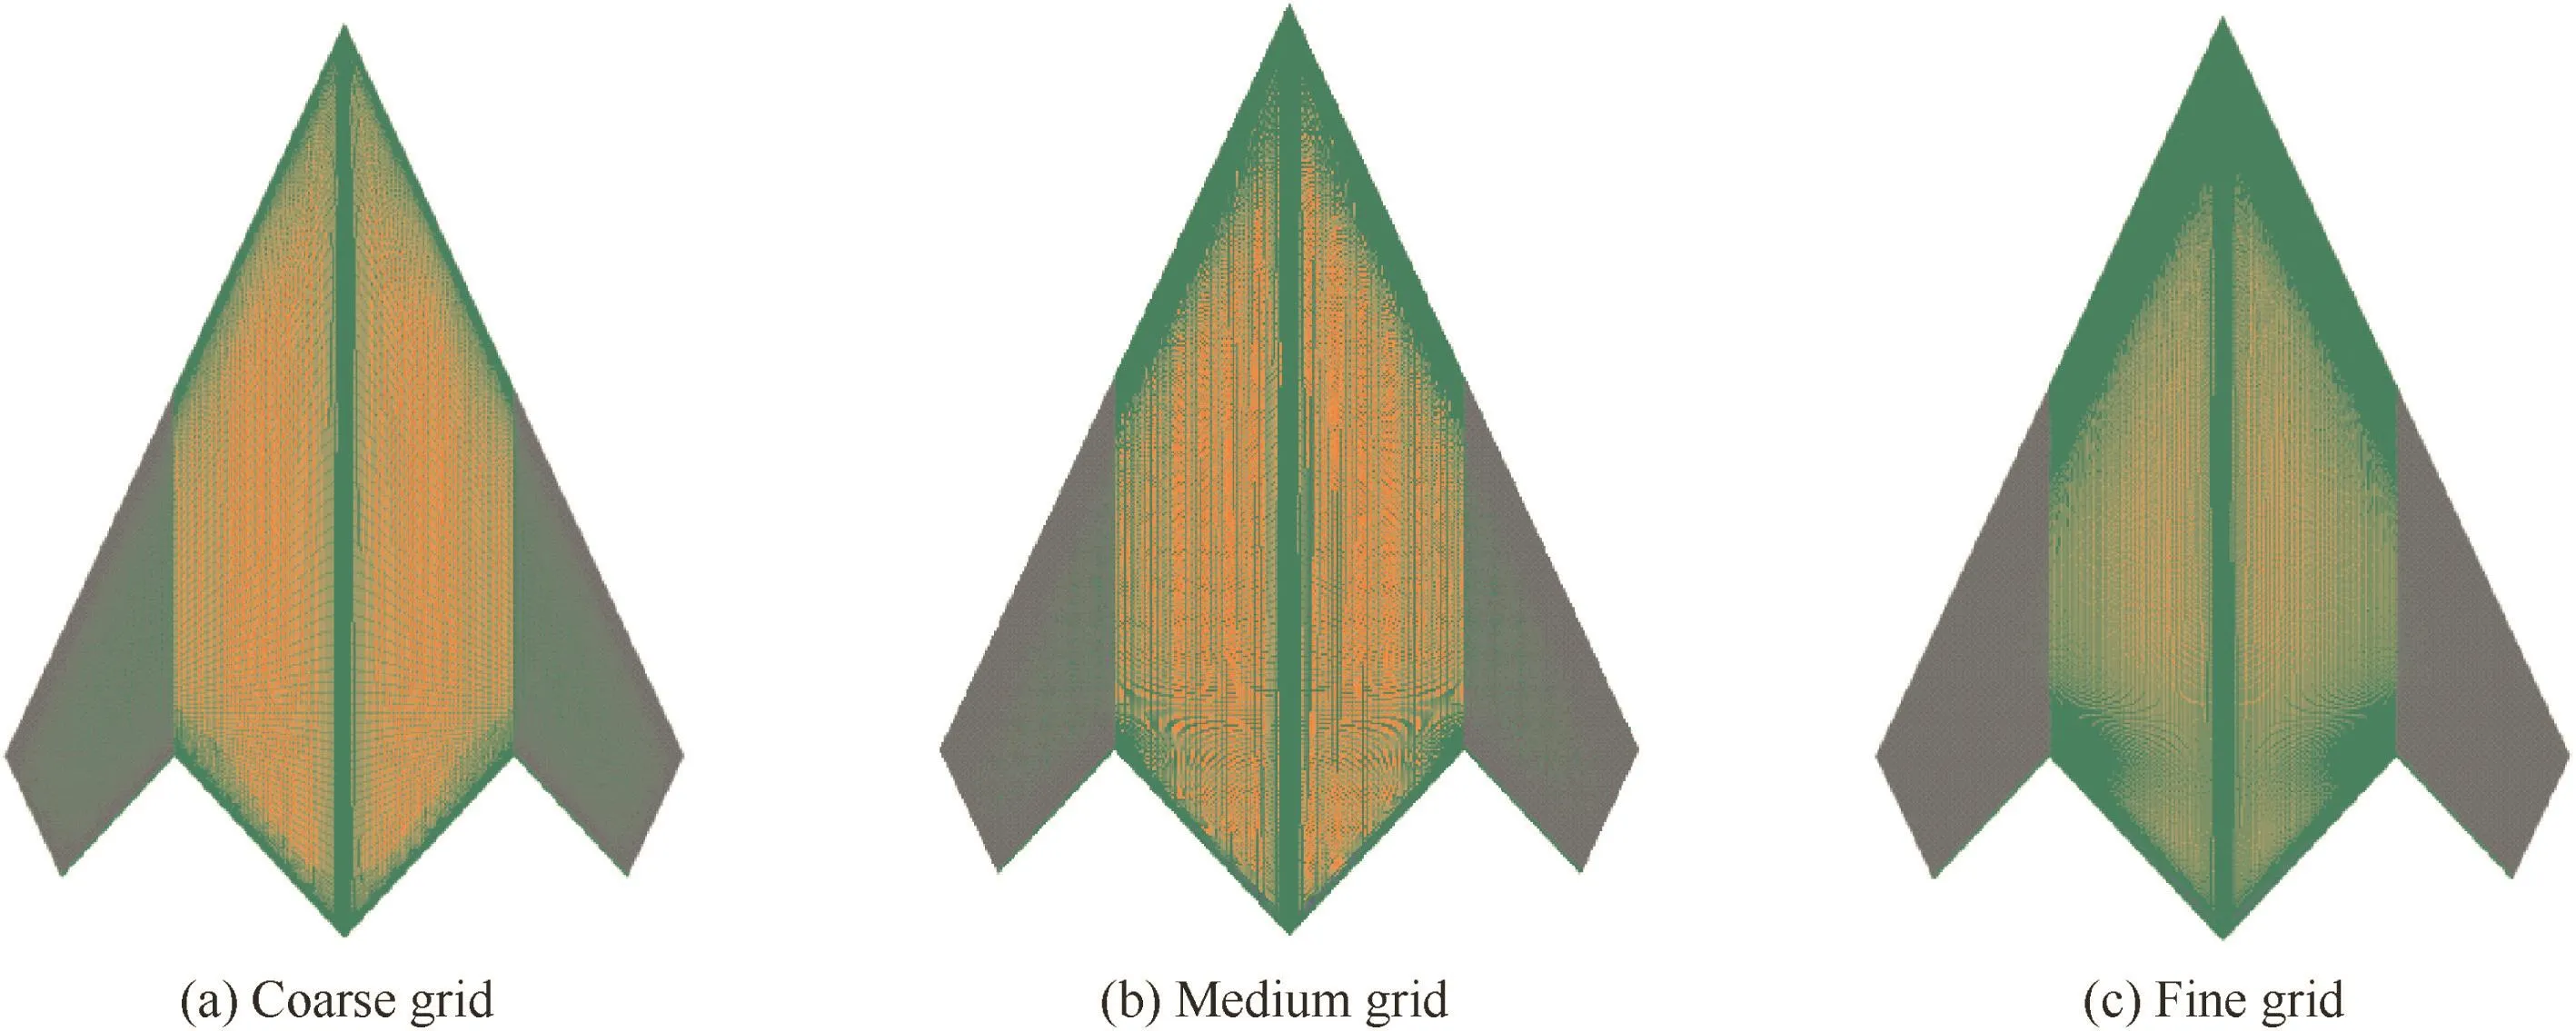
Fig.2 Computational grid.
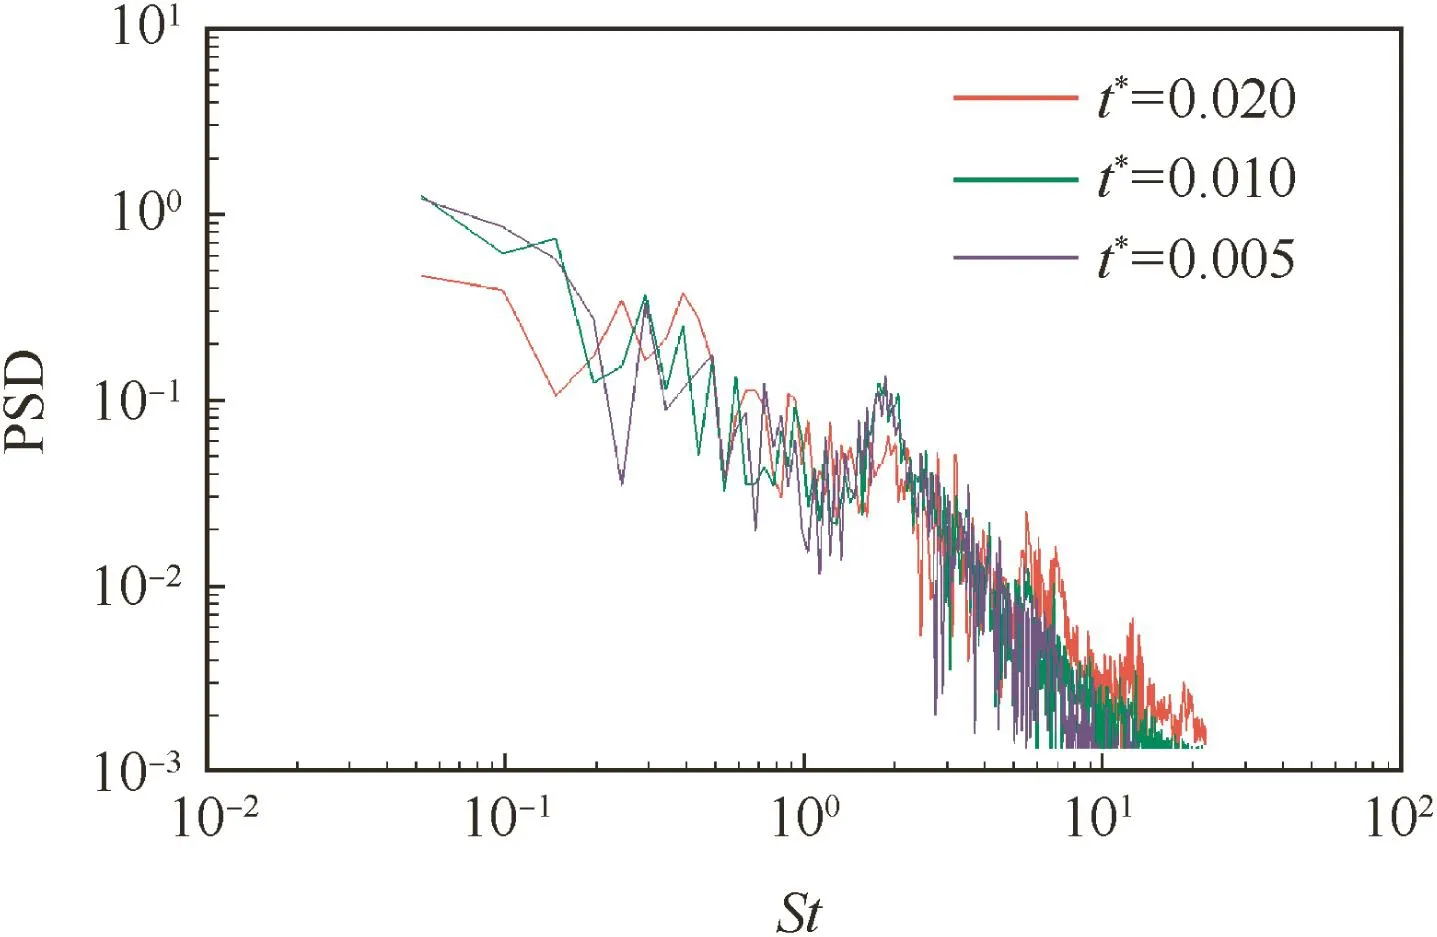
Fig.3 Variation of pitching moment power spectrum density with time step for medium density mesh.
The calculated streamline on the surface is compared with the oil visualization result,as shown in Fig.6.Three typical states are selected and analyzed,which are α =10°,14°,16°corresponding to the states before,at and after abrupt wing stall respectively.The black line in the oil visualization represents the separation line,while the red one means the reattachment line.Based on Fig.6,the calculated results in most regions match the experimental data well.In different states,the streamlines on the surface change with the variation of the vortex spatial structures.
When α =10°,two evident reattachment lines and a separation line appear on the surface alternately,and there exists a separation line even at the leading edge.It can be revealed from the vortex counter that strong leading edge vortex appears on the lee side and induces the second vortex,which increases the suction and vortex lift.
When α =14°,an evident reattachment line and a separation line appear on the upper surface,and the leading edge.Evident stacking appears in the middle and tail section of the separation line,and based on the vortex counter,the leading edge vortex has broken up at this location where there is 13%body length ahead compared with that of α =10°.Due to the breakdown of the leading edge vortex,the vortex lift of this region decreases dramatically which results in the lift coefficient decrease and positive pitching moment.
When α=16°,an evident reattachment line and a separation line appear on the upper surface and a separation line exists near the leading edge.The flow feature is similar to that of α =14°,but the vortex broken location is ahead within small region.Compared with the α =14°case,due to the development of leading edge vortex,the increase in vortex lift is more than the decrease caused by the vortex broken ahead,and thus the vortex lift and the lift coefficient of the whole vehicle go up with the increase in angle of attack.
4.2.Vortex force component and role of vortex breakdown
The variation of the lift characteristic of the low aspect ratio flying wing con figuration studied in this paper is directly related to the formation,development and breakdown of the leading edge vortex on the lee side.To view the variation of the vortex lift in detail,the leading edge suction analogy method proposed by Polhamus26is applied to decomposing the lift into potential lift and vortex lift as follows:

where CLpindicates potential lift coefficient and CLvthe vortex lift coefficient.Because the lift at zero-incidence is not zero due to the curve of the airfoil cross section of the studied flying wing configuration,the lift decomposition equation of Polhamus is revised in this paper that a constant CL0which represents the zero-incidence lift coefficient is introduced into the equation to make it more applicable to the problem discussed herein.Thus the final equation for potential lift coeff icient is

where Kpis the lift-curve slope given by small-angle-of-attack potential-flow lifting surface theory,and accounts for the true boundary condition,and cos2α arises from the assumption of a Kutta-type flow condition at the leading edge.
While the equation for the vortex lift is used by the result of typical leading edge suction analogy method.

where Kvsin2α represents the potential-flow leading-edge suction,therefore the vortex normal force,and cosα indicates the component in the lift direction.
The flying wing model used here has a low aspect ratio equal to 1.54,and the leading edge sweepback angle is 65°,the rear sweepback angle is ±47°,aspect ratio 1.54.For those parameters,Kp=1.9 and Kv=2.7 can be obtained with Polhamus approach26based on the Variations figure of Kpand Kvfor delta wings provided by Ref.26.Because the Polhamus approach is suitable for incompressible flow mainly,a correction should be made for the compressible effect.
According to Glauert rule,compressibility has no effect on the aerodynamic force of delta wing,when the Mach number is lower enough.

Take the assumption that CLpand CLvobey Glauert rule too.

Table 1 Force and moment coefficients for the three grids used in convergence study at α =14°.
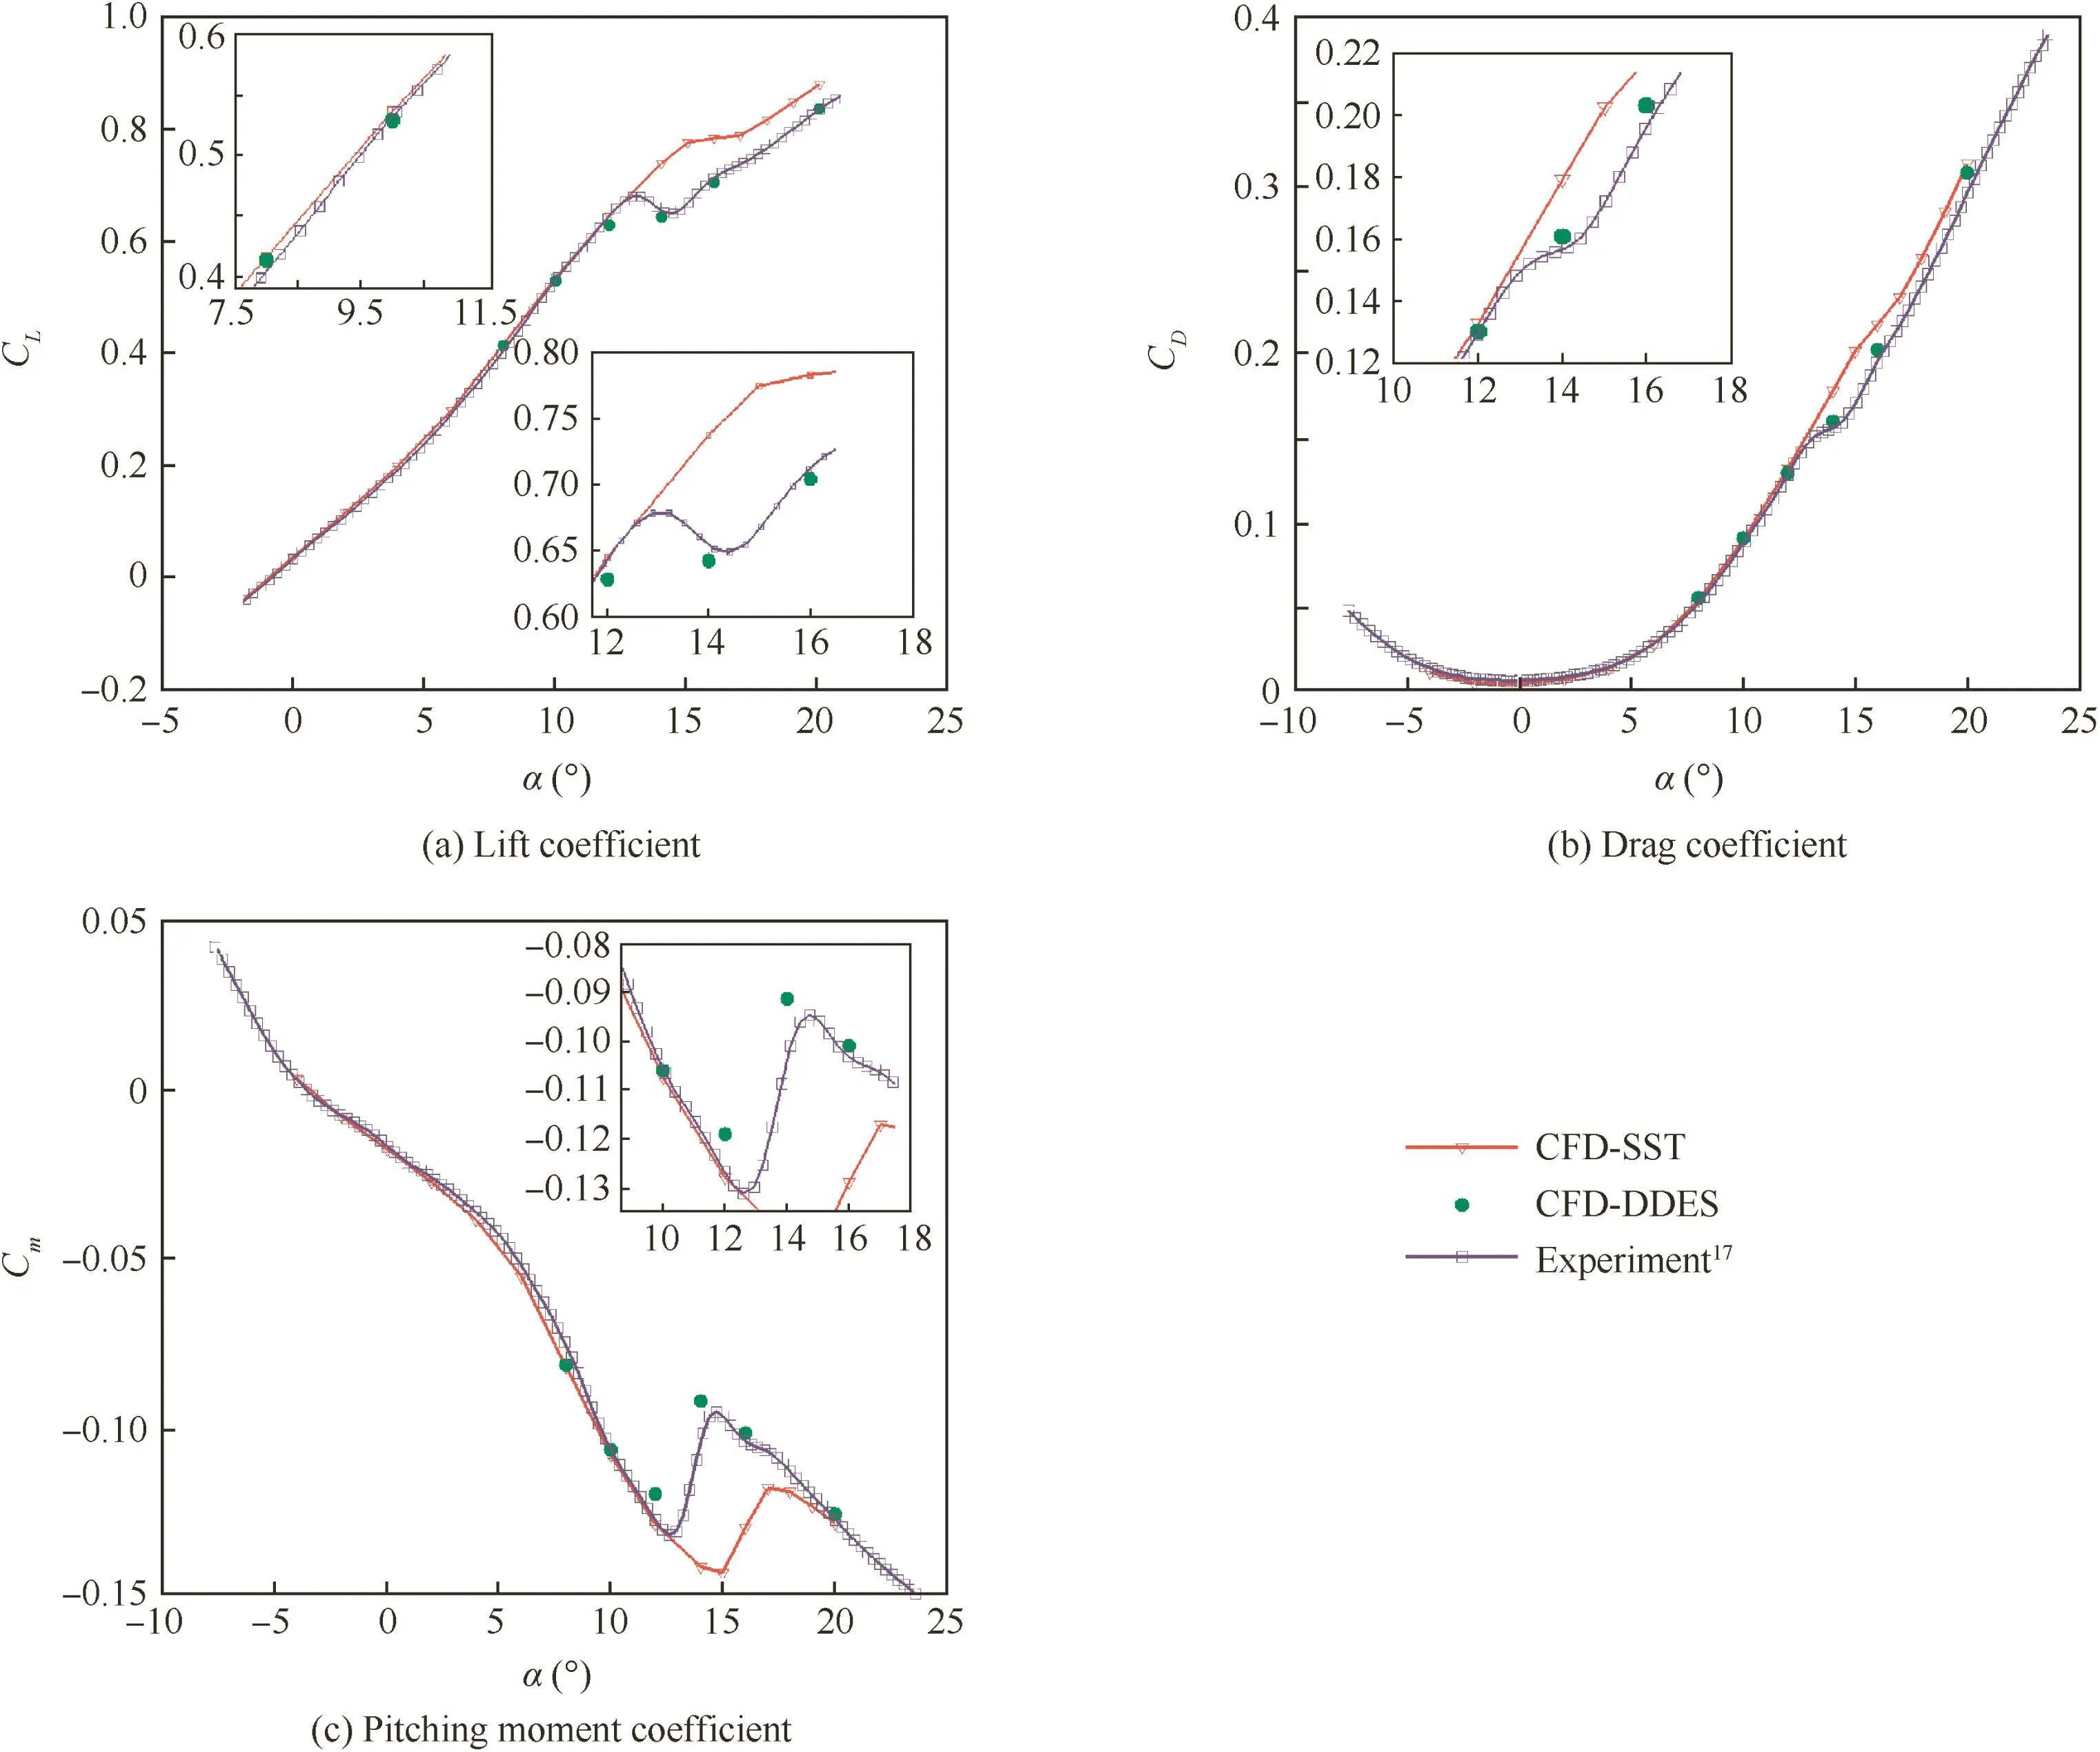
Fig.4 Comparison of aerodynamic coefficients.

So Kp=4.3589 and Kv=6.1942 at Ma∞=0.9.
Fig.7 shows the comparison of lift coefficients predicted by Polhamus approach and Glauert rule and obtained from experiments.The predicted lift is much higher than the experiment results.So for transonic flow,this does not hold true in the case of such high number flow.
Because the traditional Polhamus approach and Glauert rule have low precision to decompose vortex force component at transonic flow,the least square method (LSM)was employed to calibrate the Kpand Kvin this study.Lift coeff icient curve shows that the slope is basically linear at angle of attack ranging from-2°to 4°.In this range,the least square method is used to fit the Eq.(22)and then Kpand CL0were calibrated as at Ma∞=0.9.Then the potential lift coefficient curve CLpcan be achieved as shown in Fig 7.
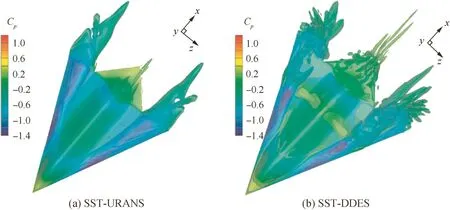
Fig.5 Instantaneous Q criterion isosurface(α =14°,Q=10).
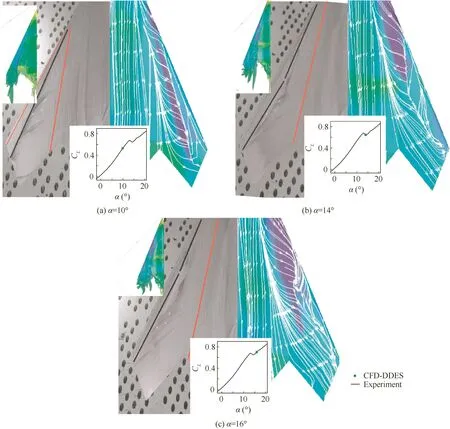
Fig.6 Comparison of calculated streamline on surface and oil visualization results.
The true vortex lift coefficient curve named as CL-CLpcurve can be obtained by CLminus the potential lift coefficient CLp.In this range from 4°to 12°,the least square method is used to fit the Eq.(23)and then Kvwas calibrated.In this case Kvequals to 3.149;the detail results are shown in Fig.7.
From the fitting results of the vortex lift coefficient curve,the fitting curve does not match the original curve very well but it still represents its main characteristics.
Since the lift coefficients of CFD match well with the experimental result at low angle of attack,CLpDDESwas replaced by CLpLSM.The vortex lift coefficients of DDES method were computed by CLDDES-CLpLSMas shown in Fig.7.
The vortex lift coefficient calculated by the method above is shown in Fig.7 where it can be found that the vortex lift remains zero when the angle of attack is less than 4°meaning the leading edge vortex has not formed yet;however,the vortex lift increases dramatically when the angle of attack is more than 4°.With the increase in angle of attack,the vortex lift coefficient suffers abrupt drop down when the angle of attack is more than 12°,which causes the abrupt decrease in the lift coefficient offlying wing configuration model.To explain the relation between the abrupt decrease and the vortex breakdown and the mechanism of vortex breakdown,the detail of the flow field is investigated.
Fig.8 shows the pressure distribution p/prefthrough vortex cores at α =12,14°,which indicates that shocks/vortex interactions do exist in the flow.These shocks/vortex interactions influence the flow structures obviously especially at larger angles of incidence.At α =12°,two adverse pressure gradients at location of x/xcr=0.33 and x/xcr=0.77 affect the vortex strength to a different extent.At the first location,the adverse pressure gradient is low(∂p/∂xaxial=-0.43),which has a small influence on the vortex stability.However,at the second location where a strong normal shock exists,the pressure through vortex cores has a sudden rise and the adverse pressure gradient is high(∂p/∂xaxial=-4.17),which indicate that strong shocks/vortex interactions exist in these areas.At α =14°,two adverse pressure gradients also exist in the flow field.Compared to that of α =12°,the location of the second adverse pressure gradient moves forward to x/xcr=0.58,which is closer to the head of the con figuration and the(∂p/∂xaxialincreases to-7.26.Due to the high adverse pressure gradient,the main leading-edge vortex breakdown is homologous with the Q criterion isosurface(Fig.9).
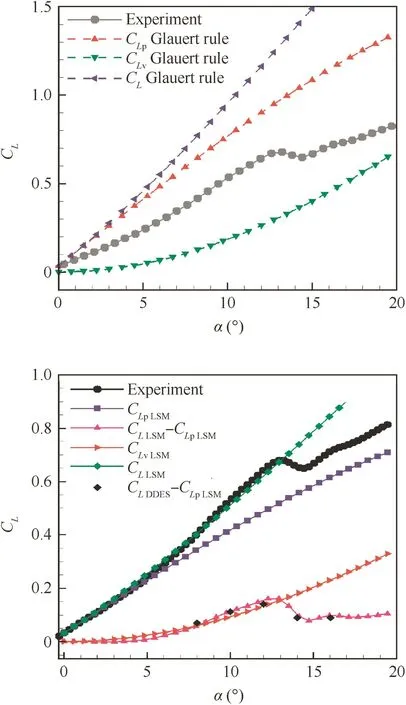
Fig.7 Vortex lift coefficients for blending wing configuration.
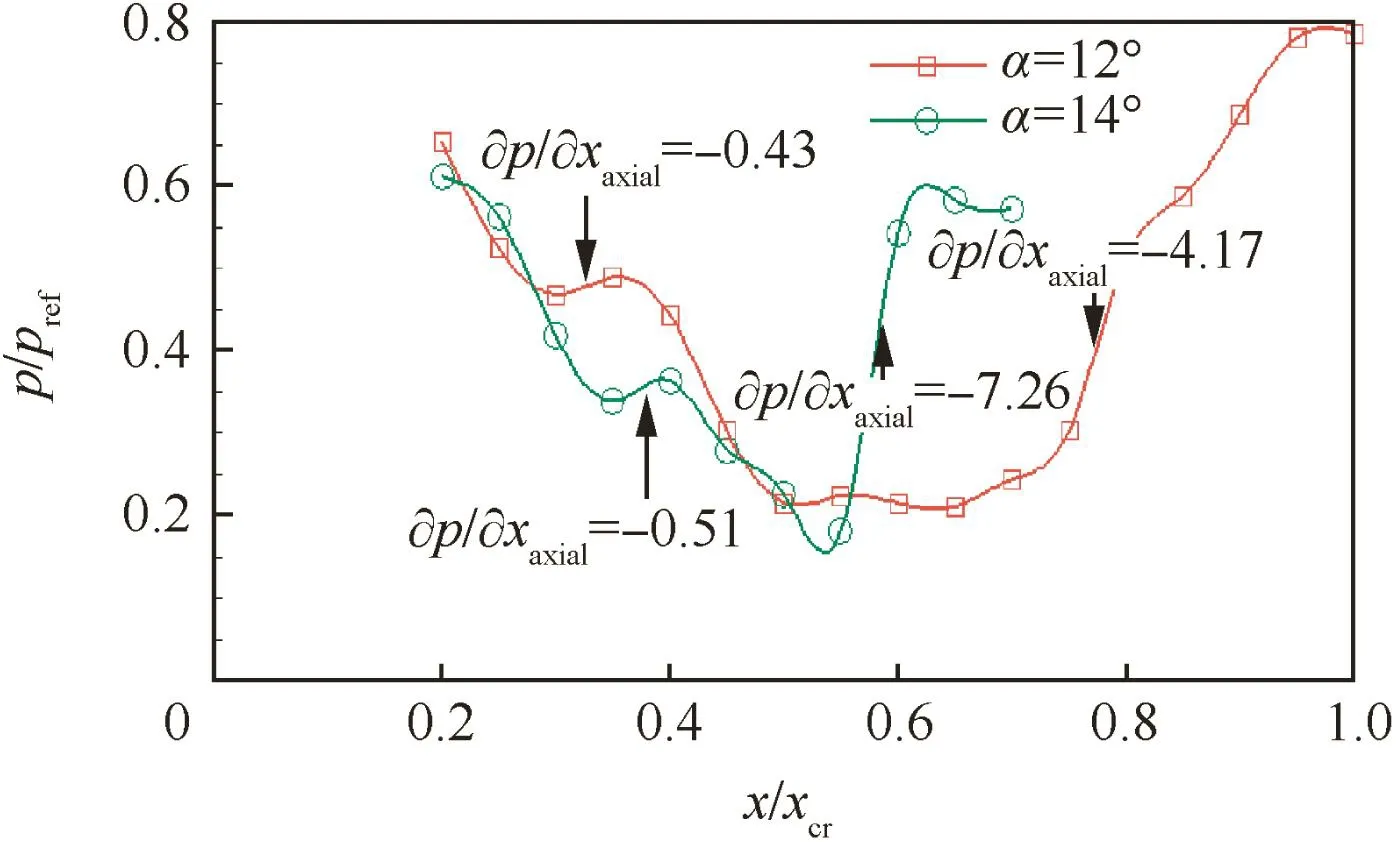
Fig.8 Pressure distribution through vortex cores.
From the CFD results offlow structure,there are shocks/vortex interactions at both lower incident and higher incidence,with a stronger interaction for higher incidence,and the interaction causes a considerable weakening of the vortex core,which may result in vortex breakdown.There seems to be a criterion for the vortex to feel the effect of the shock and remain coherent or breakdown.Ref.25demonstrated an importance criterion parameter for vortex breakdown caused by shocks/vortex interaction,which is a combination of tangential velocity Uθand axial velocity Uaxialof the vortex core.The swirl ratio or the Rossby number is a nondimensional parameter defined as the ratio of axial velocity and tangential velocity of vortex core,as defined by Ro=Uaxial/Uθ.It is used as a criterion to measure the vortex intensity and the susceptibility of the vortex to shock-induced breakdown.The maximum swirl velocity of the vortex and the maximum axial velocity of the vortex cores are used for the calculation of Rossby number in this investigation.

Fig.9 Instantaneous Q criterion isosurface(Q=10).
When the leading-edge vortex passes through a normal shock,the swirl velocity changes little,while the axial velocity will decrease distinctly.As a result,the Rossby number will decrease and the stability of the vortex decrease makes the vortex easier to breakdown.Spall and robinson found that if Ro>1.4,the vortex is stable,and if 0.9<Ro<1.4,the vortex is unstable,while if Ro<0.9,the vortex breaks down when Rossby number was used as the criterion parameter for leading-edge vortex breakdown studies of delta wings.
Using the criterion,the Rossby numbers at α =12°and 14°were calculated which is shown in Fig.10.From the result,it is clear that shock has a great influence on the vortex stabilities.For α =12°,at the locations of x/xcr=0.33 and x/xcr=0.5,the Rossby numbers without exception decrease obviously.As the shocks and shocks/vortex interactions are weak at these locations,the vortex keeps stable even though the vortex strength decreases.When the vortex passes through the second adverse pressure gradient,shocks/vortex interactions become stronger and the vortex becomes unstable.Subsequently,the Rossby number decreases gradually to 0.9 at the location of x/xcr=0.93,which means the vortex is broken down here.At α =14°,shocks/vortex interactions are stronger compared to those of α =12°,Rossby number reduces rapidly at the location of x/xcr=0.57,and the vortex becomes unstable and then breaks down.
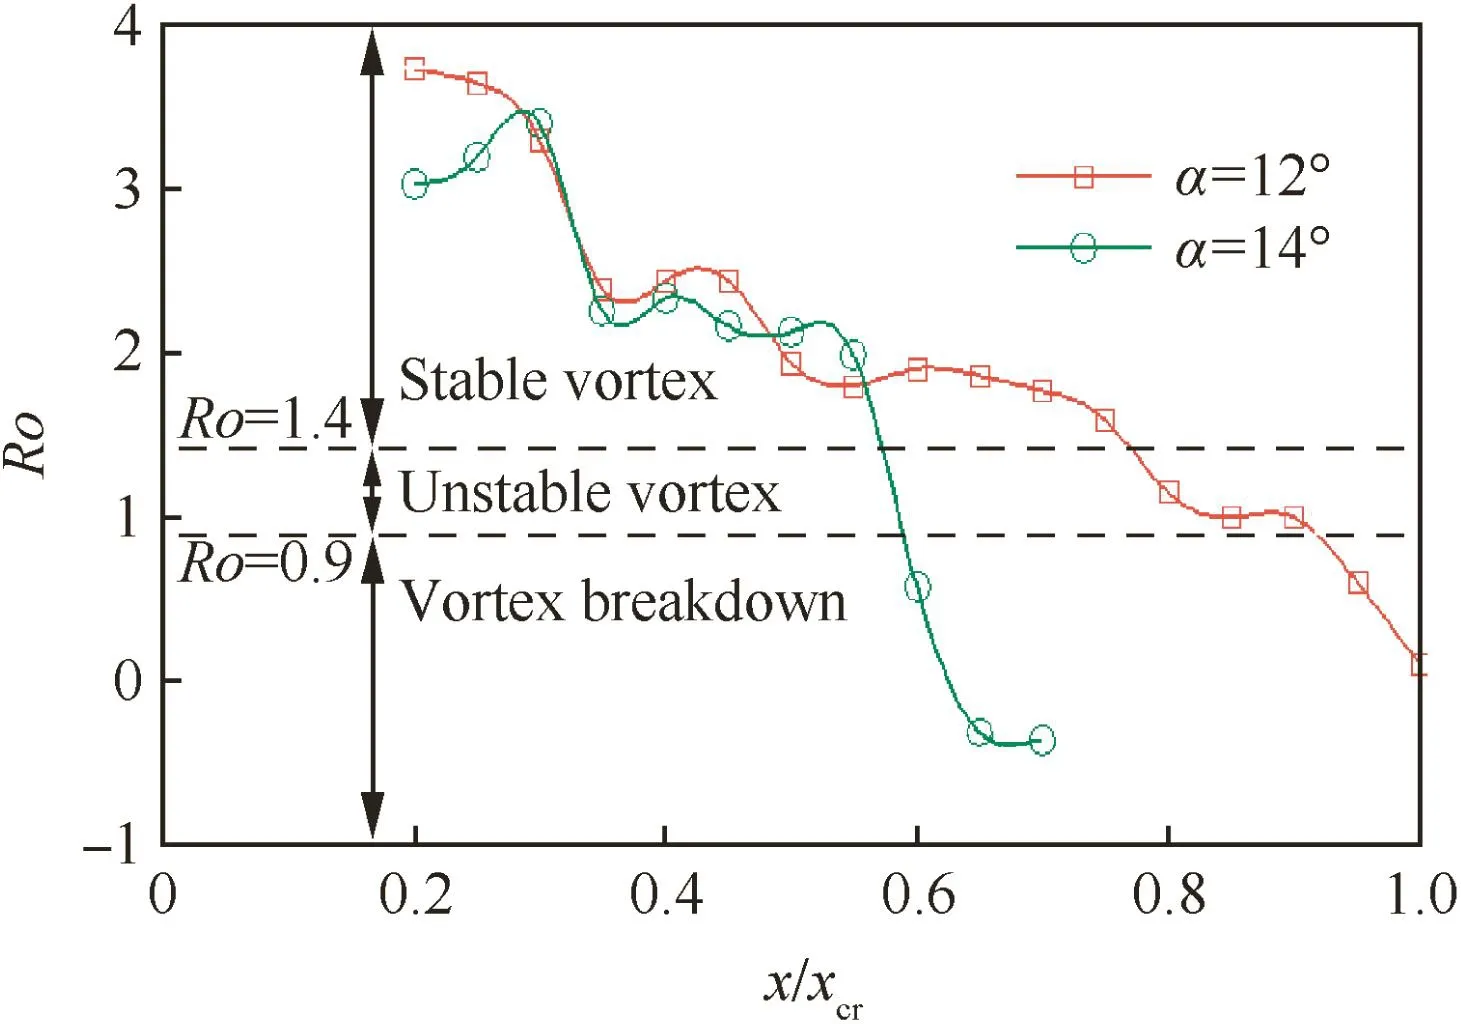
Fig.10 Rossby number distribution against root chord.

Fig.11 Shock structures in flow field.
Fig.11 shows the shock structures in the flow field at α =12°and 14°;due to the high curve slope at the leading edge,the flow accelerates to a local peak value and makes a weak shock produced at the location of x/xcr=0.25 at α =12°,and a strong normal shock can be observed around the location of x/xcr=0.75.Near the central span-wise section of the configuration,two cross flow shocks appear as the interactions of the main leading-edge vortex and second vortex at this area.As the angle of incidence increases to 14°,the weak shock almost disappears at the location of x/xcr=0.25 compared to α =12°,while two new normal shocks introduce at the location around=0.50-0.55 and the vortex breaks down as it passes through the normal shocks and the cross flow shocks destructs too at this angle of attack.
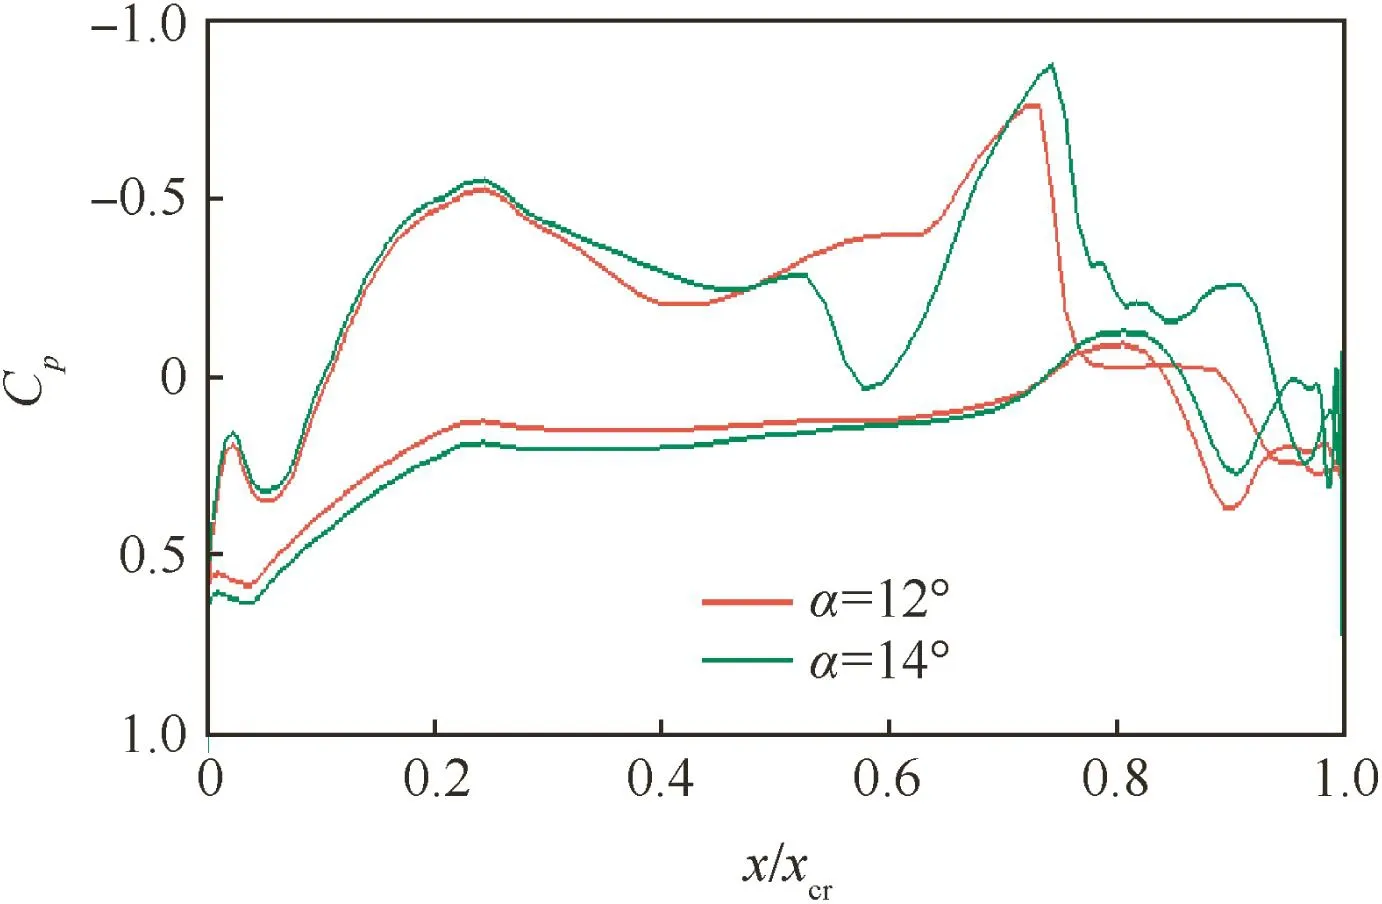
Fig.12 Pressure coefficient distribution at symmetry plane on the wing for both angles of incidence.
Fig.12 shows pressure coefficient distribution at the symmetry plane on the wing for both angles of incidence.At α =12°,around the location of x/xcr=0.75,a normal shock is there.As angles of incidence increase to 14°,this normal shock moves to x/xcr=0.55 which makes the vortex breaks down after the vortex passes through this shock.At the rear of the configuration,weak shocks can be observed for both angles of incidence due to the high curve slope.

Fig.13 Typical cross-sectional shapes of two configurations.
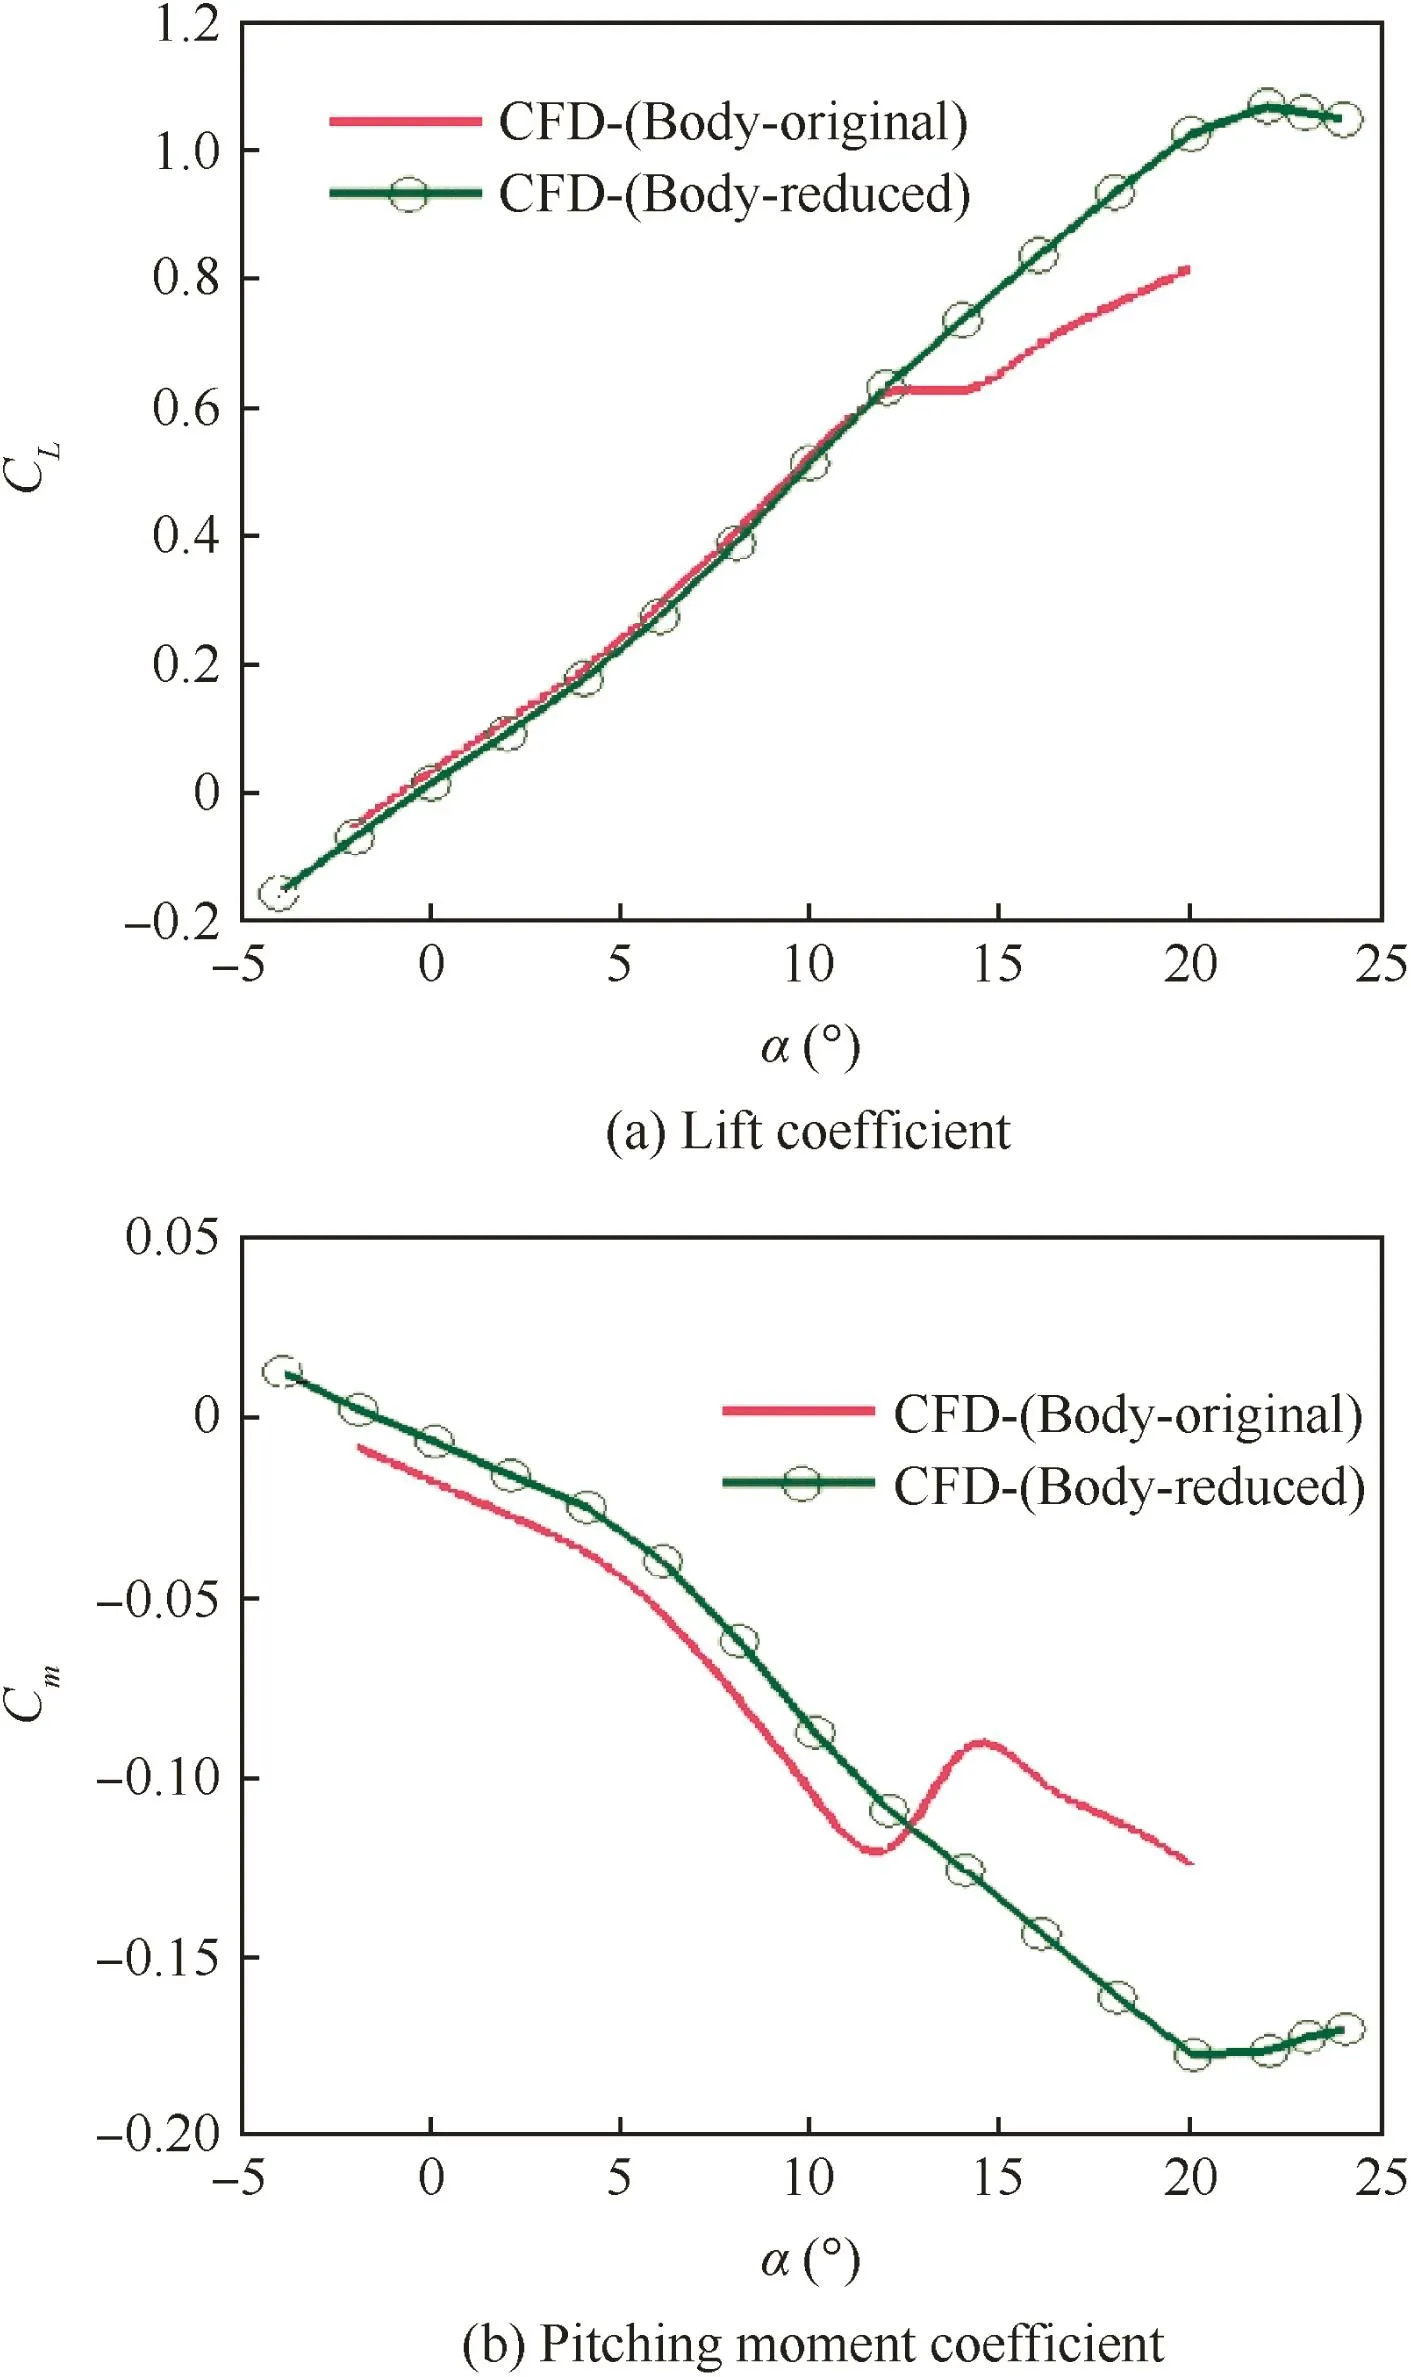
Fig.14 Comparisons of lift and pitching moment coefficients vs incidence.

Fig.15 Comparison of pressure distribution through vortex cores.
Through comparison,we found that this model had a less breakdown resistant to angles of incidence compared with the other 65°swept delta wing configurations proposed in Ref.3,6In transonic flow field,the wing-body thickness ratio has great influence on the shock behavior on delta wings and the occurrence of shocks introduces complex shock/vortex interactions which are responsible for vortex breakdown.In addition,almost all the published investigation models with flying-wing con figurations have a relatively small wing-body thickness ratio,and the flow differences around flying-wing con figuration with a moderate and a small wing-body thickness ratio are not entirely described and understood.Based on the previous study of the 65°swept flying-wing configuration with a moderate 0.16 wing-body thickness ratio(marked as Body-orig),through reducing the wing-body thickness(marked as Body-thin)and keeping the round leading edge and outer wing geometry identical,we investigated wingbody thickness effects on the aerodynamic and vortex flow characteristics of the flying-wing configuration at Ma=0.9.Fig.13 shows comparisons of typical cross-sectional shapes between the original wing-body thickness ratio model and the reduced wing-body thickness ratio model.
Fig.14 shows comparisons of lift and pitching moment coefficients versus incidence relative to the ‘original’and ‘reduced’models.For α < 12°,effect of inner wing thickness on lift coefficient is very weak.However,as angle of incidence increases,the lift coefficient of ‘original’model becomes relatively flat up to 15°incidence,whereas the lift coefficient of‘thin’model has a linear increase up to 20°.A similar phenomenon occurs in the pitching moment.Abrupt nose up in pitching moment of ‘reduced’model is at 20°,while the ‘original’one at 12°.That is to say ‘reduced’model can delay stall and vortex breakdown by an angle of 8°compared with the original model at Mach number 0.9.
From the pressure distribution through vortex cores at α=14°in Fig.15,it is clear that accelerating pressure exists up to x/xcr=0.65 of the ‘reduced’model,and the location of abrupt pressure rise is far from the head of the configuration compared to the ‘original’model,which explains why the ‘reduced’model has a larger stall angle of incidence.From this investigation we can see that wing-body thickness has great influence on the introduction of shock and shock/vortex interactions which can make a significant difference to the vortex breakdown behavior and aerodynamic characteristic of the flying-wing con figuration,which should be considered in the aerodynamic design process.
5.Conclusions
Numerical simulation of abrupt stall phenomena of blended flying wing con figuration at transonic speed was conducted using both DDES and URANS methods at transonic speed.Based on the analysis of the aerodynamic coefficients,flow structures and streamlines,the following conclusions can be drawn:
(1)The sudden motion in breakdown location observed in mean lift,drag and pitching moment coefficients of experiments is due to a shock/vortex interaction.
(2)The DDES methods perform more precisely than the URANS method(the onset angle of the breakdown movement was predicted about 2°greater than the measurements)and the aerodynamic coefficient results from DDES method were compared very well with the experiment results and the shock strength or axial flow in the vortex was well predicted by the DDES methods.
(3)Wing-body thickness has great influence on shock and shock/vortex interactions,which can make a significant difference to the vortex breakdown behavior and stall characteristic of the blended flying wing configuration.
Acknowledgment
This work was supported by the National Natural Science Foundation of China(No.11372337).
1.Schiavetta LA,Boelens OJ,Fritz W.Analysis of transonic flow on a slender delta wing using CFD.Reston:AIAA;2006.Report No.:AIAA-2006-3171.
2.Elsennnr A,Hoeijmakers HWM.An experimental study of the lf ow over a sharp-edged delta wing at subsonic and transonic speeds.Paris:AGARD;1991.Report No.:AGARD-CP-494.
3.Chu J,Luckring JM.Experimental surface pressure data obtained on a 65°delta wing across Reynolds number and Mach number ranges:Volume 1-sharp leading edge.Washington,D.C.:NASA;1996.Report No.:NASA TM 4645.
4.Hill DJ,Pantano C,Pullin DI.Large-eddy simulation and multiscale modeling of a Richtmyer-Meshkov instability with reshock.J Fluid Mech 2006;557:29–61.
5.Fang BR.Aero-con figuration design of aero plan.Beijing:Aviation Industry Press;1997[Chinese].
6.Jobe CE.Vortex breakdown location over 65°delta wings empiricism and experiment.Aeronaut J 2004;108:475–82.
7.Kalkhoran IM,Smart MK.Aspects of shock wave-induced vortex breakdown.Progress Aerospace Sci 2000;36(1):63–95.
8.Fritz W,Cummings RM.What was learned from the numerical simulations for the VFE-2.Reston:AIAA;2008.Report No.:AIAA-2008-0399.
9.Schiavetta,L,Boelens O,Crippa S.Sting effects on vortex breakdown in transonic delta wing flows.Reston:AIAA;2008.Report No.:AIAA-2008-0395.
10.Schiavetta LA,Boelens OJ,Crippa S.Shock effects on delta wing vortex breakdown.J Aircraft 2009;46(3):903–14.
11.Spalart PR,Jou WH,Strelets M,Allmaras SR.Comments on the feasibility of les for wings,and on a hybrid rans/les approach,advances in DNS/LESProceedings of the 1st AFOSR Int.Conf.on DNS/LES.Columbus(OH):Greyden Press;1997.
12.Viswanathan,A,Squires KD,Forsythe JR.Detached-eddy simulation around a forebody at high angle of attack.Reston:AIAA;2003.Report No.:AIAA-2003-0263.
13.Lv ZY,Zhu LG.Study on forms of vortex breakdown over delta wing.Chin J Aeronaut 2004;17(1):13–6.
14.Forsythe JR,Squires KD,Wurtzler KE,Spalart PR.Detachededdy simulation of the F-15E at high alpha.Reston:AIAA;2002.Report No.:AIAA-2002-0591.
15.Morton SA,Steenman MB,Cummings RM,Forsythe JR.DES grid resolution issues for vertical flows on a delta wing and an F-18C.Reston:AIAA;2003.Report No.:AIAA-2003-1103.
16.Denning RM,Allen JE,Armstrong FW.The broad delta airliner.Aeronaut J 2003;107(1075):547–58.
17.Su JC,Huang Y,Li YH.Research on flow characteristics of lowaspect-ratio flying wing at transonic speed.Acta Aerodynamic Sinica 2015;33(3):307–12[Chinese].
18.Simon F,Deck S,Guillen P,Sagaut P,Merlen A.Numerical simulation of the compressible mixing layer past an axisymmetric trailing edge.J Fluid Mech 2007;591:215–53.
19.Lu XY,Wang SW,Sung HG.Large-eddy simulations of turbulent swirling flows injected into a bump chamber.J Fluid Mech 2005;527:171–95.
20.Wang SW,Yang V,Hsiao G,Hsieh SY.Large-eddy simulations of gas-turbine swirl injector flow dynamics.J Fluid Mech 2007;583:99–122.
21.Hill DJ,Pantano C,Pullin DI.Large-eddy simulation and multi scale modeling of a Richtmyer-Meshkov instability with reshock.J Fluid Mech 2006;557:29–61.
22.Menter FR,Kuntz M,Langtry R.Ten years of experience with the SST turbulence model.Proceedings of the 4th international symposium on turbulence heat and mass transfer;2003.p.625–32.
23.Menter FR.Two-equation eddy-viscosity turbulence models for engineering applications.AIAA J 1994;32(8):1598–605.
24.Liu J,Sun HS,Liu Z,Xiao ZX.Numerical investigation of unsteady vortex breakdown past 80°/65°double-delta wing.Chin J Aeronaut 2014;27(3):521–30.
25.Spalart PR.Detached-eddy simulation.Annu Rev Fluid Mech 2009;41:181–202.
26.Polhamus EC.Application of the leading edge suction analogy of vertex lift to the drag due to lift of sharp edge delta wings.Washington,D.C.:NASA;1968.Report No.:TN-D-4739.
Tao Yang is an associate research fellow in China Aerodynamics Research and Development Center.His main research interests are vortex aerodynamics,unsteady flows and their control.
29 September 2015;revised 24 December 2015;accepted 31 January 2016
Available online 11 November 2016
Delayed detached eddy simulation;
Flying wing;
Vortex lift;
Vortex breakdown;
Wing stall
Ⓒ2016 Chinese Society of Aeronautics and Astronautics.Production and hosting by Elsevier Ltd.This is anopenaccessarticleundertheCCBY-NC-NDlicense(http://creativecommons.org/licenses/by-nc-nd/4.0/).
*Corresponding author at:State Key Laboratory of Aerodynamics,China Aerodynamics Research and Development Center,Mianyang 621000,China.
E-mail address:50323222@qq.com(Y.Tao).
Peer review under responsibility of Editorial Committee of CJA.
Production and hosting by Elsevier
http://dx.doi.org/10.1016/j.cja.2016.10.018
1000-9361Ⓒ2016 Chinese Society of Aeronautics and Astronautics.Production and hosting by Elsevier Ltd.
This is an open access article under the CC BY-NC-ND license(http://creativecommons.org/licenses/by-nc-nd/4.0/).
 CHINESE JOURNAL OF AERONAUTICS2016年6期
- CHINESE JOURNAL OF AERONAUTICS的其它文章
- Analysis of swirling flow eff ects on the characteristics of unsteady hot-streak migration
- Implicit discontinuous Galerkin method on agglomerated high-order grids for 3D simulations
- Design and implementation of rigid-flexible coupling for a half-flexible single jack nozzle
- Dynamic simulation of aerial towed decoy system based on tension recurrence algorithm
- A quasi-one-dimensional model for hypersonic reactive flow along the stagnation streamline
- An experimental investigation on static directional stability
