Experimental study of water and dissolved pollutant runoffs on impervious surfaces*
Yang XIAO (肖洋), Tao-tao ZHANG (张涛涛), Dongfang LIANG, Jack M. CHEN
Experimental study of water and dissolved pollutant runoffs on impervious surfaces*
Yang XIAO (肖洋)1,2, Tao-tao ZHANG (张涛涛)2, Dongfang LIANG3, Jack M. CHEN3
1. State Key Laboratory of Hydrology-Water Resources and Hydraulic Engineering, Hohai University, Nanjing 210098, China, E-mail: sediment_lab@hhu.edu.cn 2. College of Water Conservancy and Hydropower Engineering, Hohai University, Nanjing 210098, China.3. Department of Engineering, University of Cambridge, Cambridge, UK (Received December 24, 2015, Revised January 28, 2016)
The water and dissolved pollutant runoffs on impervious surfaces are the essential factor to be considered in design methods to minimize the impacts of the diffuse water pollution. In this paper, experiments are conducted to study the water and dissolved pollutant runoffs on impervious surfaces for different rainfall intensities and surface roughnesses. It is shown that a larger rainfall intensity and a smaller surface roughness reduce the time of concentration and increase the pollutant transport rate. Most of the pollutant runoffs take place at the initial stage of the rainfall. The pollutant transport rate rapidly reaches a peak and then gradually drops to zero.
rainfall-runoff, diffuse pollution, overland flow, flooding, urban runoff
With the rapid urbanization, the impervious ground in urban areas has expanded dramatically[1]. The increase of the impervious surface area reduces the time of concentration and exacerbates the urban surface water flooding. Moreover, the surface water flooding has significant implications on the water pollution. The non-point source (NPS) pollution from the urban storm runoff has been identified as one of the major causes of the quality deterioration of recei- ving water bodies[2-5]. Therefore, the process of water and pollutant runoffs on impervious surfaces during heavy rainfall events is an important research issue.
To analyze the pollutant runoffs, both the rainfall runoff and pollutant transport processes should be examined. Numerical models were developed to simulate the one-dimensional and two-dimensional overland flows[6-9], and results are compared with the analytical solution in simple situations[10]. It is shown that the typical hydrograph of a catchment consists of a steep-rising limb in the initial stage and a plateau section if the rainfall-runoff process takes sufficiently long time. In spite of abundant numerical simulations, few physical experiments were reported on this topic. Even fewer experimental studies can be found on the pollutant runoffs. The pollutants on the urban surface can be classified into two categories: the dissolved and the particulate. Some studies[11-13]were conducted concerning the urban road and roof surfaces with a simulated rainfall, focusing on the processes of the particulate pollutant build-up and wash-off. The cumulative wash-off percentages in the particulate matter were obtained and the wash-off model was developed. But, the runoffs of dissolved contaminants remain an issue to be explored, such as the nitrogen, that is predominantly dissolved in over 80% urban storm water[14]. Sheng[15]noted that the difference in the transport of dissolved and particulate phases is obviously great due to their different physical and chemical properties, but the differentiation between dissolved and particulate phases has rarely been paid enough attention for urban watersheds.
To bridge the gap in our understanding of the dissolved pollutant transport in urban catchments, a series of laboratory experiments are conducted using rainfall simulators and solid plates to measure the water and dissolved pollutant runoffs. Special atten- tion is paid to the influences of the rainfall intensity and the surface roughness. These measurements may be used for calibrating the computational models.
The laboratory experiments are conducted in a rainfall simulation hall. The water nozzles are located 17 m above the model catchment. The rainfall simulators cover an area of 15.6 m in length and 12.6 m in width. The rainfall uniformity is over 0.9. Two wooden (cunninghamia lanceolate) boards, of 2.96 m long, 1.48 m wide and 0.02 m thick, are used to represent urban impervious surfaces (Fig.1(a)). Three short walls of 0.04 m high are fixed on the sides of each board so that water can only leave the idealized catchment at the downstream end. Two wooden boards are identical except for the surface roughness. Hence, one is referred to as S-board (smooth) and the other as R-board (rough). For the convenience of collecting samples, the boards are placed in a steel flume of 3 m long, 1.5 m wide and 0.5 m high, as shown in Fig.1(b), Fig.1(c). The slope of the flume is adjustable using the hydraulics devices. There are two collection points at the bottom of the flume: one for the surface runoff, and the other for the gap flow.
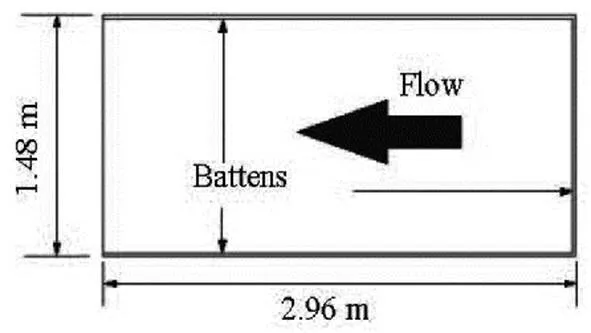
Fig.1(a) Wooden board
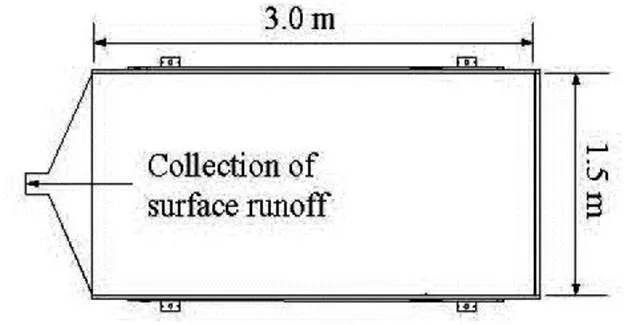
Fig.1(b) Top-view of flume
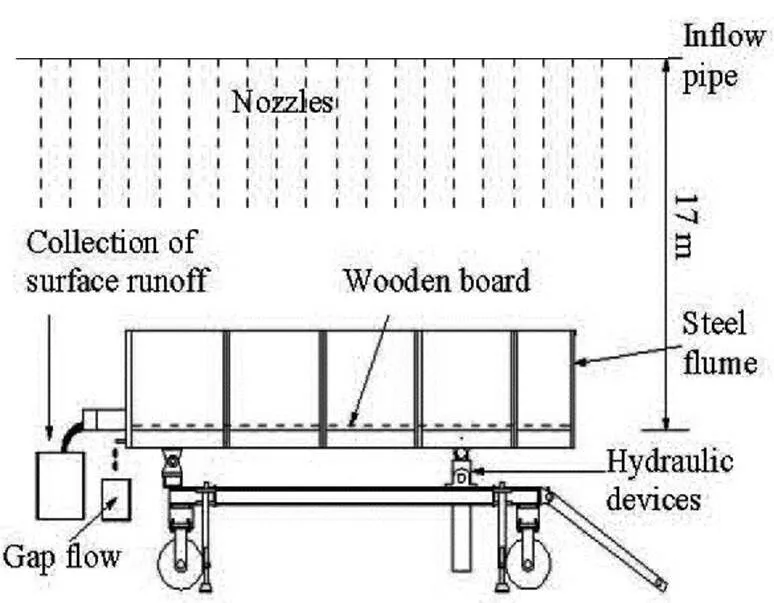
Fig.1(c) Experimental set-up
In this study, the board slope is set to 1°. Three constant rainfall intensities are tested, which are 0.04 m/h, 0.08 m/h and 0.12 m/h. Each rainfall lasts for 29 min. In this test, sodium chloride (NaCl) is chosen to model the diffuse pollutant for its wide availability and ease of use. At the beginning of each experiment, NaCl is spread uniformly on the wooden board surface. The total amount in each case is 125 g.
During each rainfall experiment, the runoff data are collected with numerous plastic or glass containers at fixed time intervals. The sampling duration and the sampling interval of the runoff water after the start of the runoff are listed in Table 1. The collecting time is controlled by a stopwatch and the concentration of NaCl is measured with a conductivity meter. For each runoff sample, its volume, time and concentration are recorded.
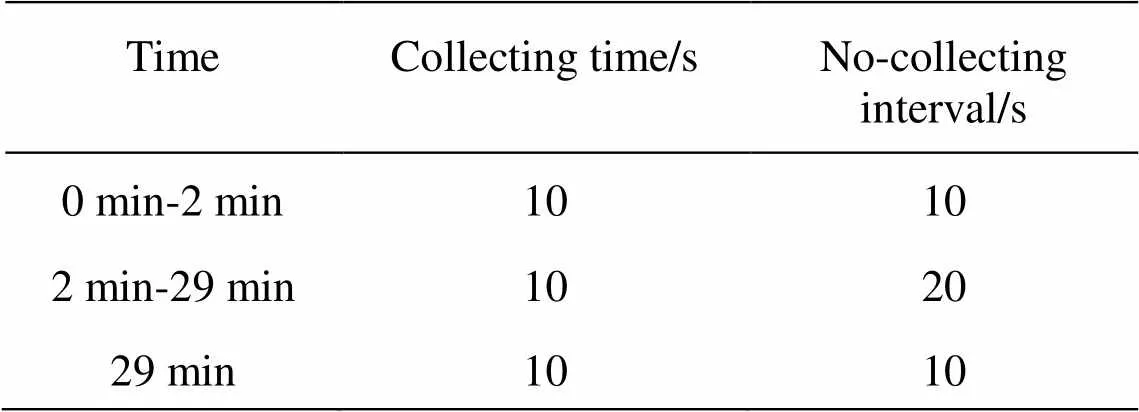
Table 1 Timing of the runoff sample collection
The runoff water results are used to reveal the effect of different factors on the water-runoff process. Figure 2 shows the runoff processes under different conditions.is the runoff rate at the time. S-40 means the smooth board with 0.04 m/h of the rainfall intensity, and other notations can be understood similarly. Figure 3 gives enlarged pictures for the initial stage of the runoff processes. Comparing these runoff processes, several important conclusions relating to the runoff process can be drawn. Firstly, it is obvious that the runoff rate increases rapidly at the beginning, and then reaches a constant maximum runoff rate, followed by a sharp drop when the rainfall stops. Secondly, the maximum runoff rate approxima- tely appears at 1 min after the start of the runoff for every rainfall event, and the maximum runoff rates on the S-board and the R-board are almost the same for the same rainfall intensity, which confirms the corre- ctness of the measurements. Thirdly, the rainfall inten- sity and the surface roughness influence the time of concentration. On the same surface, the smaller the rainfall intensity, the longer the time required to reach the equilibrium stage. For the same rainfall intensity, the larger surface roughness will lead to a larger time of concentration. Similar results may be found in pre- vious studies[7,9].
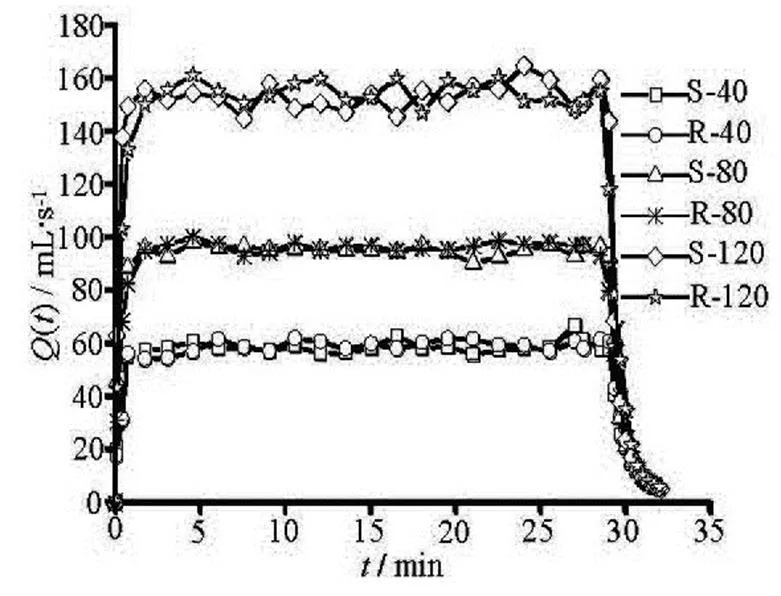
Fig.2 Runoff rate variations for S-board and R-board
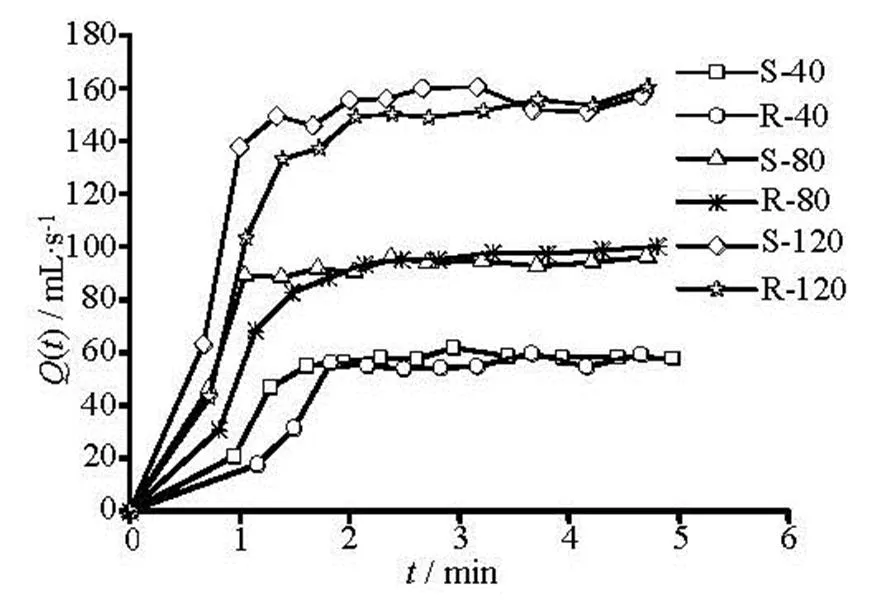
Fig.3 Close-up of the initial runoff rate variations for S-board and R-board
During the rainfall experiment, the NaCl concen- tration of each runoff sample is measured using a con- ductivity meter and a calibration curve to relate the conductivity to the concentration, which is obtained beforehand. Only the first 10 min of the concentration variation after the start of the runoff is displayed as shown in Fig.4 and Fig.5, because the concentrations after 10 min are almost zero in all cases.
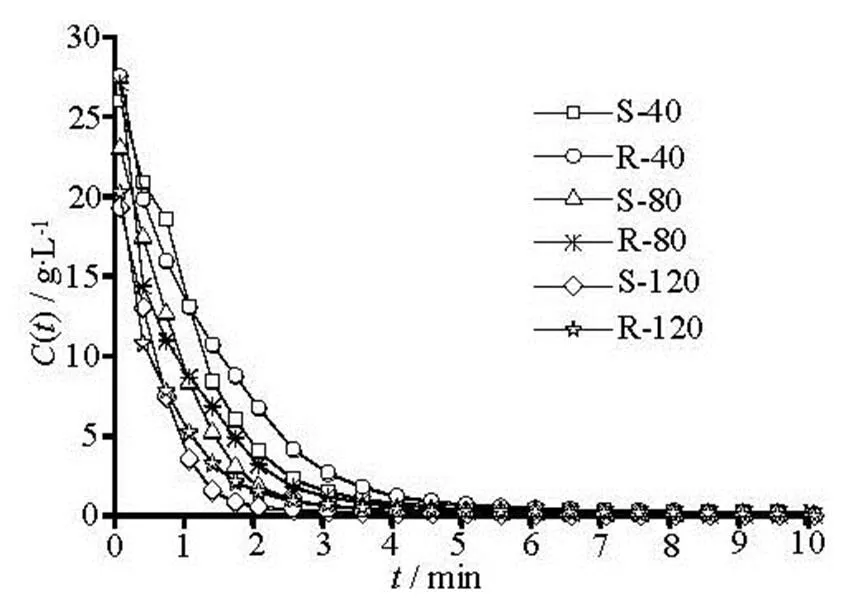
Fig.4 NaCl concentration variation processes in the rainfall si- mulation
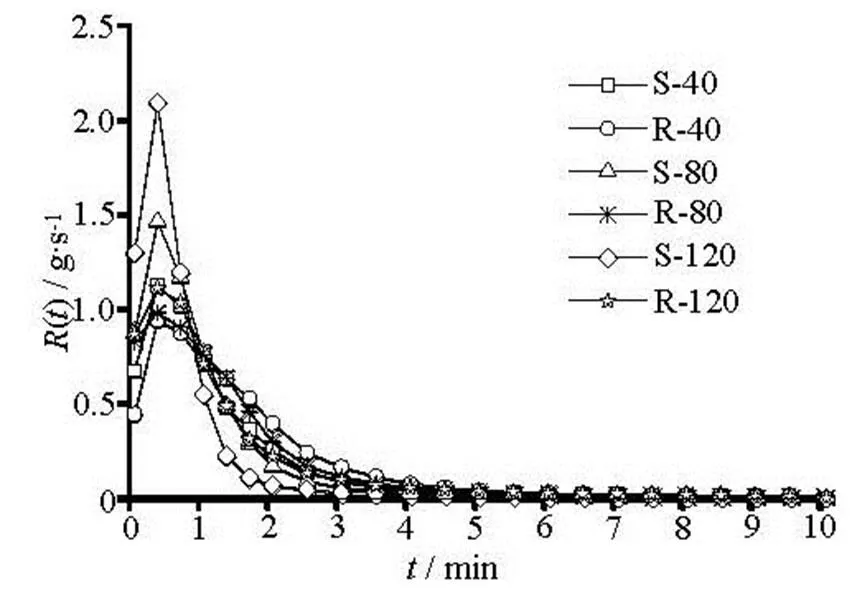
Fig.5 NaCl transport rate variation processes in the rainfall si- mulation
Figure 4 shows the NaCl concentration variations in 6 combinations of the plate roughness and the rain- fall intensity. For each process, the concentration of the initial runoff is high and then decreases gradually. The dissolvable pollutant scattered on the surface of the board becomes less and less in the course of the rainfall. Comparing the concentration variations on the same board, it can be clearly seen that the smaller the rainfall intensity the higher the concentration at the same time. Comparing the concentration variations on different plates with the same rainfall intensity, it is clearly shown that the concentration on the rough plate is higher than that on the smooth plate in the early and late stages of the rainfall but one sees an op- posite trend in the middle stage.
The pollutant flow rate at the outlet of the catch- ment is an essential factor in controlling the water po- llution. The pollutant flow rate can be defined as[16]
Figure 5 shows the calculated pollutant transport rate variations. In Fig.5, all curves have the same shape of first rising to a maximum value and then gra- dually decreasing to zero. The peaks of these curves all occur approximately at 0.5 min after the start of the runoff. An interesting phenomenon is observed that all these curves approximately intersect at the same point when the time is 1 min. Before this instant, the larger rainfall intensity or smaller roughness produces a greater pollutant flow rate. After this instant, the op- posite is the case. A lot of pollutants will be washed off the catchment quickly under the conditions of heavy rainfall and smooth ground.
The cumulative wash-off percentages are another indicator of the speed of the diffuse pollution. The cu- mulative wash-off percentage can be calculated acco- rding to the following equation
The results of all cumulative wash-off percentage variations are depicted in Fig.6. The cumulative wash- off percentage increases rapidly at the initial period and then gradually reaches a stable state. At the end of the experiments, the average cumulative wash-off per- centage is about 95%, which means that 95 percent of the total pollutant amount is washed off from the board surface during first 30 min of the rainfall. Com- paring with the previous studies[11,12], the pollutants are washed off faster in this study, which may be be- cause that (1) the NaCl is easier to dissolve and tran- sport, (2) the rainfall simulator’s height of 17 m leads to a high kinetic energy to instantly dissolve the NaCl in the rainwater, (3) the surface roughness of the woo- den boards used in this study is small. Comparing Fig.2 and Fig.6 shows that the water runoff process is much faster than the pollutant runoff process. It takes only 1 min-2 min for the water flow rate to reach the equilibrium value, while it takes 5 min-10 min for the pollutant runoff.
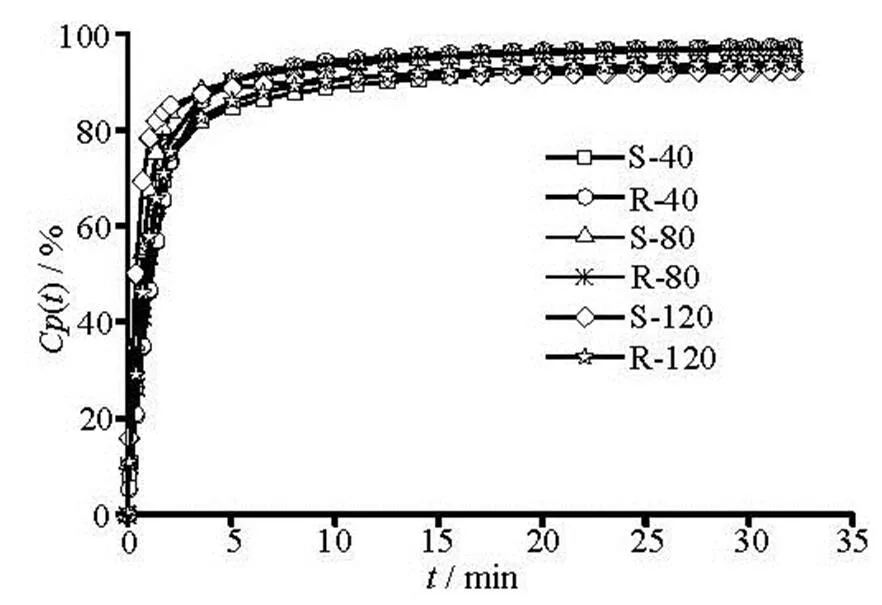
Fig.6 NaCl cumulative wash percentage variation processes
In this study, a series of idealized laboratory ex- periments, with consideration of different rainfall in- tensities and surface roughnesses, are conducted to in- vestigate the water and pollutant runoffs on imper- meable surface. The impact of the rainfall intensity and the surface roughness on runoffs is analyzed. The experimental results show that the larger rainfall in- tensity and the smaller surface roughness reduce the time of concentration and increase the pollutant tran- sport rate. The pollutant concentration of the initial runoff water is very high and subsequently decreases to zero. The pollutant transport rate increases to the maximum and then decreases to nearly zero. Compa- red to the time of concentration of the water runoff, the time scale of the diffuse pollutant production is much larger.
Dr. Liang thanks the financial support by the Royal Academy of Engineering (Grant Nos. NRCP/1415/97, ISS1516834).
References
[1] WANG Shu-min, HE Qiang and AI Hai-nan et al. Polluta- nt concentrations and pollution loads in stormwater runoff from different land uses in Chongqing[J]. Journal of En- vironmental Sciences, 2013, 25(3): 502-510.
[2] XUE Chong-hua, YIN Hai-long and XIE Ming. Develop- ment of integrated catchment and water quality model for urban rivers[J]. Journal of Hydrodynamics, 2015, 27(4): 593-603.
[3] HE Tao, GUAN Wei and YANG Le-liang et al. Test and characteristics analysis of road surface runoff pollution of typical city in rapidly urbanized area[J]. Water Resources and Power, 2014, 32(10): 30-33(in Chinese).
[4] CHANG F. J., TSAI Y. H. and CHEN P. A. et al. Mode- ling water quality in an urban river using hydrological factors-Data driven approaches[J]. Journal of Environ- mental Management, 2015, 151: 87-96.
[5] WIJESIRI B., EGODAWATTA P. and MCGREE J. et al. Influence of pollutant build-up on variability in wash-off from urban road surfaces[J]. Science of the Total Envi- ronment, 2015, 527-528: 344-350.
[6] LIU Shi-he, TAI Wei and FAN Min. Numerical simula- tion of atomization rainfall and the generated flow on a slop[J]. Journal of Hydrodynamics, 2012, 24(2): 273- 279.
[7] GOTTARDI G., VENUTELLI M. An accurate time inte- gration method for simplified overland flow models[J]. Advances in Water Resources, 2008, 31(1): 173-180.
[8] YANG J., CHU X. A new modeling approach for simula- ting microtopography-dominated, discontinuous overland flow on infiltrating surfaces[J]. Advances in Water Re- sources, 2015, 78: 80-93.
[9] LIANG D. F., ӦZGEN I. and HINKELMANN R. et al. Sha- llow water simulation of overland flows in idealized cat- chments[J]. Environment Earth Science, 2015, 74: 7307- 7318.
[10] STEPHENSON D., MEADOWS M. E. Kinematic hy- drology and modelling[M]. New York, USA: Elsevier Science Publishers, 1986, 23-42.
[11] EGODAWATTA P., THOMAS E. and GOONETILLEKE A. Mathematical interpretation of pollutant wash-off from urban road surfaces using simulated rainfall[J]. Water Re- search, 2007, 41(13): 3025-3031.
[12] EGODAWATTA P., THOMAS E. and GOONETILLEKE A. Understanding the physical processes of pollutant build-up and wash-off on roof surfaces[J]. Science of the Environment, 2009, 407(6): 1834-1841.
[13] GOONETILLEKE A., EGODAWATTA P. and KIT- CHEN B. Evaluation of pollutant build-up and wash-off from selected land uses at the Port of Brisbane, Australia[J]. Marine Pollution Bulletin, 2009, 58(2): 213-221.
[14] TAYLOR G. D., FLETCHER T. D. and WONG T. H. F. et al. Nitrogen composition in urban runoff-implications for stormwater management[J]. Water Research, 2005, 39(10): 1982-1989.
[15] SHENG Y., YING G. and SANSALONE J. Differentia- tion of transport for particulate and dissolved water chemi- stry load indices in rainfall–runoff from urban source area watersheds[J]. Journal of Hydrology, 2008, 361(361): 144-158.
[16] KIM L. H., KAYHANIAN M. and ZOH K. D. et al. Mo- deling of highway stormwater runoff[J]. Science of the Total Environment, 2005, 348(1-3): 1-18.
* Project supported by the National Natural Science Foun- dation of China (Grant No. 51450110079), the Chinese Academy of Engineering (Grant No. 2015-ZD-07-04-01) and the Fundamental Research Funds for the Central Universities (Grant No. 2015B41614).
Biography: Yang XIAO (1974- ), Male, Ph. D., Professor
10.1016/S1001-6058(16)60617-0 2016, 28(1):162-165
水动力学研究与进展 B辑2016年1期
- 水动力学研究与进展 B辑的其它文章
- Flow, thermal criticality and transition of a reactive third-grade fluid in a pipe with Reynoldsʼ model viscosity*
- Investigation of the effects of platform motion on the aerodynamics of a floating offshore wind turbine*
- Mixing of two different electrolyte solutions in electromagnetic rectangular mixers*
- A new biomimicry marine current turbine: Study of hydrodynamic performan- ce and wake using software OpenFOAM*
- Study of bedload transport in backwater flow*
- A numerical model for pipelaying on nonlinear soil stiffness seabed*
