A numerical model for pipelaying on nonlinear soil stiffness seabed*
Ying-fei ZAN (昝英飞), Chi YANG, Duan-feng HAN (韩端锋), Li-hao YUAN (袁利毫), Zhi-gang LI (李志刚)
A numerical model for pipelaying on nonlinear soil stiffness seabed*
Ying-fei ZAN (昝英飞)1, Chi YANG2, Duan-feng HAN (韩端锋)1, Li-hao YUAN (袁利毫)1, Zhi-gang LI (李志刚)3
1. College of Shipbuilding Engineering, Harbin Engineering University, Harbin 150001, China, E-mail: zanyingfei@hrbeu.edu.cn 2. Department of Physics and Astronomy, George Mason University, Fairfax, VA 22030, USA 3. Offshore Oil Engineering Co., Ltd., Tianjin 300451, China (Received November 15, 2015, Revised January 12, 2016)
The J-lay method is regarded as one of the most feasible methods to lay a pipeline in deep water and ultra-deep water. A numerical model that accounts for the nonlinear soil stiffness is developed in this study to evaluate a J-lay pipeline. The pipeline considered in this model is divided into two parts: the part one is suspended in water, and the part two is laid on the seabed. In addition to the boundary conditions at the two end points of the pipeline, a special set of the boundary conditions is required at the touchdown point that connects the two parts of the pipeline. The two parts of the pipeline are solved by a numerical iterative method and the finite difference method, respectively. The proposed numerical model is validated for a special case using a catenary model and a numerical model with linear soil stiffness. A good agreement in the pipeline configuration, the tension force and the bending moment is obtained among these three models. Furthermore, the present model is used to study the importance of the nonlinear soil stiffness. Finally, the parametric study is performed to study the effect of the mudline shear strength, the gradient of the soil shear strength, and the outer diameter of the pipeline on the pipelaying solution.
pipeline, nonlinear soil stiffness, numerical method, pipe-soil interaction
Introduction
Pipelines are considered to be the best way for the transport of gas and crude oil in the exploitation of offshore resources. In deep water and ultra-deep water, J-lay method has many advantages than other pipela- ying methods. For example, the bending stresses are low at the top of the pipeline, and the long stinger is not required for providing the initial bending moment. Moreover, the horizontal force required for the station keeping is within the capability of the dynamic posi- tioning systems[1]. As more new oilfields are explored and developed in deep water, the J-lay method has been more frequently used.
There are a number of ways to model pipelaying problems, which include the catenary method, singu- lar perturbation method, finite difference method, nonlinear finite element method, and other numerical methods. Plunkett[2]first modelled the pipeline with catenary method and found a formal asymptotic ex- pansion valid for large, nonlinear deflection with the condition that the tension has more influence than the bending stiffness over most of the length. A stiffened catenary method was used to solve the pipeline laying problem by Dixon and Rutledge in 1968[3]. The influe- nce of the pipelaying barge motions were considered on the suspended pipeline using a quasi-static proce- dure based upon an extension of the stiffened catenary theory[4]. A robotic pipe model for pipeline dynamic force analysis was established by Jensen and Fossen[5]for the J-lay model, and the motions of the surface pi- pelaying vessel and the seabed forces were considered as the boundary conditions in the model. Furthermore, A modified rigid finite element method was used to improve the computational efficiency in simulating the dynamic response of the pipelines[6]. In addition, Kang et al.[7]proposed a new model for J-lay using se- ctional mechanics model, by iterating and composing catenary method and large deflection method.
The models discussed above used the assumption that the seabed is rigid, thus ignored the pipeline em- bedment into the seabed. However, the seabed in deep water is usually very soft. The pipeline embedment is thus very important for the deep water J-lay model be- cause it not only influences the pipeline load distribu- tion on the seabed but also determines the initial con- dition of the pipeline suspended in the water. There are many research efforts on studying the interaction of the pipeline and the seabed[8-12]. For example, Beaufait and Hoadley[12]developed a numerical tech- nique for analyzing the problem of a linear elastic beam supported by a nonlinear foundation. However, most of these efforts only focused on the pipeline laid on the touchdown zone.
A nonlinear dynamic PDE (partial differential equation) formulation was developed for the offshore vessel pipeline installation, which considered the effe- cts of restoring forces, hydrodynamic drag and seabed interaction in the pipelaying operation[13]. Lenci and Callegari[14]investigated four simple analytical mode- ls that considered the linear soil stiffness influence to reveal the theoretical basis of the J-lay problem. Many other researchers improved this method[15-18]. A sim- ple mechanical model was established in order to re- duce the calculation time required by Li et al.[19]. This model was based on the linear beam theory and the Winkler foundation on the seabed, and a nonlinear, large deflection beam theory was used to calculate the forces on the suspended segment.
However, it should be noted that the soil on the seabed has a nonlinear stress-strain relationship. Only constant linear soil stiffness was considered in the afo- rementioned research on modeling pipeline laying problems. In this paper, a numerical model that accou- nts for the nonlinear soil stiffness is developed to study the J-lay pipeline problems. The pipeline consi- dered in this model is divided into two parts: the part one is suspended in water; and the part two is laid on the seabed. A special set of the boundary conditions is required at the touchdown point that connects the two parts of the pipeline. The numerical model developed in this paper is validated first. It is then used to analy- ze the importance of the nonlinearity and perform the parametric study to study the effect of the mudline shear strength, the gradient of the soil shear strength, and the outer diameter of the pipeline on the pipela- ying solution.
1. Mathematical model
The pipelaying vessel considered here is under the control of a dynamic control system and it genera- lly moves in a given direction in the pipelaying ope- ration. Therefore, the pipeline is assumed to be restri- cted to move in the vertical plane in the operation. The pipeline is divided into two parts in the mathematical model: the part one is suspended in water, and the part two is laid on the seabed. As shown in Fig.1, two coo- rdinate systems are used in the present model. A glo- bal coordinate systemis set up with the originat the touchdown point (TDP), and theaxis in the horizontal direction pointing in the same direction as the vessel moving direction, and theaxis in the vertical direction pointing upward. The pipeline em- bedment depth on the seabed is described by, and it is positive when the pipeline is below the sea- bed. In order to model the pipeline in water, a local coordinate systemis set up with the originat the top of the pipeline, and theaxis in the hori- zontal direction pointing in the opposite direction as the vessel moving direction, and theaxis in the vertical direction pointing downward. The final results will be plotted in the global coordinate system.
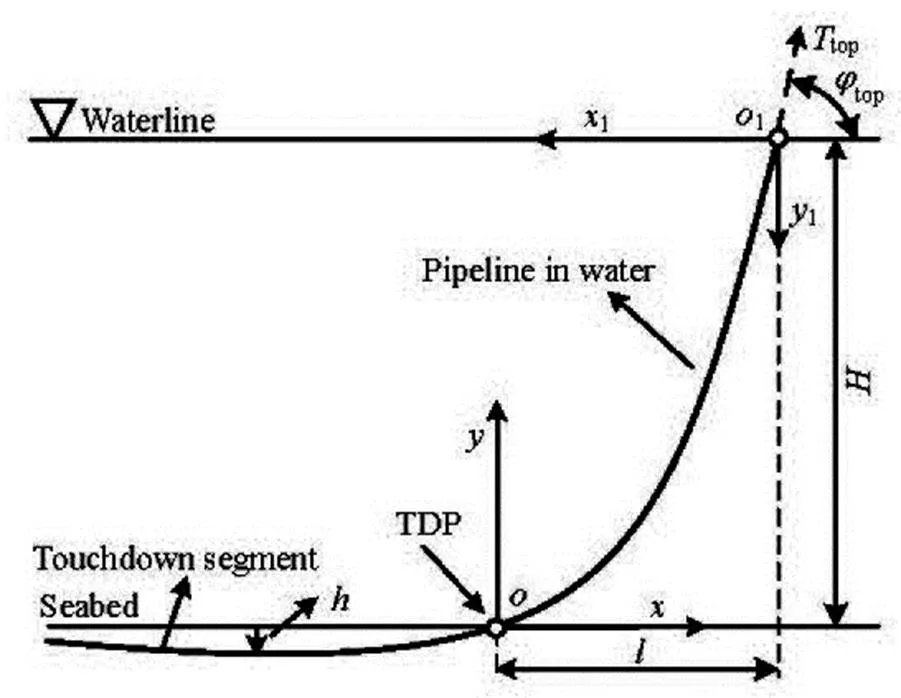
Fig.1 Definition of the coordinate systems
1.1
A differential element of the pipeline shown in Fig.2 is considered in the local coordinate system. By neglecting the high-order force terms and performing the force analysis for the differential ele- ment, we can obtain the following governing equatio- ns for the pipeline:
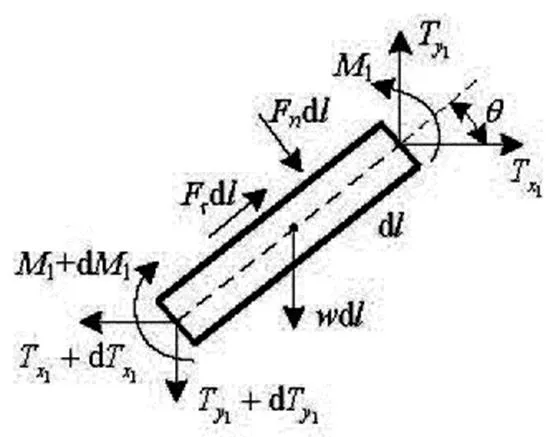
Fig.2 Force analysis of a pipeline element suspended in water
The pipeline considered here is very long and it becomes flexible in water. The bending moment is negligible in comparison with the tension force. The bending stiffness can thus be neglected. The direct re- lationship between tension force and the anglecan be expressed as
If neglecting axial strain and shear strain of the pipeline, the following geometric relations can be ob- tained:
Although we exclude the effect of bending stiff- ness in this method, an approximation of the real ben- ding moment can be evaluated by the bending stiffne- ssand the curvatureas follows
1.2
The elementary beam theory is used as the basis for developing formulations for a differential element on the seabed shown in Fig.3. The finite-difference method can be used to solve the following equation[21]
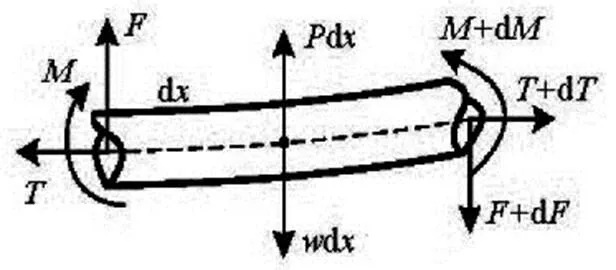
Fig.3 Force analysis of a pipeline element on the seabed
Many efforts have been devoted to study the inte- raction mechanism between the pipeline and the sea- bed. Some researchers assumed that the seabed soil is a linear material in their studies, and the soil resista- ncewas expressed as the function of the linear soil stiffness and the embedment depth. However, soil has a stress-strain relationship that behaves nonlinear- ly. Therefore, using the constant linear soil stiffness in the model cannot represent the true soil mechanical behavior.
In order to account for the nonlinearity, Aubeny[8]propose a power law expression for the soil resistance for the pipeline embedment on the seabed as follows
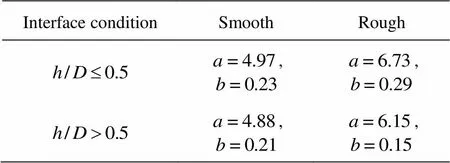
Table 1 Power law coefficients
By substituting Eq.(8) into Eq.(7), the soil resis- tance can be written as
It can be observed from Eq.(9) that the relationship between soil resistanceand the embedment depthis nonlinear.
In order to solve nonlinear Eq.(6), soil reaction is expressed by a series of elastic springs, as shown in Fig.4. The soil stiffnessis evaluated by an iterative method based on the following equation
Equation (11) and Eq.(1) can be solved together nu- merically, which will be discussed in the following se- ction.

Fig.4 Seabed-pipeline interaction model
1.3
The pipeline in the present model is divided into two parts with three boundary points. The first boun- dary point is at the top of the pipeline. The water depthand the laying angleare known at this boundary point:
The second boundary point is the touchdown point of the pipeline on the seabed. In order to ensure the continuity of the displacement, slope, tension and bending moment at the touchdown point, the follo- wing four boundary conditions must be satisfied:
The third boundary point is the end point of the pipeline on the seabed. The following two boundary conditions need to be satisfied on the seabed when:
2. Numerical solution
The pipeline in water is divided intoelements with the samealong the vertical direction in the local coordinate system, and all elements are conside- red to be the small elements without curvature. The pipeline on the seabed is divided intoelements with the samealong the horizontal direction. The defi- nition sketch of the numerical discretization of the pi- peline in the present model is shown in Fig.5.
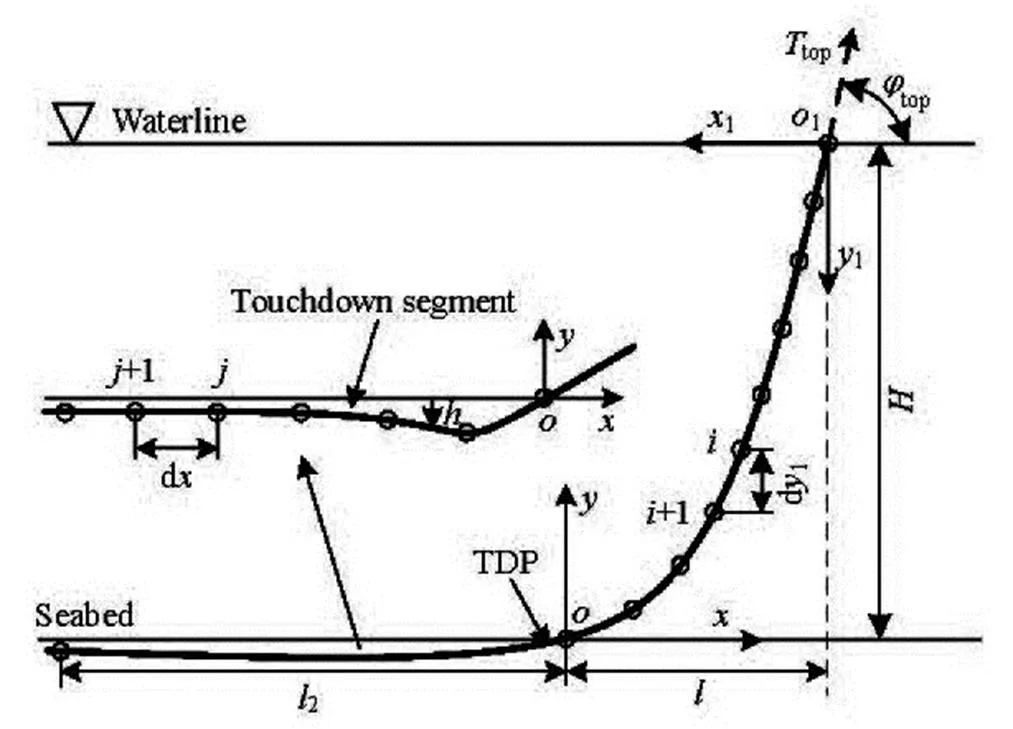
Fig.5 Definition sketch of the numerical discretization of the pipeline
and the following geometric relations can be derived in terms of the Eq.(2) and Eq.(4):
For the part of the pipeline laid on the seabed, the pipeline embedment depthatpoints can be de- scribed in the following matrix form by applying the finite difference method to the Eq.(11)
By considering the boundary conditions, Eq.(20) can be rewritten as
where
The inclination of the first element is small due to the fact that one of its end point is the touchdown point and it is close to the seabed. So it is assumed that the tension forcecan be taken as a constant value that is equal to the tension force at the touch- down point[14].
The bending moment can be obtained as
Figure 6 shows the flowchart for the solution procedure of the present model. As shown in Fig.6, basic parameters are inputted at the beginning for the pipeline suspended in water and on the seabed. To start the calculation of the pipeline in water, it is nece- ssary to assume an initial tension. The initialcan be calculated using the catenary method when the seabed is assumed to be rigid as follows
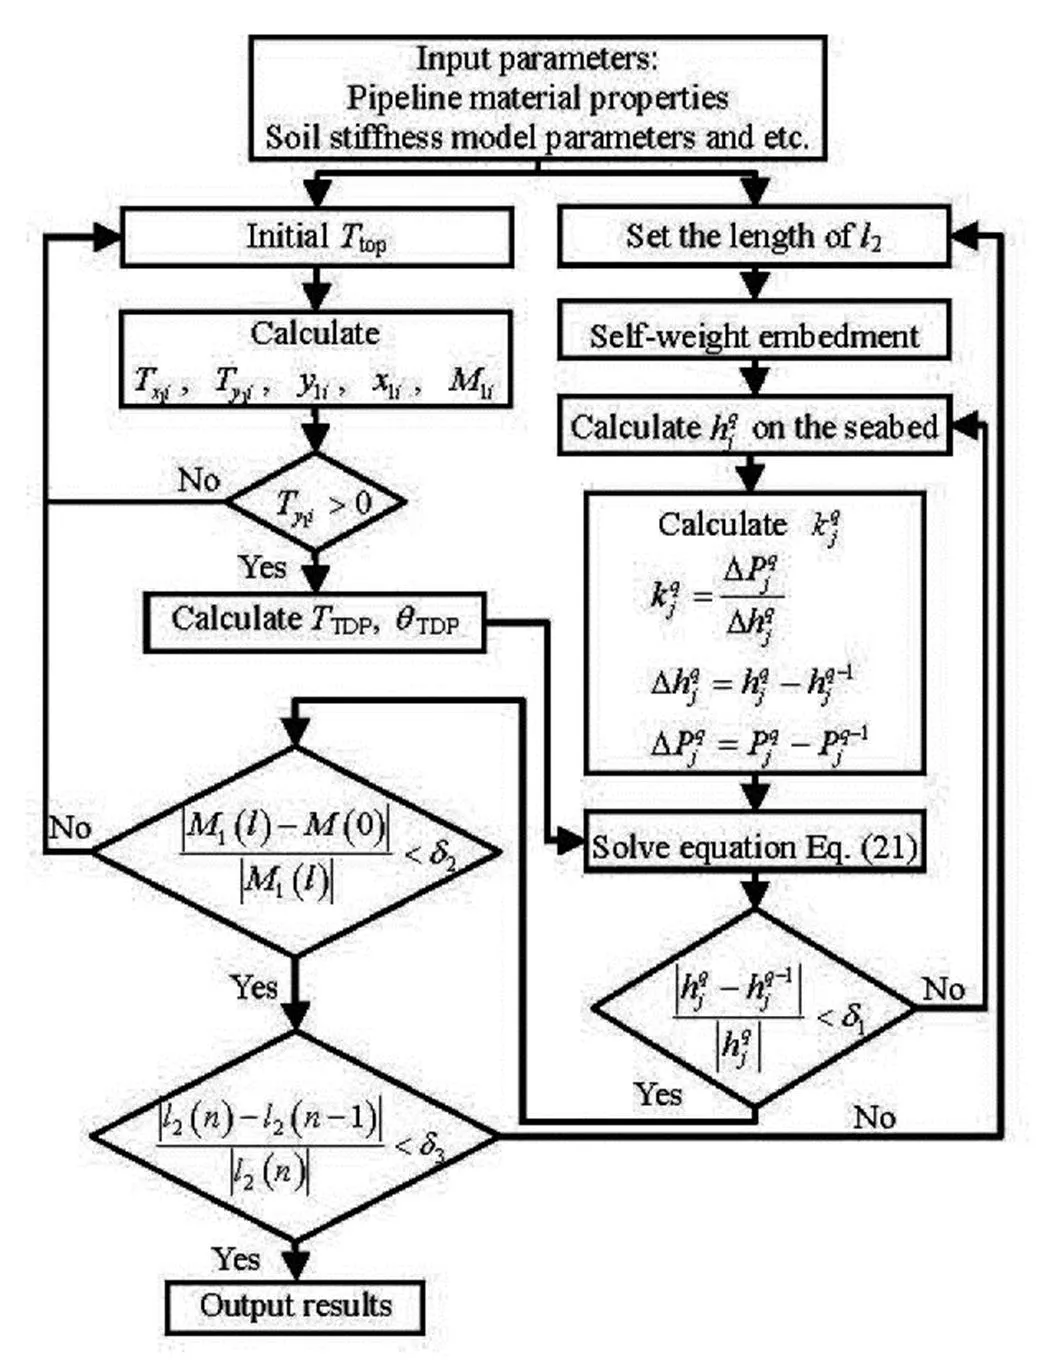
Fig.6 Flowchart for the solution procedure of the model
After the part of the pipeline suspended in water is calculated, the verification is needed to see whether the given tension force is large enough to support the self-weight of the pipeline. If,is too small and should be increased. After the condition ofis satisfied,andcan be inputted into Eq.(21) to solve the touchdown part of the pipe- line.
For the part of the pipeline that is laid down on the seabed,is unknown at the beginning. The first step of the analysis is thus the computation of the self- weight embedment depthof the un-deformed pi- peline. A new value forwill be acquired from the results. Equation (21) is modified accordingly and the iteration is continued until, whereis the embedment depth at theelement of the pipeline obtained afteriterations.
3. Validation and comparison
3.1
In order to validate the present model, the results obtained from the present nonlinear model (NNM) for a constant soil stiffness is compared with these ob- tained from the catenary model (CLM)[14]and the nu- merical model (NLM)[15]with the linear soil stiffness. The calculation parameters are presented in Table 2. The comparisons of the pipeline configurations (hori- zontal distance, vertical distance), the tension forcesand the bending momentsobtained from these three models are shown in Fig.7 to Fig.9, respectively, in which the closer look of the results is also included in some crucial areas of the pipeline. Figure 10 shows the comparison of the soil resistanceson the seabed obtained from these three models. It can be seen from Fig.7 to Fig.10 that the correspo- nding pipeline results obtained from these three mode- ls are in a good agreement, and there is a very minor difference in soil resistance at the maximum embed- ment point.
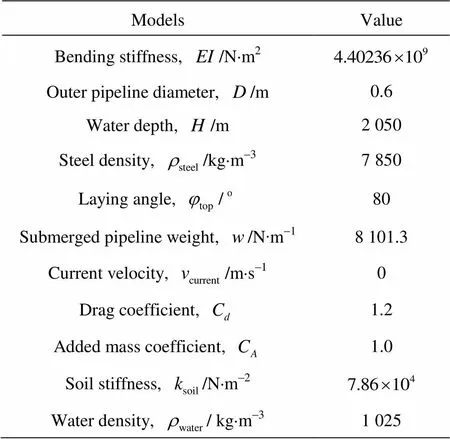
Table 2 Calculation parameters
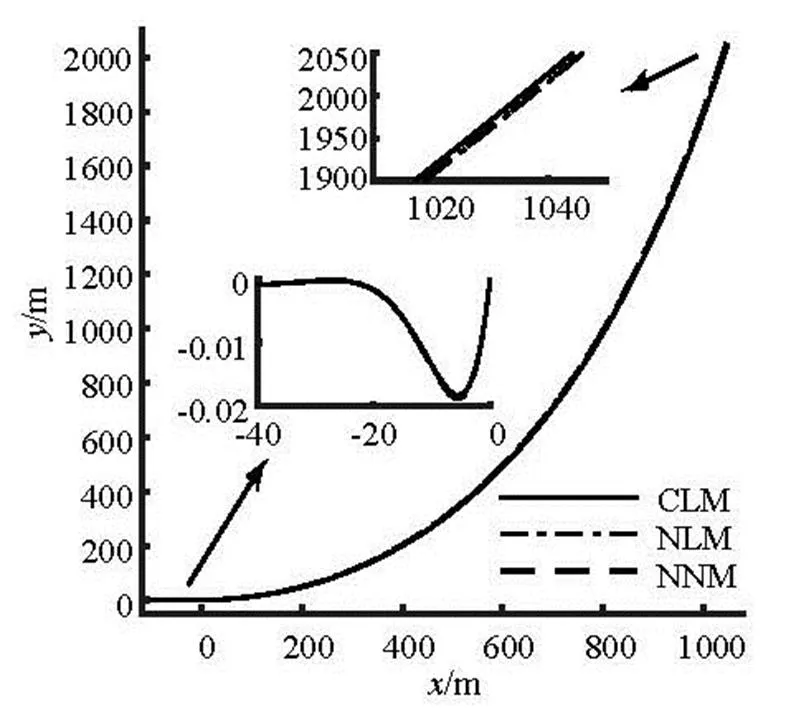
Fig.7 Comparison of the pipeline configurations
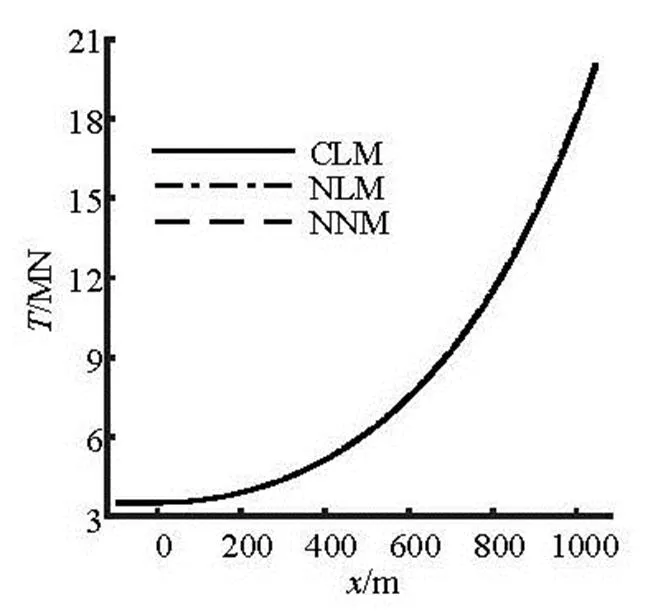
Fig.8 Comparison of the tension forces
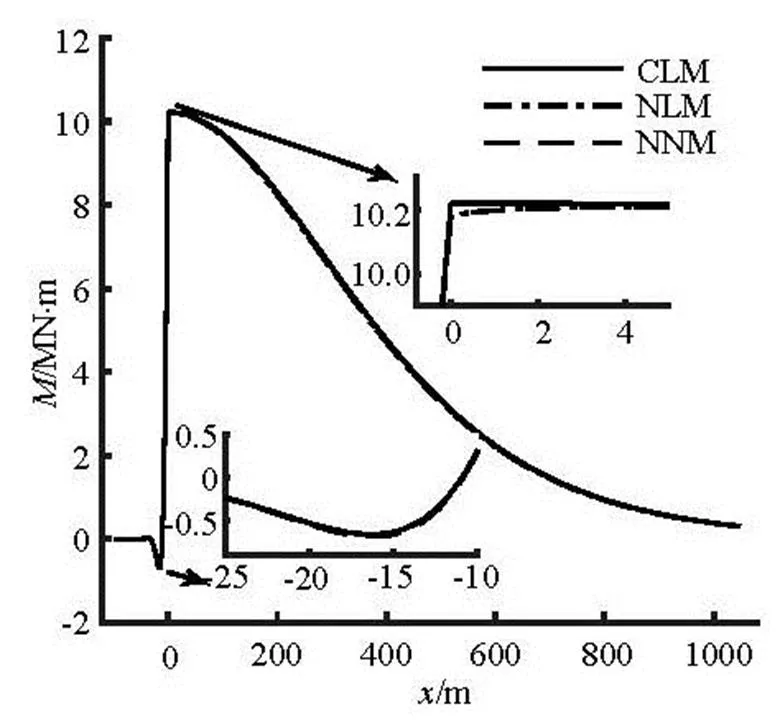
Fig.9 Comparison of the bending moments
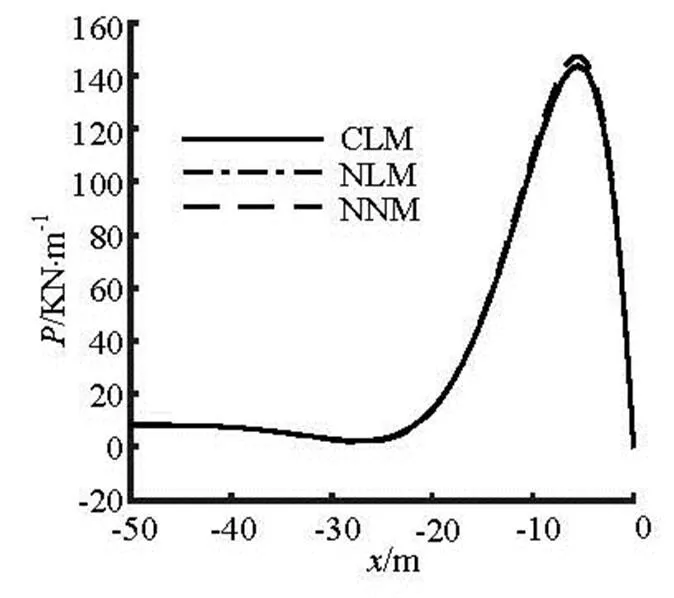
Fig.10 Comparison of the soil resistances on the seabed
In order to have a better quantitative comparison of the results obtained from these three models, the re- sults of the maximum embedment depth, the horizo- ntal departure length, the tension at the top of the pi- peline, the tension at the touchdown point (TDP), and the maximum and minimum bending moments are compared in Table 3. Only a very small difference can be observed in Table 3. The comparison of the results has thus validated the present model.

Table 3 Comparison of the results obtained from the three models
3.2
In order to study the effect of the nonlinearity, the present model (NNM) will be compared with the linear soil stiffness model (NLM). In the present model, the pipeline is assumed to be rough, and the mudline shear strength and the gradient of the soil shear strength are given asand, respectively. In the linear soil stiffness model (NLM), the soil stiffness is set as, so that the two models can have the same self-weight embedment depth of-0.0239 m. The other calculation parameters in these two models are the same as these described in Table 2.
Figure 11 and Table 4 show the comparison of the pipeline configurations obtained from the present nonlinear model and the linear model. It can be seen from Fig.11(a), the overall pipeline configuration does not change much visually. However, the local differe- nce can be observed in the closer look plots in Fig.11(b). In the present nonlinear model, the maxi- mum embedment depths is 112.551% larger than that from the linear soil stiffness model (NLM), although two models have the same self-weight embedment depth.

Table 4 Comparison of the results obtained from the two models
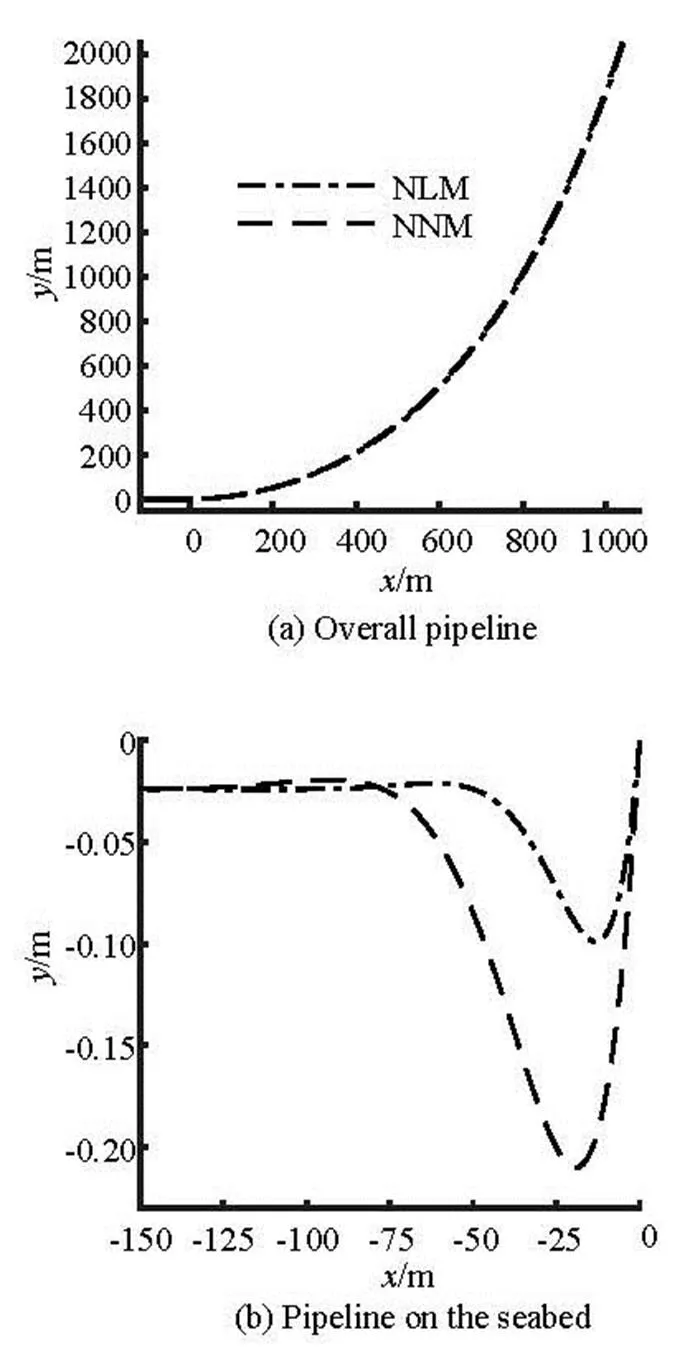
Fig.11 Comparison of the pipeline configurations
The comparisons of the tension forces, the soil resistances, and the bending moments obtained from these two models are shown in Fig.12 to Fig.14, re- spectively. There is a very minor difference between the tension forces obtained from these two models. However, the maximum soil resistance obtained from the linear soil stiffness model (NLM) is about twice as large as that obtained from the present nonlinear model (NNM). There is a very small difference in the bending moment on the part of the pipeline suspended in water. However, it can be seen from Fig.14(b) that the location of the minimum bending moment obtai- ned in the present model is farther from the touch- down point than that from the linear soil stiffness model. Therefore, it is necessary to consider the nonli- near soil stiffness in the pipeline model.
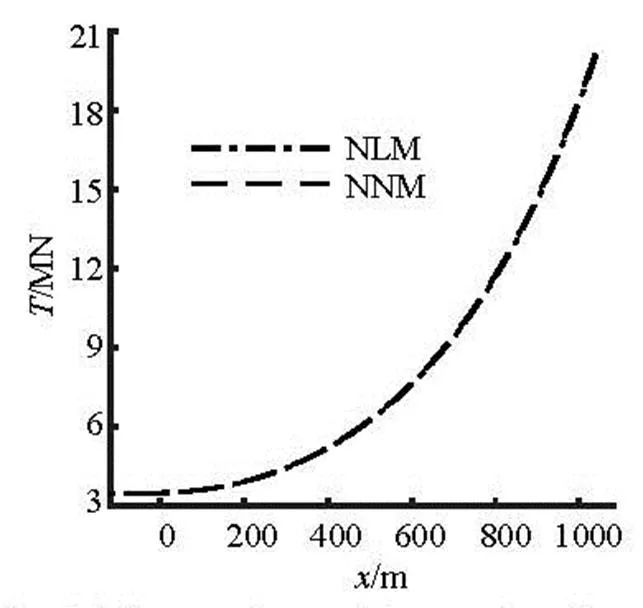
Fig.12 Comparison of the tension forces
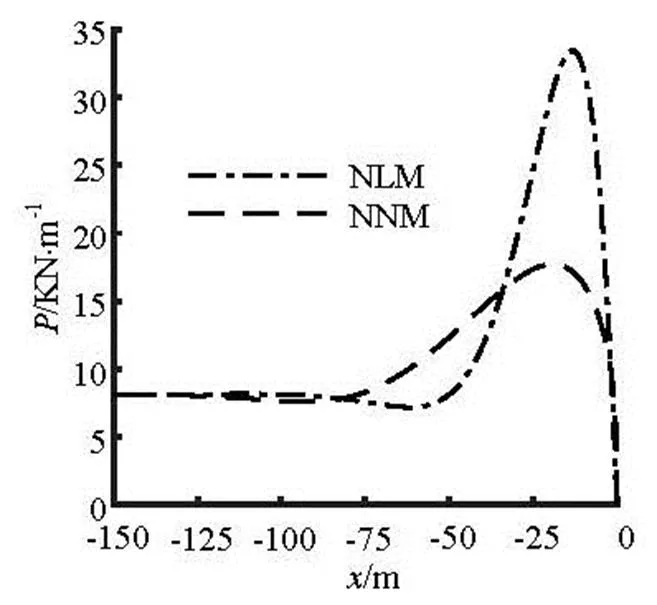
Fig.13 Comparison of the soil resistances on the seabed
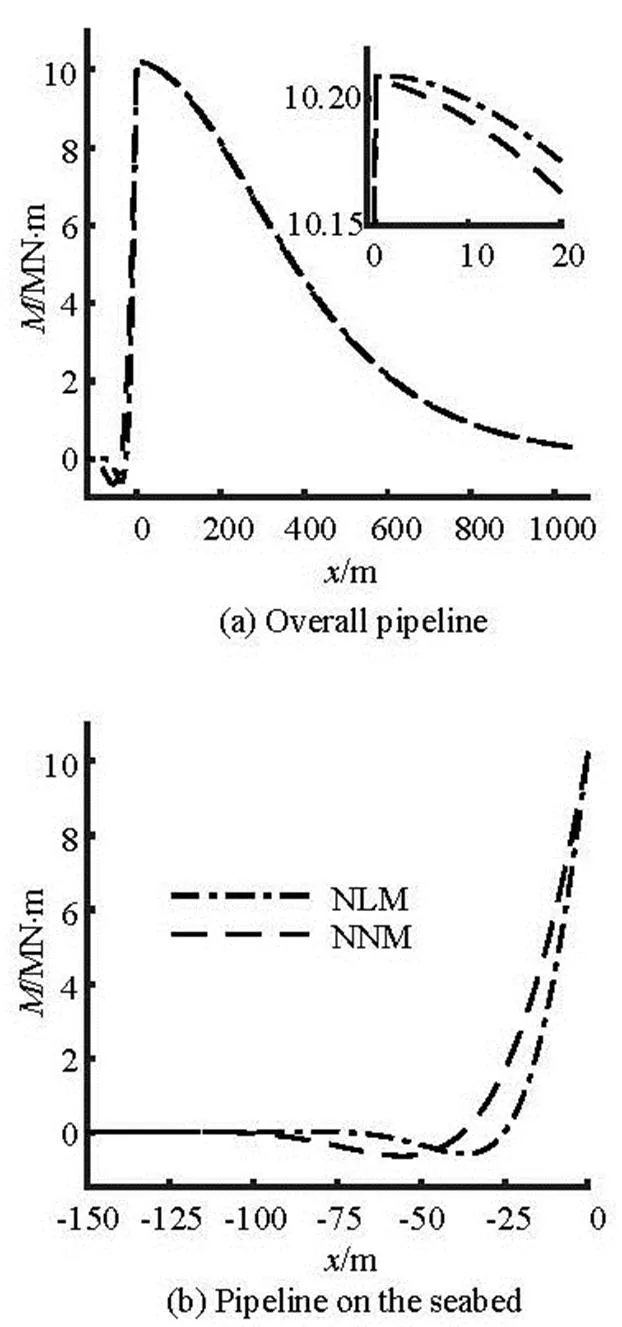
Fig.14 Comparison of the bending moments
4. Parametric study of the soil resistance model
The parameters in the soil resistance model de- scribed in Eq.(9) include the mudline shear strength defined as the undrained shear strength at the surface of the seabed, the gradient of the soil shear strength, the outer pipeline diameter and the fitting coefficientsand. In the following sections, the parametric analysis will be performed to illustrate the features of the soil resistance model and the effects of the various parameters.
4.1
In order to study the effect of the mudline shear strength on the pipelaying solution, the soil with a shear strength gradientand the mu- dline shear strength1 000 Pa, 3 000 Pa, 5 000 Pa, 7 000 Pa are considered for a pipeline. The pipeline is assumed to be a rough one, and the other parameters are the same as these specified in Table 2.
The comparisons of the pipeline configurations, the tension forces along the pipeline, the soil resista- nces on the seabed, and the bending moments for di- fferent mudline shear strength are plotted in Fig.15 to Fig.18, respectively. The comparisons of the horizo- ntal departure lengths, the maximum embedment dep- ths, the self-weight embedment depths, the maximum soil resistances, the tension forces at the top of the pi- peline, the tension forces at the touchdown point, the maximum and minimum bending moments are prese- nted in Table 5 for different mudline shear strength.

Table 5 Comparison of the results for different mudline shear strengths
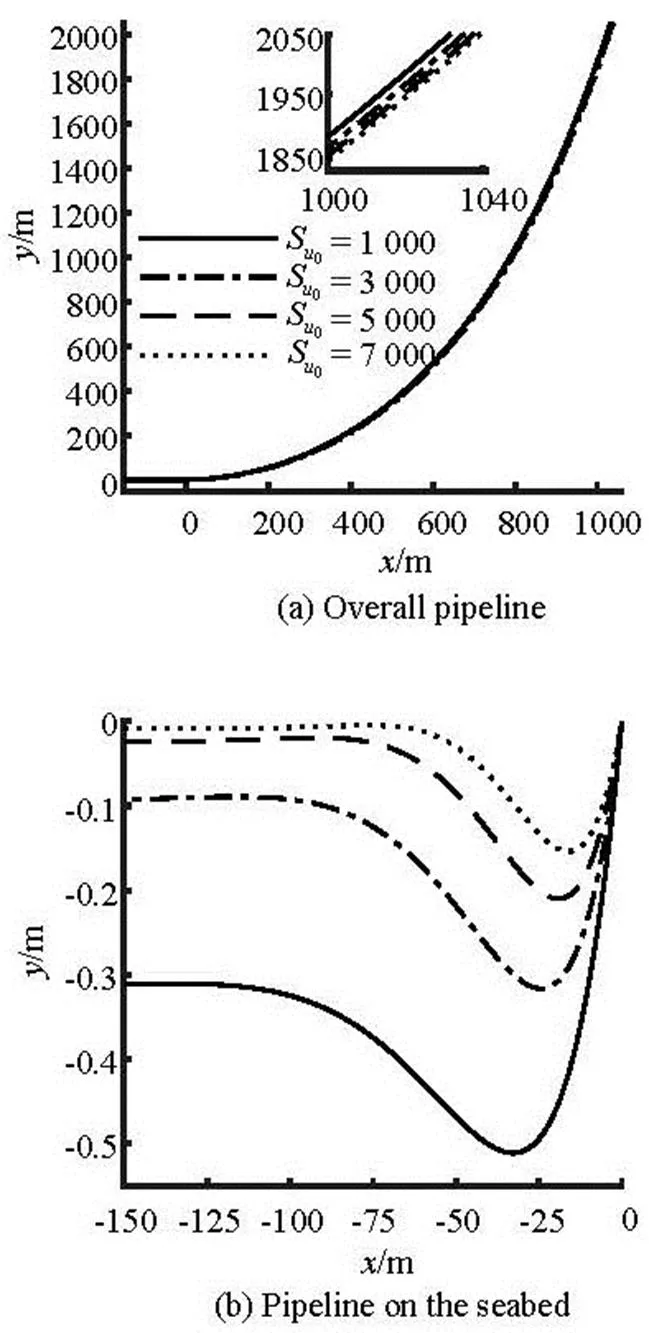
Fig.15 Comparison of the pipeline configurations for different mudline shear strength
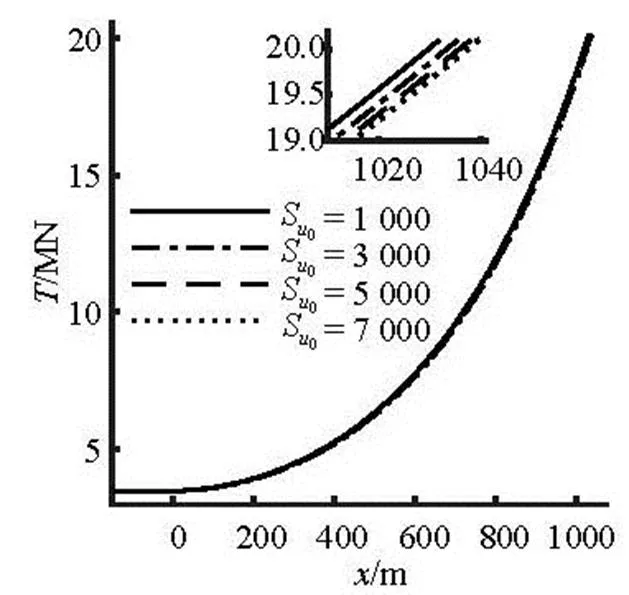
Fig.16 Comparison of the tension forces along the overall pipe- line for different mudline shear strengths
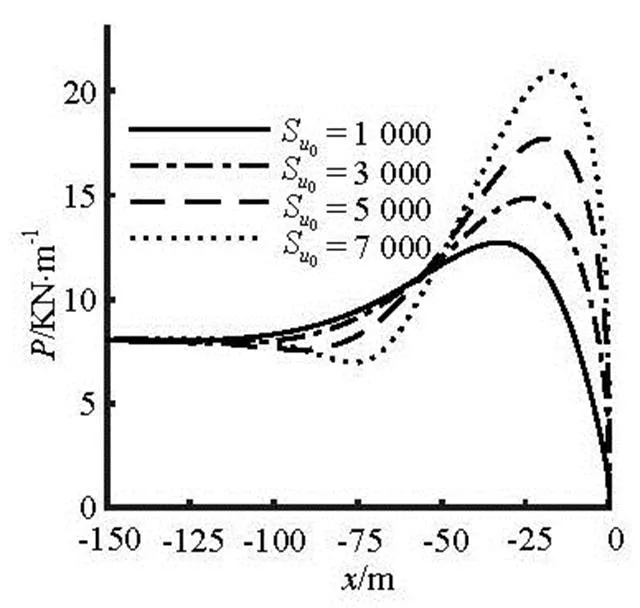
Fig.17 Comparison of the soil resistances on the seabed for di- fferent mudline shear strengths
As shown in Table 5 and Fig.15, the horizontal departure length has a small increase from 1 031.806 m to 1 039.462 m with the increase of the mudline shear strength, the maximum embedment depths at3 000 Pa, 5 000 Pa, 7 000 Pa are 38.160%, 58.904% and 69.863% smaller than that at, and the self-weight embedment depths are 71.285%, 92.415%, 97.483% smaller than that at, respectively. Furthermore, the touch- down zone is closer to the touchdown point with the increase of the mudline shear strength. A large varia- tion of the soil resistance can be observed in Fig.17 for different mudline shear strength. It can be obse- rved in Fig.16 and Fig.18 that there is only a small di- fference in the tension force and bending moment along the part of the pipeline suspended in water with the increase of the mudline shear strength. However, the minimum bending moment on the pipeline laid on the seabed increases with the increase of the mudline shear strength.
4.2
In order to study the effect of the gradient of the soil shear strength on the pipelaying solution, the soil with a mudline shear strengthand the shear strength gradient0 Pa/m, 5 000 Pa/m, 10 000 Pa/m, 20 000 Pa/m are considered for a pipe- line. The pipeline is assumed to be a rough one, and the other parameters are the same as these specified in Table 2.
The comparisons of the pipeline configurations, the tension forces along the pipeline, the soil resista- nces on the seabed, and the bending moments for di- fferent shear strength gradient are plotted in Fig.19 to Fig.22, respectively. The comparisons of the horizo- ntal departure lengths, the maximum embedment dep- ths, the self-weight embedment depths, the maximum soil resistances, the tension forces at the top of the pi- peline, the tension forces at the touchdown point, the maximum and minimum bending moments are prese- nted in Table 6 for different shear strength gradient.

Table 6 Comparison of the results for different shear strength gradients
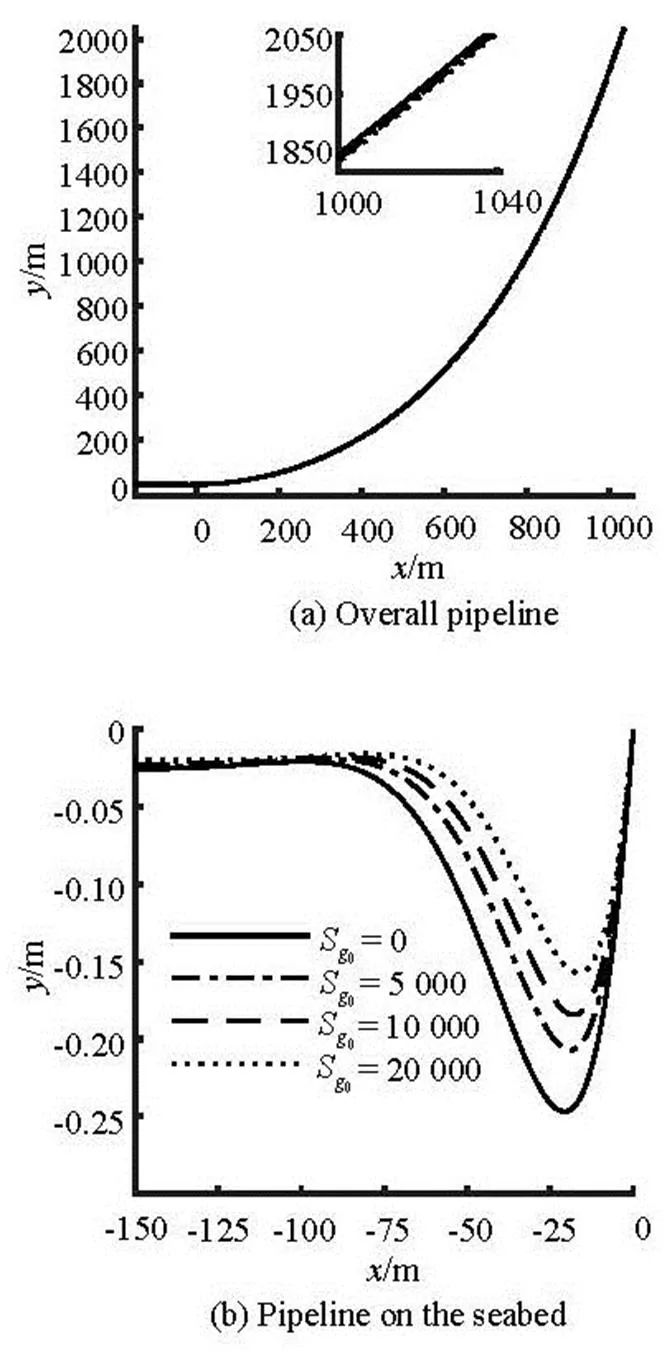
Fig.19 Comparison of the pipeline configurations for different shear strength gradients
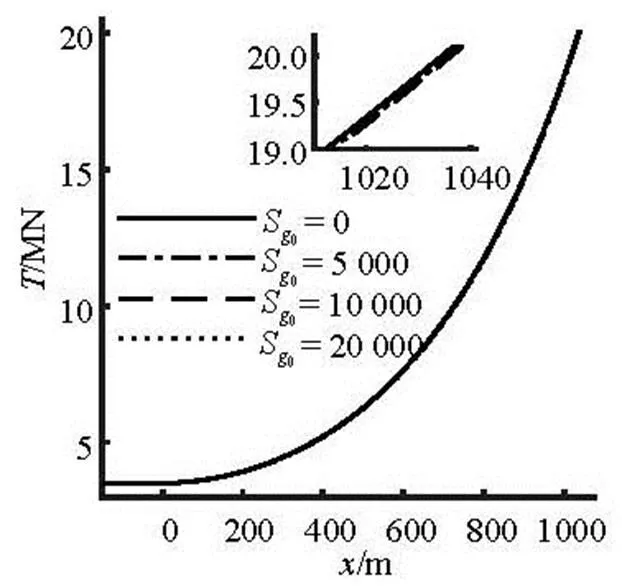
Fig.20 Comparison of the tension forces along the overall pipe- line for different shear strength gradients
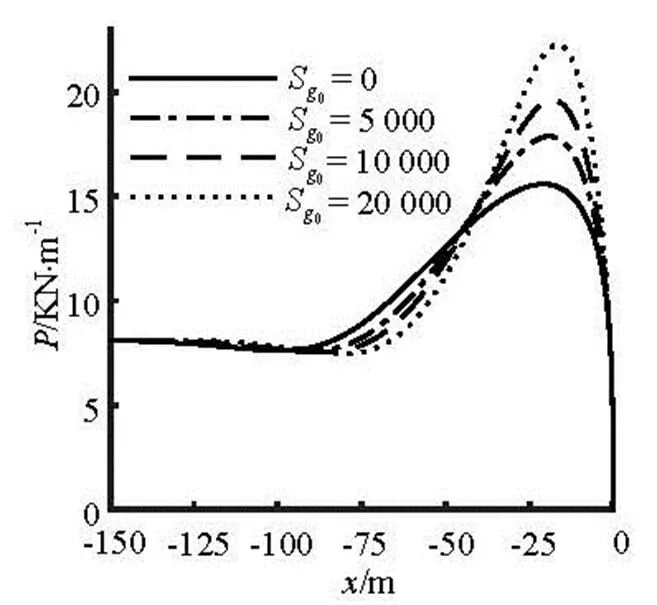
Fig.21 Comparison of the soil resistances on the seabed for di- fferent shear strength gradients
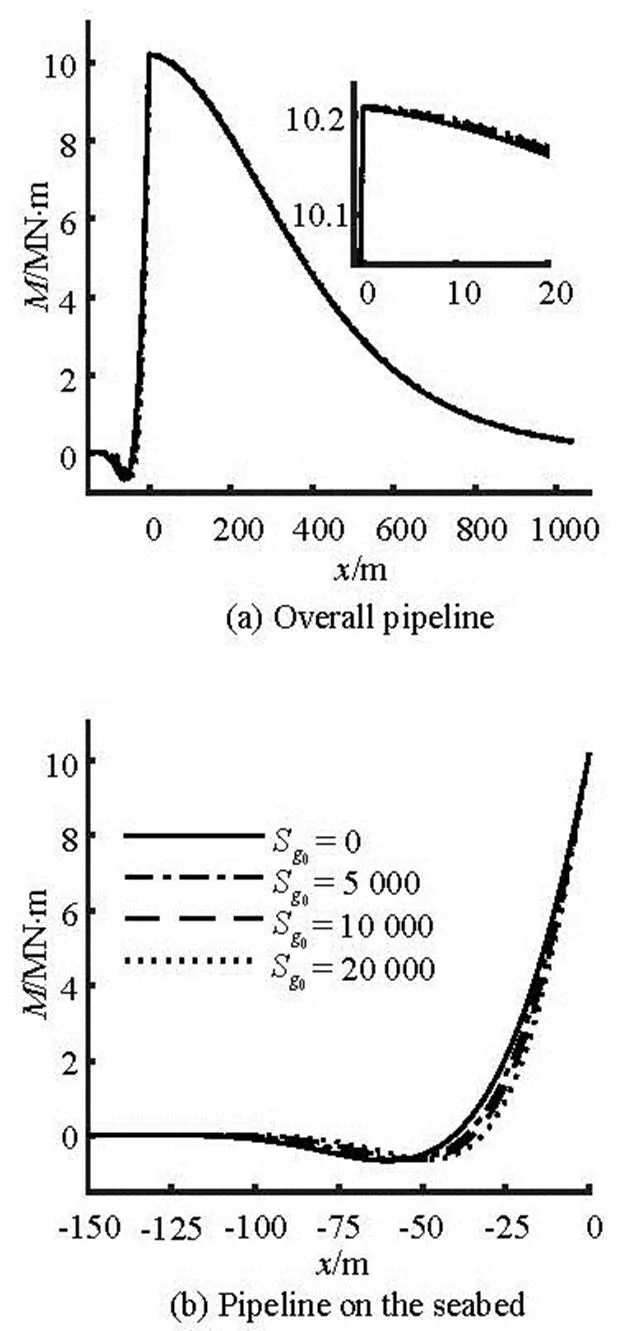
Fig.22 Comparison of the bending moments for different shear strength gradients
As shown in Fig.19(a) and Fig.20, the variation of the shear strength gradient has a small effect on the overall configuration and the tension force along the pipeline. It can be observed from Table 6 that the ma- ximum embedment depth is reduced from-0.247 m forto-0.157 m for(changed 36.437%), but the self-weight embedment depth has very little change with the increase of the shear strength gradient. It can be seen from Fig.21 that the maximum soil resistance at5 000 Pa/m, 10 000 Pa/m and 20 000 Pa/m are 14.712%, 25.753% and 42.887% larger than that at, As shown in Fig.22(a), the bending moment has a very minor difference on the part of the pipeline suspended in water. However, it can be seen from Fig.22(b) that the minimum bending moment has a small increase with the increase of the shear strength gradient.
4.3
In order to study the effect of the outer diameter of the pipeline on the pipelaying solution, the soil with the mudline shear strengthand the shear strength gradientare conside- red for a pipeline with the outer diameter0.6 m, 0.8 m, 1.0 m, 1.2 m, respectively. The pipeline is assu- med to be a rough one, and the other parameters are the same as these presented in Table 2.
The comparison of the pipeline configurations, the tension forces along the pipeline, the soil resista- nces on the seabed, and the bending moments for di- fferent outer diameter are plotted in Fig.23 to Fig.26, respectively. The comparisons of the horizontal depar- ture lengths, the maximum embedment depths, the self-weight embedment depths, the maximum soil re- sistances, the tension forces at the top of the pipeline, the tension forces at the touchdown point, the maxi- mum and minimum bending moments are presented in Table 7 for different outer diameter of the pipeline.

Table 7 Comparison of the results for the pipeline with different outer diameters
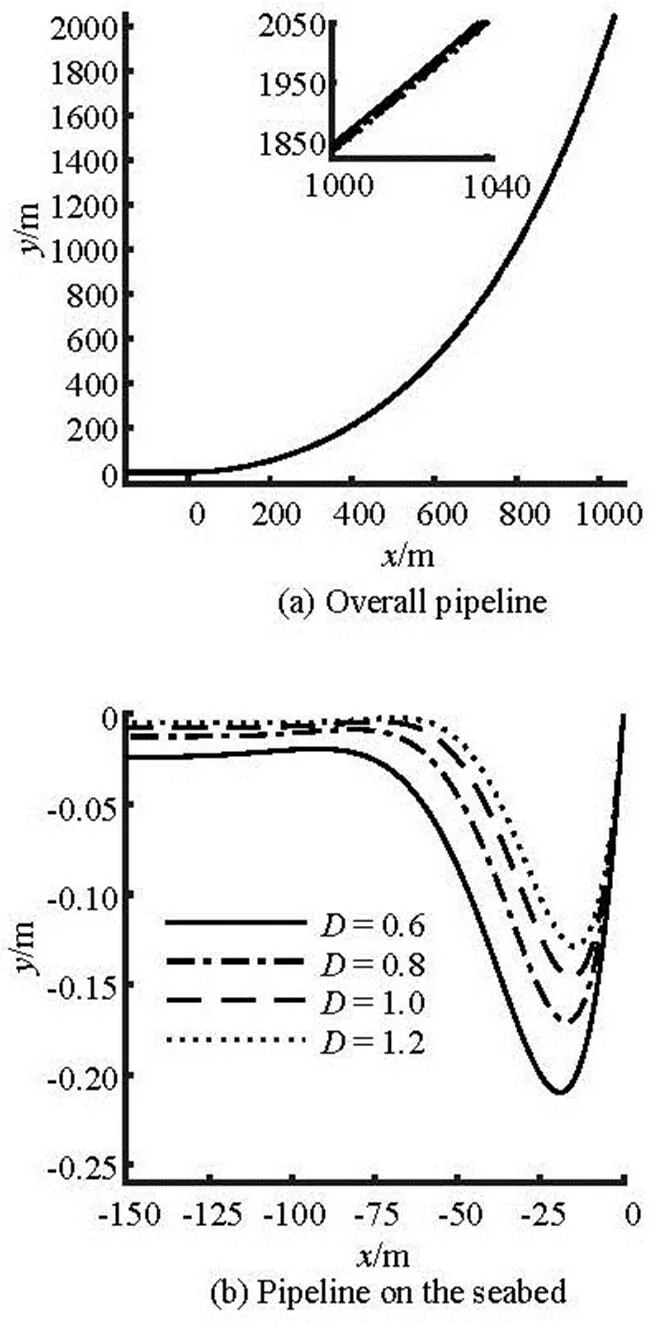
Fig.23 Comparison of the pipeline configurations for the pipe- line with different outer diameters
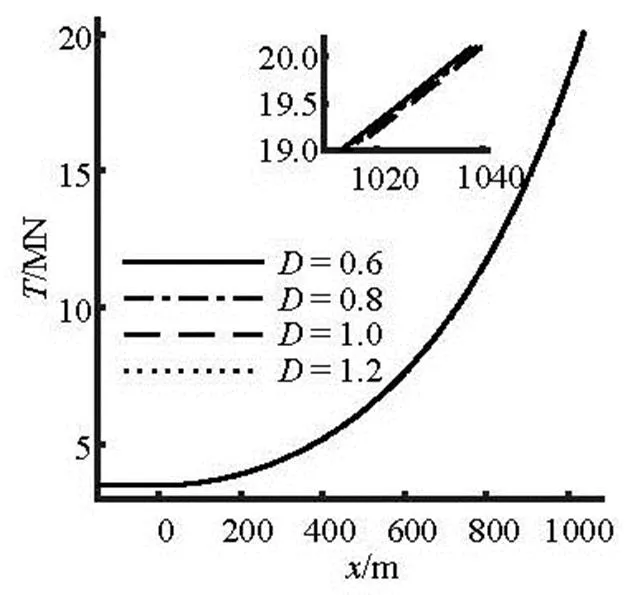
Fig.24 Comparison of the tension forces for the pipeline with different outer diameters
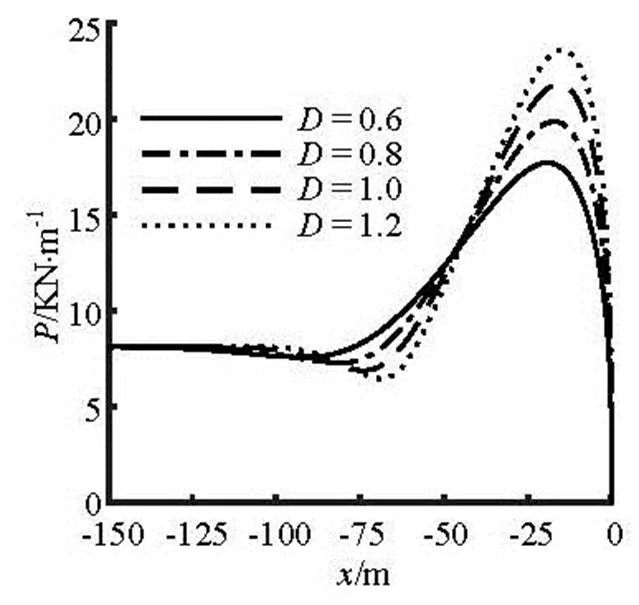
Fig.25 Comparison of the soil resistances on the seabed for the pipeline with different outer diameters
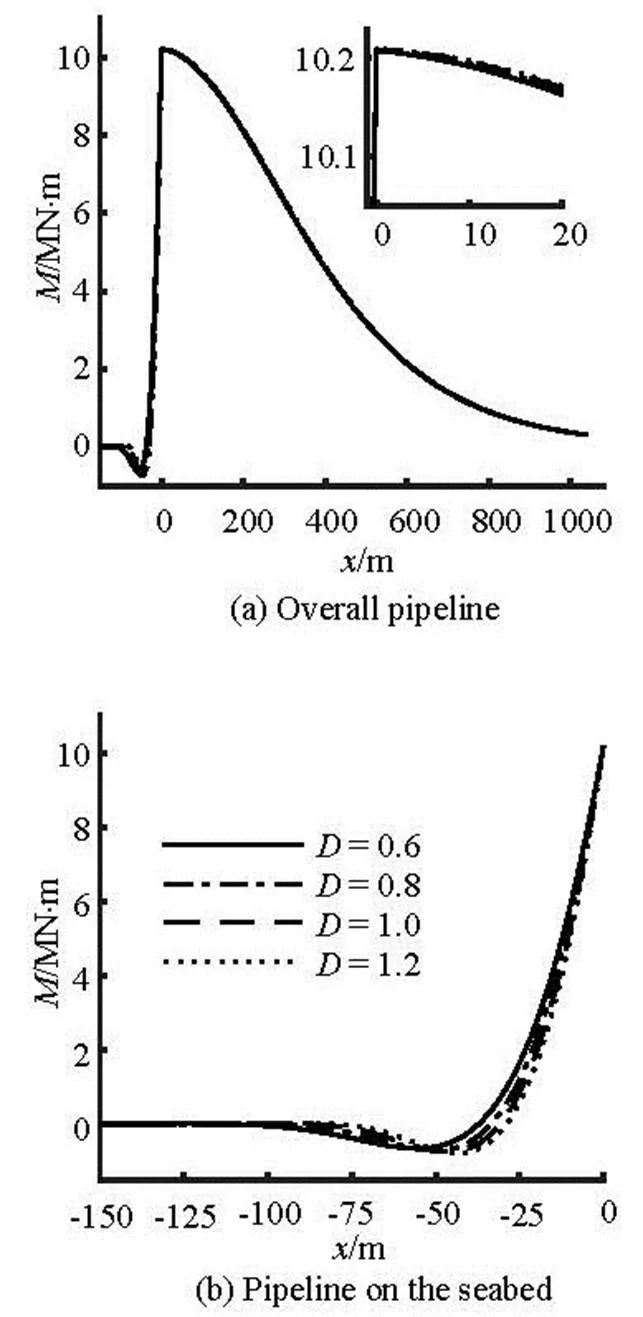
Fig.26 Comparison of the bending moments for the pipeline with different outer diameters
It can be seen from Fig.23(a), the horizontal de- parture length has a small increase as the outer diame- ter of the pipeline increases. It can be seen from Table 7 that the maximum embedment depths at0.8 m, 1.0 m and 1.2 m are 18.571%, 30.477% and 38.571% smaller than that at, and the self-weight embedment depths are 48.536%, 69.874%, 80.753% smaller than that at, respectively. As shown in Fig.25, the changes of the soil resistance for the part of the pipeline on the seabed are very large with the increase of the outer diameter of the pipeline. As shown in Fig.24 and Fig.26(a), the tension force and the bending moment on the pipeline suspended in water have a very minor differences for the pipeline with different outer diameters. However, it can be seen from Fig.26(b) that the minimum bending mome- nt has a small increase with the increase of the outer diameter of the pipeline. Furthermore, the minimum bending moment position gets closer to the touchdown point with the increase of the outer diameter of the pi- peline.
5. Conclusions
A numerical model that accounts for the nonli- near soil stiffness on the seabed is developed in this paper to evaluate a J-lay pipeline. The maximum em- bedment depth of the pipeline obtained using the pre- sent model is twice as large as that obtained using the linear soil stiffness model, and the maximum soil resi- stance obtained using the present model is about the half of that obtained using the linear soil stiffness model. The minimum bending moment obtained from the present model only differs slightly from that ob- tained from the linear model. However, the position of the minimum bending moment predicted by the prese- nt model is farther from the touchdown point than that predicted by the linear model. The calculation results have shown that it is necessary to consider the nonli- near soil stiffness for the pipelaying solution.
The parameters in the nonlinear soil resistance model have been studied with the present model to de- termine their effects on the pipelaying solution. Speci- fically, the effects of the three parameters that include the mudline shear strength, the gradient of the soil shear strength, and the outer diameter of the pipeline, have been studied in detail. All these three parameters affect the pipelaying solution, and the mudline shear strength has a much larger effect on the solution in comparison with the shear strength gradient and the outer diameter of the pipeline.
Acknowledgments
The first author would like to acknowledge the Center for Computational Fluid Dynamics in the De- partment of Physics and Astronomy at George Mason University for hosting him as a visiting student in the CFD Center for a year.
References
[1] LI Zhi-gang, WANG Cong and HE Ning et al. An over- view of deepwater pipeline laying technology[J]. China Ocean Engineering, 2008, 22(3): 521-532.
[2] PLUNKETT R. Static bending stresses in catenaries and drill strings[J]. Journal of Manufacturing Science and Engineering, 1967, 89(1): 31-36.
[3] DIXON D., RUTLEDGE D. Stiffened catenary calcula- tions in pipeline laying problem[J]. Journal of Manufa- cturing Science and Engineering, 1968, 90(1): 153-160.
[4] BREWER W. V., DIXON D. A. Influence of lay barge motions on a deepwater pipeline laid under tension[J]. Journal of Manufacturing Science and Engineering, 1970, 92(3): 595-604.
[5] JENSEN G. A., FOSSEN T. I. A robotic approach to non- linear dynamic modeling of offshore pipelaying operatio- ns[C]. Proceedings of the 8th IFAC International Con- ference on Manoeuvring and Control of Marine Craft. Guarujá, Brazil, 2009, 127-133.
[6] WITTBRODT E., SZCZOTKA M. and MACZYŃSKI A. et al. Rigid finite element method in analysis of dyna- mics of offshore structures[M]. Berlin, Germany: Springer, 2013.
[7] KANG Z., ZHANG L. and ZHANG X. Analysis on J lay of SCR based on catenary and large deflection beam theo- ry[J]. Ocean Engineering, 2015, 104: 276-282.
[8] AUBENY C., SHI H. and MURFF J. Collapse loads for a cylinder embedded in trench in cohesive soil[J]. Interna- tional Journal of Geomechanics, 2005, 5(4): 320-325.
[9] YOU J., BISCONTIN G. and AUBENY C. Seafloor inte- raction with steel catenary risers[C]. Proceedings of the 18th International Offshore and Polar Engineering Conference (ISOPE). Vancouver, Canada, 2008, 110- 117.
[10] SHIRI H., HASHEMI H. Simplified approximation of peak fatigue damage in the touchdown area of steel cate- nary risers based on seabed soil rigidity[C]. Proceedings of the 22nd International Offshore and Polar Engi- neering Conference (ISOPE). Rhodes, Greece, 2012, 287-294.
[11] KATIFEOGLOU S. A., CHATJIGEORGIOU I. K. Dyna- mic interaction of catenary risers with the seafloor[J]. Applied Ocean Research, 2012, 38(5): 1-15.
[12] BEAUFAIT F. W., HOADLEY P. W. Analysis of elastic beams on nonlinear foundations[J]. Computers and Stru- ctures, 1980, 12(5): 669-676.
[13] JENSEN G. A., SÄFSTRÖM N. and NGUYEN T. D. et al. A nonlinear PDE formulation for offshore vessel pipeline installation[J]. Ocean Engineering, 2010, 37(4): 365-377.
[14] LENCI S., CALLEGARI M. Simple analytical models for the J-lay problem[J]. Acta Mechanica, 2005, 178(1): 23- 39.
[15] WANG Li-zhong, YUAN Feng and GUO Zhen et al. Nu- merical analysis of pipeline in J-lay problem[J]. Journal of Zhejiang University A, 2010, 11(11): 908-920.
[16] WANG L. Z., YUAN F. and GUO Z. et al. Analytical pre- diction of pipeline behaviors in J-lay on plastic seabed[J]. Journal of Waterway, Port, Coastal, and Ocean Engi- neering, 2012, 138(2): 77-85.
[17] QUÉAU L. M., KIMIAEI M. and RANDOLPH M. F. Analytical estimation of static stress range in oscillating steel catenary risers at touchdown areas and its application with dynamic amplification factors[J]. Ocean Enginee- ring, 2014, 88: 63-80.
[18] YUAN F., RANDOLPH M. F. and WANG L. et al. Refi- ned analytical models for pipe-lay on elasto-plastic sea- bed[J]. Applied Ocean Research, 2014, 48: 292-300.
[19] LI M., DUAN M. and YE M. et al. Research on mechani- cal model for the J-lay method[J]. Proceedings of the In- stitution of Mechanical Engineers, Part M: Journal of Engineering for the Maritime Environment, 2015, 229(3): 273-280.
[20] MORISON J., JOHNSON J. and SCHAAF S. The force exerted by surface waves on piles[J]. Journal of Petro- leum Technology, 1950, 2(5): 149-154.
[21] BEAUFAIT F. W. Numerical analysis of beams on elastic foundations[J]. Journal of the Engineering Mechanics Division, 1977, 103(1): 205-209.
* Project supported by the China Scholarship Council, the Technology Major Project of China (Grant No. 2011ZX05027- 002), the National Natural Science Foundation of China (Grant No. 51409128) and the University Natural Science Research Project of Jiangsu Province (Grant No. 14KJB570001).
Biography: Ying-fei ZAN (1985-), Male, Ph. D. Candidate
Corresponding author: Chi YANG,E-mail: cyang@gmu.edu
10.1016/S1001-6058(16)60603-0 2016,28(1):10-22
水动力学研究与进展 B辑2016年1期
- 水动力学研究与进展 B辑的其它文章
- Flow, thermal criticality and transition of a reactive third-grade fluid in a pipe with Reynoldsʼ model viscosity*
- Investigation of the effects of platform motion on the aerodynamics of a floating offshore wind turbine*
- Mixing of two different electrolyte solutions in electromagnetic rectangular mixers*
- A new biomimicry marine current turbine: Study of hydrodynamic performan- ce and wake using software OpenFOAM*
- Study of bedload transport in backwater flow*
- Experimental study of water and dissolved pollutant runoffs on impervious surfaces*
