Analytical and finite-element study of optimal strain distribution in various beam shapes for energy harvesting applications
B.L.Ooi·J.M.Gilbert·A.Rashid A.Aziz
RESEARCH PAPER
Analytical and finite-element study of optimal strain distribution in various beam shapes for energy harvesting applications
B.L.Ooi1·J.M.Gilbert2·A.Rashid A.Aziz3
©The Chinese Society of Theoretical and Applied Mechanics;Institute of Mechanics,Chinese Academy of Sciences and Springer-Verlag Berlin Heidelberg 2016
Owing to the increasing demand for harvesting energy from environmental vibration for use in self-powered electronic applications,cantilever-based vibration energy harvesting has attracted considerable interest from various parties and has become one of the most common approaches to converting redundant mechanical energy into electrical energy.As the output voltage produced from a piezoelectric material depends largely on the geometric shape and the size of the beam,there is a need to model and compare theperformanceofcantilever beamsofdifferinggeometries. This paper presents the study of strain distribution in various shapes of cantilever beams,including a convex and concave edge profile elliptical beam that have not yet been discussed in any prior literature.Both analytical and finite-element models are derived and the resultant strain distributions in the beam are computed based on a MATLAB solver and ANSYS finite-element analysis tools.An optimum geometryforavibration-basedenergyharvestingsystemisverified. Finally,experimentalresultscomparingthepowerdensityfor triangular and rectangular piezoelectric beams are also presented to validate the findings of the study,and the claim,as suggested in the literature,is verified.
Variable geometry beam·Elliptical beam shape·Vibration-based energy harvesting·Strain
distribution
1 Introduction
Energyharvestingistheprocessbywhichenergyiscaptured from ambient resources(e.g.,solar,thermal,wind,biochemical,vibration)and converted to electrical energy for storage or use.Over the last decade,owing to advances in integratedcircuits,thesizeandpowerconsumptionofelectronic devices have been dramatically reduced[1],which has made it possible to power devices by energy harvesting techniques without any external power sources.Wireless sensor systems are creating much interest because of their flexibility and wider range of usable applications.Removing wires or replaceable batteries from devices unlocks the potential for placingthedevicesinpreviouslyinaccessiblelocations,such as,forexample,rooftops,underneathfloorpanels,orembedded in building walls.In addition,by incorporating energy harvestingintodevices,severalshortcomingsofconventional electronic devices may be overcome,such as the limited lifetime that results from finite battery capacity and higher maintenance costs for batteries replacement programs.
Vibration energy is one of the common resources that is available at many locations targeted for wireless sensors. For example,vibration energy is generally left unused and redundantinbuildings,machinery,trafficinfrastructuresand many more locations.This makes vibration energy one of the most attractive energy harvesting areas to be investigated further for use as the power source in electronic devices and wireless sensor networks.A few different types of transducer aregenerally usedfortheconversion ofvibrations into
✉ B.L.Ooi benglee_85@hotmail.com
1Faculty of Integrative Sciences and Technology,Quest International University Perak(QIUP),227 Jalan Raja Permaisuri Bainun,30250 Ipoh,Perak,Malaysia
2Faculty of Science and Engineering,School of Engineering,University of Hull,Cottingham Road,Hull HU6 7RX,UK3Center for Automotive Research and Electric Mobility(CAREM),Universiti Teknologi PETRONAS(UTP),Bandar Seri Iskandar,31750 Tronoh,Perak,Malaysiaelectricity,including electrostatic[2],electromagnetic[3],magnetostrictive[4],and piezoelectric[5]transducers.Each type has its own advantages and drawbacks in term of device size,output power density,cost,and so on.However,owing to their energy conversion efficiency,piezoelectric transducers have rapidly gained momentum in recent years as one of the most reliable mechanisms for converting mechanical energy into electrical form[6].Piezoelectric materials are resilient,chemically inert,and small in size and allow operation at high temperature and humidity levels,as well as in other challenging environmental conditions.This makes this type of transducer suitable for many industrial applications,suchaspoweringmachinerysensorsthatoperateoverawide temperature range and in dusty environments.
Although many other types of beam configurations are available[7-10],cantilever beam configurations are still in favor because they give lower resonant frequencies and relatively higher strain for a given force input[11],whereas the successful maximum power harvested has shown to be greater for beams with lower resonant frequencies[12].An electricalpotentialdifferencewillbegeneratedfromapiezoelectric material when pressure is applied to it.This effect is widely utilized by many researchers in energy harvesting to convert kinetic motions into electrical energy.Many sources in the literature have shown that piezoelectric transduction is an effective conversion mechanism for use in energy harvesting[13-16].These energy harvesting devices typically consist of a cantilever beam made from a piezoelectric element and a tip mass.Vibration of the cantilever mounting causes deformation of the beam and,hence,the generation of electricity.To extract the greatest output voltage from a piezoelectric material,the type of materials and shape of the beam must be carefully selected.Because of its high piezoelectric coupling coefficient,lead zicronate titanate(PZT)is preferable to other materials[17],including zinc oxide(ZnO),galliumorthophosphate(GaPO4),andpolyvinylidene difluoride(PVDF).Apart from the material,the geometric parameters,such as the beam width,thickness,and length,will also affect the amount of output emanating from the beam[18].Tomaximizetheoutput,onecanmatchtheelectricalcircuitimpedancetotheoutputload[19]ormaximizethe material efficiency by maintaining a higher level of average strain in the beam elements.However,the peak strain must be limited to avoid permanent damage to the beam.Thus,the greatest power density can be achieved if all parts of the cantilever experience equal strain at a value just below the maximum acceptable strain on the material(the maximum acceptable strain might be set to the yield strength of the material or,at a lower value,selected to give an appropriate number of cycles before failure due to fatigue).Some work has been performed to mathematically compare the performance from various shapes of piezoelectric beam[20,21]. It has been concluded that for the same volume of piezoelectric material,a tapered beam(approaching a triangular shape)will have more evenly distributed strain throughout thestructure,asopposedtoarectangularbeamthatcontainsa nonuniformstraindistribution.Hence,asmaller,higheraverage output power density and less expensive harvester can be achieved by implementing a truncated triangle cantilever beamenergyharvestingsystem.However,itisworthwhileto investigatetheoutputresponseandbehaviorfromelliptically profiled beams,which,to the authors’best knowledge,have not yet been considered.It is known that the fundamental vibration frequency for almost all energy harvester applications is under some lower frequency,typically from 10 to 250Hz[22].Hence,itisassumed thatallbeams under investigation in this paper will only be oscillated in a first-mode vibration;because of this assumption,it is appropriate and sufficient to model the beams using static analysis.
Themainfocusofthispaperistocomparethestraindistribution of various geometric shapes of single-layer cantilever beams,including the elliptically profiled beams.The strain effectsineachbeamarestudiedanalyticallyandnumerically using the MATLAB solver and ANSYS multiphysics tools,respectively.Both simulated results are then discussed and benchmarked among themselves to validate the findings in this investigation.Experimental results are also presented to validatethefindingsfromanalyticalandfinite-elementanalysis studies.Finally,the results are discussed and conclusions drawn.
2 Analytical modeling of a cantilever beam
2.1 Model
An analytical model is developed to determine the strain along the center line of the cantilever in the x direction.It will be assumed that the strain is uniform in the y direction,as given in Fig.1.
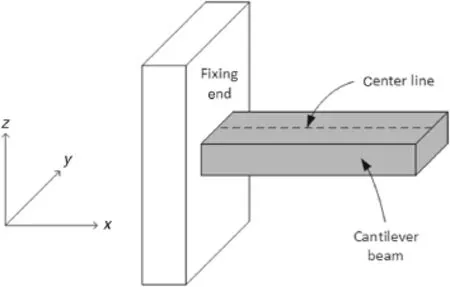
Fig.1 Center line on a rectangular cantilever beam
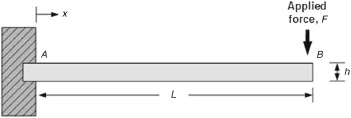
Fig.2 Cantilever beam with concentrated force at free end
Foracantileverbeamwithoneendfixedandtheotherend free to move,as shown in Fig.2,the bending moment,M,at a point x along the cantilever beam from point A to point B can be given as[23]

Whenthewidthofthebeam,b(x),isallowedtovaryalong its length,x,the moment of inertia at a distance x from the root is

where F isthefree-endforce,x isthepositionalongthebeam fromtheoriginpoint A,L isthetotallengthofthebeam,and b and h are the width and height dimensions of the beam,respectively.Assuming that the strain across the width of the cantilever beam is constant and that the deflection is small,it isclearthatwhen x=L,thebendingmomentatthefreeend for the cantilever will be zero.Generally,the tensile stress experienced by the beam can be expressed as[23]

where c is the distance from the beam’s neutral axis to a point of interest(c is constant along the x direction for a fixed-height cantilever beam)?is the second derivative of the beam deflection u,and E is the Young’s modulus for the material used in the beam.The relationship between the bending strain at any x location as a function of beam curvature,R,and the distance from the neutral axis can be given as[24]

Since the Young’s modulus for the material is ? this gives the axial strain above the neutral axis as

Thisimpliesthatthesecondderivativeofthebeamdeflection is equal to the inverse of the radius of curvature ?
Five different geometric beam structures were investigated in this study(Fig.3).Structure 1 is an ordinary rectangularbeam,structure2isatrapezoidalbeam,andstructure 3 is a triangular beam(ultimate trapezoidal condition). Two elliptically profiled beams were also included in the studytofurtherinvestigatetheeffectonthebeamstrainifthe widthgeometryvarieselliptically;theyarestructures4and5,which have convex and concave edge profiles,respectively. If a line along the beam length is drawn through the center line of the beam surface perpendicular to the fixed end,then the strain values at all points on the center line(shown only in structure 3 but applying to all structures in Fig.3)can be considered and plotted.All tested structures are fixed on one side while a constant tip force is applied at the free end.For thepurposesofthesecalculations,itisassumedthatthebeam length,L,andheight,h(notshowninthefigure),aresetat30 and 2mm,respectively.The width dimensions of the beam ends for all the tested structures are summarized in Table 1.
Due to the differences in the beam profiles given in Fig.3,the strains in the beams for a given load are not directly comparable.Hence,to normalize all the relative strains from the different structures,the ratio of relative strain values ateachpointalongthecenterlinetothemaximumstrainofthat particularstructureisconsideredinthecomparison.Thisisto ensure that all results computed from the different geometric structures are normalized and comparable regardless of the differences in geometric parameters.The normalized strain for a given point on a beam can be given as
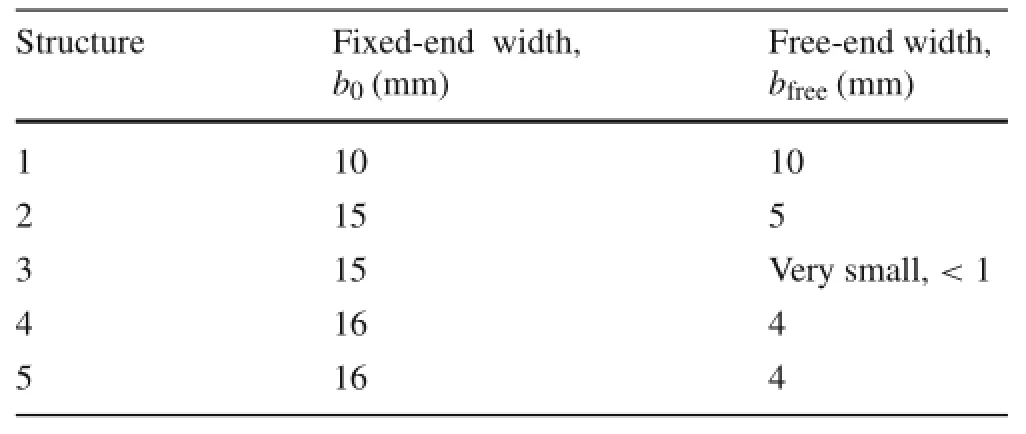
Table 1 Fixed-and free-end width dimensions for different beam geometric structures

Fig.3 Different geometric shapes of cantilever beams under investigation

where x is the position along the beam structure,ε(x)is the relative strain at position x,and εmis the maximum relative strain in that particular beam structure.Equation(6)is then used as an analytical model to compute the relative strain of the different beam geometries.
2.2 Results and discussion for analytical modeling
In this study,the relative strain on each node was computed analytically based on Eq.(6),and the normalized strains varied along the beam position(Fig.4).It is known that for one to extract the maximum output voltage from piezoelectric materials,the average strain in the entire beam across the width and length must be maximized to the value where the material encounters maximum strain,yet below the material breakage limit that will cause permanent damage to the beam.
For structure 1,an ordinary cantilever beam with a rectangular profile,it can be seen that the highest strain concentration is created at the fixed end where the bending moment,M,isatitsmaximum.However,thestraindecreases as the position x along the beam increases,which implies that,other than at the fixed end,most of the material elements on this beam are not stressed to their limit and,hence,loweroutputisexpected.Similarly,instructure2,anincreasingly triangular trapezoidal profile beam,the highest strain is created at the fixed end and decreases as the position x increases.However,in this structure,the rate of decrease of the normalized strains increases until the strain reaches zero at the free end of the beam.Thus,averaged over the length of thebeam,thisstructurewillhave higher normalized strain in the beam elements compared to structure 1.For the triangular geometry in structure 3,most of the beam elements are strained to a level that is very close to the material breakage limit,and a dramatic decrement occurs only in the region close to the free end of the beam.Hence,this strain energy plot is considered a close-to-perfect curve since the majority ofthematerialinthisbeamisstressedtotheleveljustslightly below the material failure limit,which could generate most output for the given volume of material.Furthermore,for the profile of structure 4,the average strain for this beam is slightlygreaterthanthecurve,asprovidedbystructure1,but less than the ideal curve,as provided by structure 3.Finally, for structure 5,it can be seen that the highest strain concentration is not created at the fixed end as in the other four tested structures but instead forms in the intermediate region of the beam length.This structure shows a greater average strain curve than any other structures in this study,except for the profile in structure 3.It is also noteworthy that elliptical beams,such as structures 4 and 5,are more difficult to fabricate than a trapezoidal beam configuration,such as structures 2 and 3.Hence,better average strain curves can be achieved using structure 3 and yet at lower fabricating cost.
Figure4showstherelativenormalizedstraincurvesalong the center line for various beam profiles.However,it is the volume of material experiencing a particular strain that is of interest.This can be estimated by assigning the normalized strains obtained from the center line of the beam to the entire widthofthebeamattheparticular x value(assumingthatthe strain across the width of the cantilever beam is constant). Then the general equation of the total nodes available across the beam width at x for those tested structures can be given as

where the b(x)is the beam width of the tested structure at x andbfree(3)isthefree-endwidthinstructure3(smallestbeam widthamongthetestedstructures).Theparticularnormalized strain,εn(x),can be obtained using Eq.(6),and the value is then assigned to all the available nodes determined from Eq.(7)for the given x position.By taking the sum of the total nodes available across the beam width for the entire x positionsalongthecantileverlength,thetotalavailablenodes in a particular structure can be determined by

The values of normalized strain assigned to all the nodes in the structures may conveniently be visualized as histogram plots with an equally split set of bins.The data are normalized into the number of nodes as a percentage by Np(#)=(N#/NT)×100%,as given in Fig.5,where the N#is the number of nodes available in that particular bin for #=0,0.05,0.1,...,0.95,1.The percentage of nodes for the five tested structures are summarized in Table 2.Only nodes having a normalized strain larger than 0.5[Np(>0.5)]and 0.75[Np(>0.75)]are considered.
From Fig.5 it can be observed that structure 1 has almost an equal proportion of nodes at each bin level,meaning that the structure has a nonuniform strain distribution along the cantilever beam.Followed by structure 2,the number of nodes increases as the normalized strain goes from a lowerto a higher strain,meaning the majority of available nodes are highly(>0.5)strained in this structure.For structure 3,it shows an almost perfect strain distribution across the beam,withalmostalltheavailablenodeshighlystrainedatthehighest level of the bin.For the elliptically shaped structure 4,most of the available nodes are distributed around the middle ranges of the normalized strain.Lastly,for structure 5,though most of the available nodes are highly strained,it is still less efficient than structure 3.Table 2 clearly indicates that structure 3 gives the best strain distribution among the tested structures(Fig.3)since the available nodes in this structure are strained at the normalized strain level,which is greater than 0.5 and 0.75.Although structure 5 does give a large strain distribution compared to structures 1,2,and 4,thisellipticalbeamconfigurationismoredifficulttofabricate thanstructure2or3.Furthermore,structure3stillprovidesa larger number of nodes that are strained at the highest strain level.
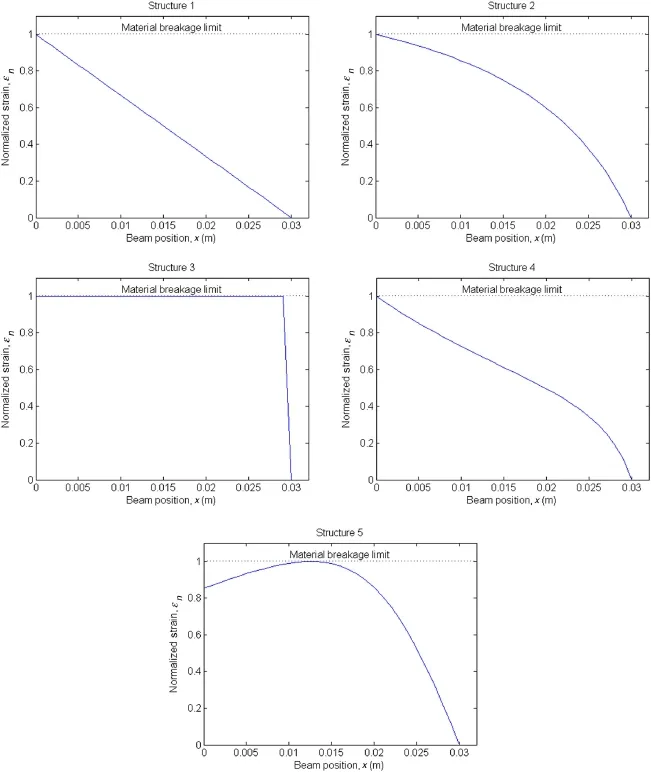
Fig.4 Normalized strain(analytical)along center line of various tested beam shapes

Fig.5 Histogram plots(analytical)for number of nodes against various values of normalized strain
3.1 Model
In the previous analytical modeling,the strain was assumed to be constant across the width of the cantilever beam,but practically this is not the case.Hence,in this section, modeling is carried out on similar structures(Fig.3)using the ANSYS structural static stress analysis tool to compare the strain distribution for a single-layer piezoelectric(PZT-5A4E)cantilever beam.The Young’s modulus and Poisson’s ratio for the material used in the beam are given as 66 N·m-2and 0.31,respectively.Like the analytical modeling,all the tested structures are fixed on the left end,but now with the tip mass represented as a block of material(10mm×5mm×2mm)attached at the free end of the cantilever.Aconstantforceisthenappliedonthestripedsurface of the block,as illustrated in Fig.6.All the structures under test are discretized(meshed)with a fixed element size of1mminlength(Fig.7).Finally,thelocationoftheblockof tip mass on each structure is indicated by the dashed lines in Fig.7.

Table 2 Number of nodes with normalized strain(analytical)bigger than 0.5 and 0.75 for beams under test

Fig.6 Tip mass block with a constant force on striped surface
By applying a fixed force to all the structures on the tip mass,which is placed at the free end of each structure,the strain distribution for these beams can be computed using the ANSYS tool as given in Fig.8.The color tones on each structure indicate the strain level at that particular point.To obtain pragmatic strain outputs from these structures,one should carefully select the applied force so that the highest strain in the material of the structure is limited below the material breakage limit.Because the maximum strain for every structure is altered when the geometry changes,it is necessary to normalize the strain for a given point obtained from the beam according to Eq.(6).The normalization is to ensure that all data obtained from the various geometries are comparable not only within this model but also with those obtained from the previous analytical model,as discussed in Sect.2.
3.2 Results and discussion for finite-element modeling
From Fig.8 it can be seen that the strain distribution on each structure varies when the beam geometry changes and is not uniform across the beam width,as was assumed in the previous analytical model.However,it is difficult to determine which structure provides the best strain distribution by just observing the color tone(red means highly strained zone,blue means the opposite).Hence,to make this finite-element model comparable with the previous analytical model,the relative strain along the beam center line(see Fig.3)and the histogram based on the number of nodes against various values of normalized strain bins are plotted in Figs.9 and 10,respectively.Because the strain across the width of the cantilever is no longer constant in each geometry,as computed by ANSYS analysis,the data presented in Figs.9 and 10 are more variable than those obtained from the analytical model and shown in Figs.4 and 5.
Despite the variability of the data from the structural analysis,both finite-element analysis and analytical data are similar in their behavior.The trend of the curves in Fig.9 and the histogram plots in Fig.10 can be compared with those obtained analytically in Figs.4 and 5.Note that in this strain distribution study,the ANSYS structural study is a more precise model that considers all the nonuniform strain distributions in each structure compared to the analytical model computed using the MATLAB solver,which assumed that the strains are constant across the width of the beamlength.Althoughitismathematicallypossibletomodel the strain distribution without analytically making any constant strain assumption,this would add complexity to the calculation in the model,and the ANSYS structural analysis method may be considered more effective and less time consuming.
From the data given in Fig.8,it can be seen that there are regions of beam material that are highly strained at the positions next to the fixed end in each structure.Similarly,in Fig.9,the normalized strain plots show that all the tested structures have a spike approximately at the beam position x≈1mm,which implies a high stress concentration at that beam section.In practical terms,this reduces the maximum strain,which can be applied to each structure before the material breakage limit is reached.In structure 5,the stress concentration in the middle section of the beam seems to be higher than that near the fixed-end section;however,this kind of strain distribution pattern will result in beam failure if an average strain of the beam is the main concern because the strain in the beam will exceed the material breakage limit if the average strain is pushed to the limit.
Similarly to the analytical model,the percentage of the nodes having a normalized strain larger than?and 0.75[Np(>0.75)]in the five tested structures are summarized in Table3.Although the overall percentages shown in this table are lower than those in Table2,they are similar in behavior.From Figs.9 and 10 it can be noticed that structure5iscomparabletostructure3intermsoftheiraverage strain in the beam.However,Table3 clearly indicates that structure 3 still gives the best average strain distribution according to the percentage of nodes.It consists of 79.33%of the nodes having a normalized strain,which is greaterthan0.5and63.37%ofthenodeshavinganormalized strain,which is greater than 0.75.This clearly demonstrates that structure 3 is still the most efficient structure in terms of maintaining the optimum average strain in the material across the beam.Furthermore,it is also more cost effective to fabricate a triangular structure than an elliptical beam structure,whichcouldcomewithvariousellipticalgeometric profiles.
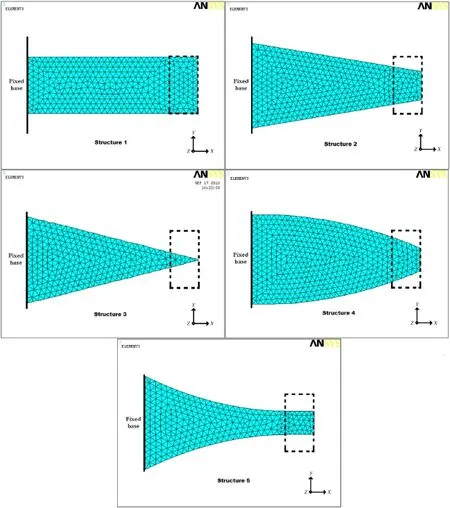
Fig.7 Discretization of tested beam structures

Fig.8(Color online)ANSYS structural analysis of tested beam structures
4 Experimental results
According to both the aforementioned analytical and finiteelement model outputs,structure 3 is the most highly strainedandcost-effectivegeometryforuseinapiezoelectric cantilever-based energy harvesting system.Because of the good agreement between the analytical and finite-element outputs,this demonstrates the reliability of both models. In addition,it is also costly and difficult to cut the piezoelectric material manually into an elliptical shape without breaking the piezoelectric elements.Piezoelectric material is best cut using a special diamond saw;however,even with practice this method still produces destructive cuts to the parts,which may affect the behavior of the beam.Hence,in this section,only an actual output power from a conventional rectangular beam(structure 1)will be compared with the output from a triangular beam(structure 3);it is believed that these models will provide sufficient validation for other structures.
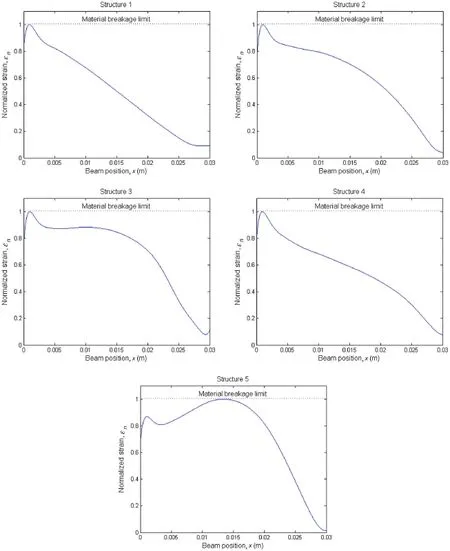
Fig.9 Normalized strain(finite element)along center line of various tested beam shapes
Piezoelectric bimorph actuators from Piezo System Inc. MA,USA are used in this experiment.Each beam consists of a layer of brass sandwiched between layers of PZT-5A4E material.Figure11 shows the rectangular bender beam and a smaller bender beam that is carefully cut into triangular shape from a square beam.The control system setup for this experiment is shown in Fig.12.Both beams were mountedonavibrationshaker(LDS-V406/8)thatwasdriven by a range of driving frequencies from 40 to 60Hz at an acceleration amplitude of 0.5g.To determine the maximum available power that can be delivered to the load,both beam outputs were connected to their optimum matched resis-tances,which were experimentally determined to be 71 and 22kΩ for the triangular and rectangular benders,respectively.The outputs from the prototypes were recorded and analyzed using a data acquisition adapter(ADLINK DAQ-2205).The generated power was then computed as P= V2/R,where V is the peak voltage transferred to the resistive load for the system R,and the output response of the power against the sweep driving frequencies is plotted as in Fig.13.
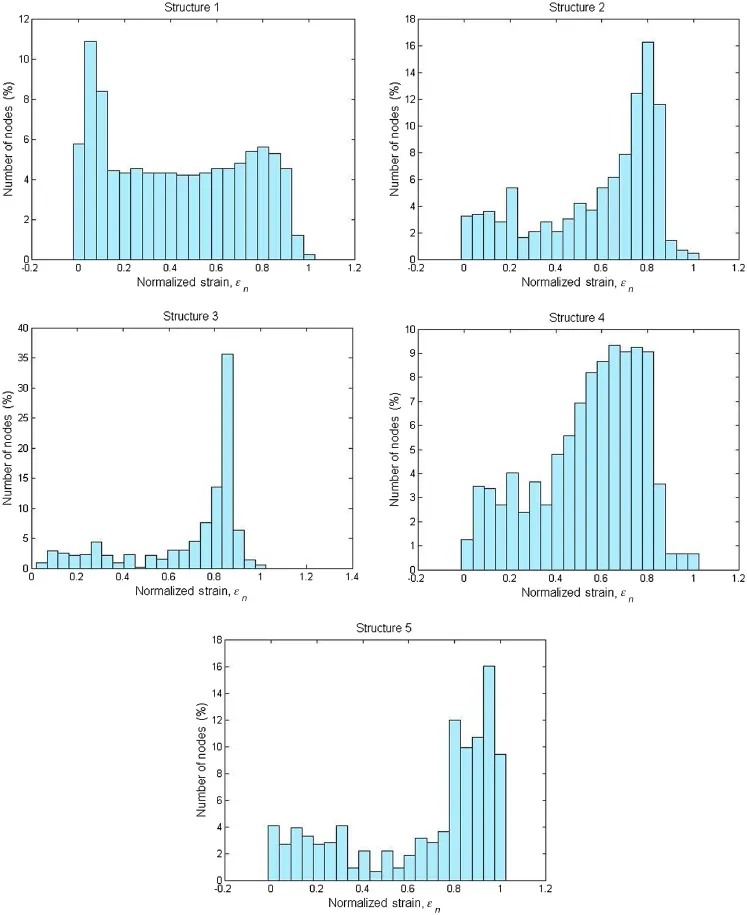
Fig.10 Histogram plots(finite element)for number of nodes against various values of normalized strain

Table 3 Number of nodes with normalized strain(finite element)greater than 0.5 and 0.75 for tested beams

Fig.11 Rectangular and triangular benders

Fig.12 Experimental setup of a vibration shaker system
Figure13aillustratestherecordedoutputsfrombothtriangular and rectangular beams.It indicates that the maximum power recorded from the rectangular beam is higher than the output recorded from the triangular beam.The rectangular and triangular beams produce 1.58mW at 43.7Hz and 0.23mW at 45.5Hz,respectively,which contrast with the finding in the aforementioned analytical and finiteelement models,suggesting that a triangular beam is a better beam structure for an energy harvesting system.However,this contrast is due mainly to the difference in the size of the piezoelectric bimorph actuators used in the experiment.Comparing the power density for the two cantilevers,whichhaveeffectivematerialvolumesof721.7mm3(44.5×31.8×0.51)and 56.1mm3(0.5×20×11×0.51),respectively,results in the frequency responses shown in Fig.13b.After normalizing the output power,the triangular beam is seen to record a higher output power density than the rectangular beam.The peak normalized power densities(NPDs)are obtained as 2.19 and 4.05µW/mm3for the rectangular and triangular beams,respectively,which is in agreement with the findings of the analytical and finiteelement models,meaning the triangular beam will produce higher output power than the rectangular beam.To further clarify the comparison,Table4 summarizes the maximum output power,beam volume,and NPD of both beams tested in this experiment.Roundy et al.[11]claimed that with the same volume of PZT and an increasingly triangular trapezoidal beam profile,the strain distribution can be made more even.Hence,an ultimate trapezoidal beam geometry(triangle)can produce twice the power(per unit volume of PZT)as the conventional rectangular beam geometry.However,less than twice the energy was obtained in this experiment(4.05/2.19=1.85).Thismaybearesultoftheimperfection of the triangular profile of the structure during the shearing process,which was completed manually instead of by using a machine.

Fig.13 Comparison of output from rectangular and triangular beams.a Initial.b Normalized output power

Table 4 Summary of comparison between triangular and rectangular beams
5 Conclusion
This paper presents a strain distribution analysis of five cantilever structures that come with different geometric configurations,including elliptically profiled beams never before considered in the literature.Analytical and finiteelement models of the tested structures were implemented in the MATLAB solver and ANSYS finite-element analysis,respectively.All the strain values on the investigated nodes from each structure were computed and normalized so that the results obtained from different sets of models could be compared and the structure with the greatest averagestraindetermined.Theresultsrecordedfrombothmodels are comparable with respect to their behavior:both models suggestedthatatriangular(structure3)cantileverbeamisthe best geometry in terms of improving the output power for a vibration-basedenergyharvester.Thetriangularstructurenot only maximizes the material average strain for a given input but also improves robustness by reducing the stress concentration on the cantilever beam.With this improvement,both the size and the cost of a system can be greatly reduced. Although the results show that a concave elliptical profiled beam(structure 5)looks very promising in terms of its output power compared to any of the other tested structures,numerical tabulation still shows that structure 3 gives the best average strain distribution according to the percentage of the nodes,thereby filling a gap in the literature,leading to the conclusion that a triangular beam is still better than an elliptical profiled beam,but such a beam was not consideredinanypreviouslypublishedstudies.Inaddition,thecost of fabricating a triangular structure can be relatively lower compared to the shape of an elliptical beam structure that is more complex.Lastly,this finding is also supported by the experimental outcome,which clearly proved that a triangular geometry can definitely produce a greater NPD than an ordinary rectangular geometry.A roughly 85%power density improvement is achieved,as recorded from the triangular beam compared to a conventional rectangular beam,as a result of the greater average strain in the beam material.
Acknowledgments The authors would like to thank all the involved institutions of higher learning,including the University of Hull and Universiti Teknologi Petronas for their facilities and equipment support.This research was supported by the Fundamental Research Grant Scheme FRGS/1/2014/TK03/QUEST/03/1 from the Ministry of Education(MoE)Malaysia.
References
1.Tang,L.,Yang,Y.,Soh,C.K.:Toward broadband vibration-based energy harvesting.J.Intell.Mater.Syst.Struct.21,1867-1897(2010).doi:10.1177/1045389X10390249
2.Meninger,S.,Mur-Miranda,J.O.,Amirtharajah,R.,et al.: Vibration-to-electric energy conversion.IEEE Trans.Very Large Scale Integr.(VLSI)Syst.1,64-76(2001)
3.Ooi,B.L.,Gilbert,J.M.:Design of wideband vibration-based electromagneticgeneratorbymeansofdual-resonator.Sens.Actuators A 213,9-18(2014).doi:10.1016/j.sna.2014.03.037
4.Wang,L.,Yuan,F.G.:Vibrationenergyharvestingbymagnetostrictive material.Smart Mater.Struct.17,45009(2008)
5.Wang,W.,Huang,R.J.,Huang,C.J.,et al.:Energy harvester array using piezoelectric circular diaphragm for rail vibration.Acta Mech.Sin.30,884-888(2015).doi:10.1007/s10409-014-0115-9
6.Priya,S.,Inman,D.J.:Energy Harvesting Technologies.Springer,New York(2009).doi:10.1007/978-0-387-76464-1
7.Hu,H.,Xue,H.,Hu,Y.:Aspiral-shapedharvesterwithanimproved harvesting element and an adaptive storage circuit.IEEE Trans. Ultrason.Ferroelectr.Freq.Control 54,1177(2007).doi:10.1109/ TUFFC.2007.371
8.Jeon,Y.,Sood,R.,Jeong,J.H.,et al.:MEMS power generator with transverse mode thin film PZT.Sens.Actuators A 122,16-22(2005).doi:10.1016/j.sna.2004.12.032
9.Karami,M.A.,Inman,D.J.:Parametricstudyofzigzagmicrostructure for vibrational energy harvesting.J.Microelectromech.Syst. 21,145-160(2012).doi:10.1109/JMEMS.2011.2171321
10.Shindo,Y.,Narita,F.:Dynamic bending/torsion and output power of S-shaped piezoelectric energy harvesters.Int.J.Mech.Mater. Des.10,305-311(2014).doi:10.1007/s10999-014-9247-0
11.Roundy,S.,Leland,E.S.,Baker,J.,et al.:Improving power output forvibration-basedenergyscavengers.IEEEPervasiveComput.4,28-36(2005).doi:10.1109/MPRV.2005.14
12.Jiang,S.,Li,X.,Guo,S.,et al.:Performance of a piezoelectric bimorph for scavenging vibration energy.Acta Mech.Solida Sin. 20,296(2005)
13.Ly,R.,Rguiti,M.,Dastorg,S.,etal.:Modelingandcharacterization of piezoelectric cantilever bending sensor for energy harvesting. Sens.Actuators A 168(1),95-100(2011).doi:10.1016/j.sna.2011. 04.020
14.Pan,C.,Liu,Z.,Chen,Y.:Study of broad bandwidth vibrational energyharvestingsystemwithoptimumthicknessofPETsubstrate. Curr.Appl.Phys.12,684(2012).doi:10.1016/j.cap.2011.10.005
15.Shen,H.,Ji,H.,Qiu,J.,et al.:Adaptive synchronized switch harvesting:anewpiezoelectricenergyharvestingschemeforwideband vibrations.Sens.Actuators A 226,21-36(2015).doi:10. 1016/j.sna.2015.02.008
16.Thein,C.K.,Ooi,B.L.,Liu,J.S.,etal.:Modellingandoptimisation of a bimorph piezoelectric cantilever beam in an energy harvesting application.J.Eng.Sci.Technol.11,212-227(2016)
17.Muthalif,A.G.,Nordin,N.D.:Optimal piezoelectric beam shape for single and broadband vibration energy harvesting:modeling,simulation and experimental results.Mech.Syst.Signal Process. 54-55,417-426(2015).doi:10.1016/j.ymssp.2014.07.014
18.Friswell,M.I.,Adhikari,S.:Sensor shape design for piezoelectric cantilever beams to harvest vibration energy.J.Appl.Phys.108,014901(2010).doi:10.1063/1.3457330
19.Basari,A.A.,Awaji,S.,Wang,S.,et al.:Shape effect of piezoelectric energy harvester on vibration power generation.J.Power Energy Eng.02,117-124(2014).doi:10.4236/jpee.2014.29017
20.Ayed,S.B.,Najar,F.,Abdelkefi,A.:Shapeimprovementforpiezoelectric energy harvesting applications.In:2009 3rd International Conference on Signals,Circuits and Systems(SCS),IEEE,1-6(2009).doi:10.1109/ICSCS.2009.5412553
21.Mateu,L.,Moll,F.:Optimum piezoelectric bending beam structuresforenergyharvestingusingshoeinserts.J.Intell.Mater.Syst. Struct.16,835-845(2005).doi:10.1177/1045389X05055280
22.Roundy,S.:Energy scavenging for wireless sensor nodes with a focus on vibration to electricity conversion.[Ph.D.Dissertation],University of California,Berkeley(2003)
23.Benham,P.P.,Crawford,R.J.,Armstrong,C.G.:Mechanics of Engineering Materials,2nd edn.Prentice Hall,Englewood Cliffs(1996)
24.Negahban,M.:Pure Bending.Retrieved from http://emweb. unl.edu/NEGAHBAN/Em325/11-Bending/Bending.htm (2000). Accessed 29 March 2016
28 September 2015/Revised:14 December 2015/Accepted:4 January 2016/Published online:9 May 2016
- Acta Mechanica Sinica的其它文章
- Delayed detached eddy simulations of fighter aircraft at high angle of attack
- Plate/shell topological optimization subjected to linear buckling constraints by adopting composite exponential filtering function
- Numerical simulations of the process of multiple shock-flame interactions
- The comparative analysis of rocks’resistance to forward-slanting disc cutters and traditionally installed disc cutters
- Modal parameter identification of flexible spacecraft using the covariance-driven stochastic subspace identification(SSI-COV)method
- New method for oblique impact dynamics research of a flexible beam with large overall motion considering impact friction force

