Delayed detached eddy simulations of fighter aircraft at high angle of attack
Guoliang Xu·Xiong Jiang·Gang Liu
Xiao-Yu Sun1,2·Yi-Zhou Qi1·Wengen Ouyang1·Xi-Qiao Feng1,3· Qunyang Li1,3
RESEARCH PAPER
Delayed detached eddy simulations of fighter aircraft at high angle of attack
Guoliang Xu1·Xiong Jiang1·Gang Liu1
©The Chinese Society of Theoretical and Applied Mechanics;Institute of Mechanics,Chinese Academy of Sciences and Springer-Verlag Berlin Heidelberg 2016
Themassivelyseparatedflowsoverarealisticaircraft configuration at 40◦,50◦,and 60◦angles of attack are studiedusingthedelayeddetachededdysimulation(DDES). The calculations are carried out at experimental conditions correspondingtoameanaerodynamicchord-basedReynolds number of 8.93×10⁵and Mach number of 0.088.The influenceofthegridsizeisinvestigatedusingtwogrids,20.0×106cells and31.0×106cells.Attheselected conditions,thelift,drag,and pitching moment from DDES predictions agree withtheexperimentaldatabetterthanthatfromtheReynoldsaveraged Navier-Stokes.The effect of angle of attack on the flow structure over the general aircraft is also studied,and it is found that the dominated frequency associated with the vortex shedding process decreases with increasing angle of attack.
Realistic aircraft·Massively separation· Delayed detached eddy simulation
1 Introduction
High angle of attack(AOA)maneuvering referred to as“super-maneuverability”is often encountered during combat.It is very important to promote the ability for increased speed and maneuverability in the development of fighter aircraft,and incorporating a chined fuselage/delta wing is usually adopted in the modern aircraft designs,which can exhibit strong fore-body and wing leading-edge vortices.It hasbeenrealizedthattheaerodynamiccharacteristicsofmilitary aircraft depend on these vortex interactions at large angles of attack,since this vortex wake can become asymmetricdownstream,leadingtoabruptlyaerodynamicloading such as significant pitch-up and unpredictability nonlinearities in the lateral stability.More details about this can be found in the literature[1],but up to now,the exact physical mechanismsontheabruptasymmetricvortexbreakdownare still not well known.
Many experiments have been performed to study the vortex interactions induced by the chined fuselage/delta-wing configurations[2,3].In a low speed experiment,Erickson and Brandon[2]investigated asymmetric vortex breakdown characteristics of a general research fighter model,and they found that the concentrated vortex on the windward side was effectively excited and sustained by the blended fore-body geometry at large angles of attack and sideslip.The authors confirmed that the sideslip angle was an important parameter determining fore-body vortex breakdown at high angles of attack.LeMay and Rogers[3]experimentally studied the effects of fore-body blowing on the vortex interaction;they observed that the wing and chine vortices could be decoupled by incorporating asymmetric blowing.Moreover,the unsteadyaerodynamicsathighlymaneuveringmodifiedF-18 aircraft were also investigated in the full scale wind tunnel at NASAAmesResearchCenter[4-6].Itwasseenthatthevortex breakup position from the flight test agrees well with the experimental data in both wind and water tunnels,although the flight Reynolds number was one order of magnitude higher than that in wind and water tunnels.In the following,the roll dynamic of an X-31 at large angles of attack was investigated by Alcorn et al.[7],who found that the forebody vortices became asymmetric,and a strong interaction offore-bodyvortices/wingoccurredleadingtorolldeparture.
EmployingtheEulerequationsandtheunsteady Reynolds-averaged Navier-Stokes(RANS)equations based on the Baldwin Lomax turbulence model,respectively,Ravi and Mason[8]studied the directional stability of an isolated fuselage at high angles of attack and sideslip.An analytical approach was also proposed and developed for analyzing the fore-body aerodynamics for a family of fore-body cross sections.In addition,the influence of tangential slot blowing on the aerodynamic characteristic of an isolated chined fore-body was also investigated by Greeman et al.[9]with the thin-layer Reynolds-averaged Navier-Stokes equations. Indeed,in order to predict correctly the vortex breakdown phenomenon,the turbulent kinetic energy induced by the vortex breakdown process should be modeled accurately. Without doubt,the most common numerical approach for predicting the turbulent flows in engineering is the RANS model.In order to promote the ability of the RANS model in simulating the separated flow,an improvement for the algebraic turbulence model was proposed by Degani and Schiff[10],and a better prediction of the separated flow wasobtained.Amodificationfortheoneequationturbulence model was also developed by Gee et al.[11]to predict the vortical flow.Furthermore,Dacles et al.[12]also proposed a new version of the k-ε turbulence mode for predicting the vorticalflowsuchasthewingtipvortex.However,ithasbeen recognizedthatRANSmodelisinadequateforthemassively separated flows as it is built on the steady state equilibrium assumption.Moreover,almostallpopulareddy-viscosityturbulencemodelssuchastheShearStressTransport(SST)and Spalart and Allmaras(SA)models produce too much turbulent eddy viscosity in the primary vortex core region,which fundamentallyalterstheflowfield,andthusnovortexbreaking down phenomenon exists in the numerical results.As we know,the large eddy simulation method(LES)is a powerful tool for predicting the unsteady and non-equilibrium turbulent flows.In the LES method,the large scale turbulent motions are resolved and the smallest scales are modeled.The use of LES for these flows such as massive separation,which RANS models cannot deal with,has been popularized with the help of increasing computing power. However,almost similar grid numbers as direct numerical simulation(DNS)mustbeappliedforLESforwall-bounded boundary layer flows at high Reynolds number.Consequently,theapplicationofLESremainsachallengingtaskin engineering.
Inrecentyears,anoticeableprogresshasbeenapproached indevelopinghybridRANS/LESmodels,inwhichtheRANS modelisusedwheretheflowisattachedandtheLESmodelis appliedinthemassivelyseparatedflowregion.Thedetached eddysimulation(DES)methodmaybethetopicofextensive research and the widely used approach,which was proposed by Spalart et al.[13],and it was applied successfully in the simulation of flows over a realistic aircraft configuration. For instance,the massively separated flows over F-15E at an AOA of 65◦was calculated by Forsythe et al.[14,15]using the methods of RANS,URANS,and DES,respectively.In the computations,neither RANS nor URANS methods can capture any significant unsteady phenomena.Apparently,a wider range of turbulent scales and the vortex breakup process could be captured by the part of LES in the DES approach,andtheforcecoefficientsfromDESagreewiththe flight-test data much better than that of the RANS.Forsythe and Woodson[16]also studied the transonic shock motion on the F/A-18E using the DES approach,and a significant improvement in predicting the unsteady pressures on the surface was obtained by the DES in comparison with the URANSmethod.Furthermore,Mortonetal.[17,18]investigated the flow-field over F18-C aircraft at an angle of attack of30◦usingtheSA-RANS,SA-URANS,andSA-DESmethods,respectively.TheyalsofoundthatURANScomputations didnottriggeranyvortexbreakdownphenomena.Compared withtheURANSresults,theliftcoefficientandvortexbreakdown position were more accurately predicted by SA-DES,which was consistent with the experimental data.
Unfortunately,there are still some flaws in the DES method.For instance,both modeled stress depletion and grid induced separation(GIS)[19]are expected to occur in the DES approach when the wall parallel grid spacing is much smaller than the boundary layer thickness,and premature separation will be produced by GIS.To overcome the deficiency,new versions of DES,such as DDES based on the SST and SA turbulent model,were proposed and developed by Menter et al.[19]and Spalart et al.[20],respectively,by discounting LES acting in the boundary layer regions.Furthermore,Spalart et al.[20]advised that the formulation of DDES should be the new stand version in predicting the massively separated flow rather than DES.
In recent years,the DDES has been successfully applied by many groups in simulating the flow over simplified fighters.Forinstance,thenonlinearaerodynamiccharacteristicof agenericfighterwasinvestigatedbyJeansetal.[21,22]with DDES.In particular,more attention is certainly needed to verifyandvalidatefurthertheaccuracyofhybridRANS/LES methods such as DDES of predicting the separated flows over realistic aircraft in engineering.The literature on such studies about DDES in application is relatively sparse.In this work,the massively separated flows over a full aircraft at AOAs of 40◦,50◦,and 60◦are investigated by means of DDES formulation,the Reynolds number based on the mean-aerodynamic chord length is about 8.93×10⁵,and freestream Mach number is 0.088.A detailed comparison between the computational results and the experimental data is provided and discussed.
2 Numerical approach
2.1 Delayed detached eddy simulation based on the SST turbulence model
The delayed detached eddy simulation method based on the SSTtwo-equationmodelisadoptedheretosimulatethemassively separated flow over a full aircraft at high angles of attack.As we know,the SST turbulence model is a popular approach that has been widely used in engineering.The flow governed by the compressible and unsteady Reynoldsaveraged equations is solved here:
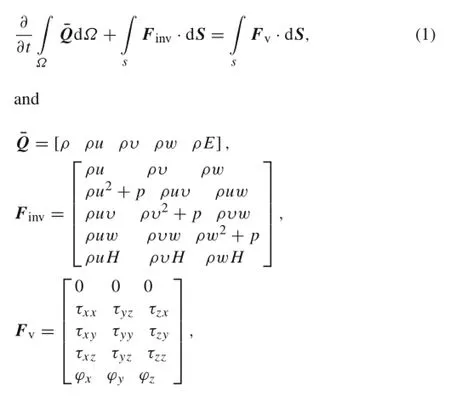
where ρ is the density,u,v,w represent the velocity along x,y,z directions,respectively,E and H denote the energy and enthalpy terms,respectively.Finvis the convective flux term,and Fvstands for the viscous flux term.
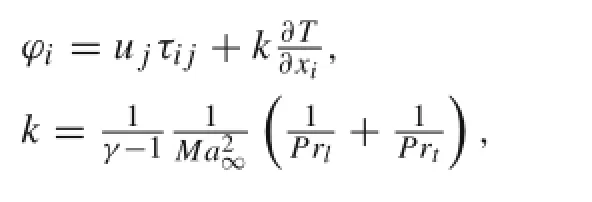
The laminar Prandtl number Prlis 0.72 and the turbulent PrandtlnumberPrtis0.90.Thelineareddy-viscosityconcept is applied to model the Reynolds stresses,thus

The resolved stress tensor Sijis given by
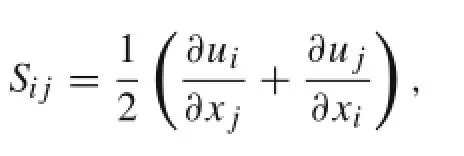
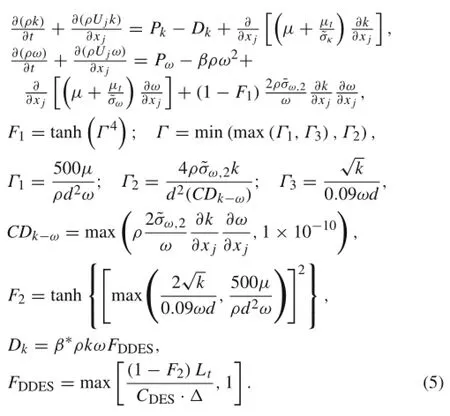
the turbulent viscosity μtcan be computed via the SST model,and the formulation of SST is written as follows[23]
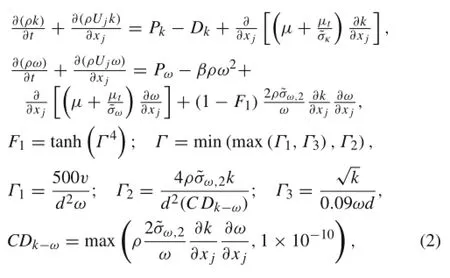
whered representsthewalldistance,andthedissipationterm in the turbulent kinetic energy transport equation is defined as
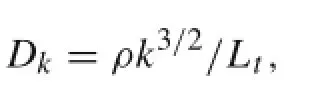
where Ltdenotes the turbulent length scale:

The SST-LES can be obtained by replacing the turbulent length scale in the SST model with the local grid spacing:

and the SST-DES length scale is given by

The version of DES based on the SST model was first proposed by Strelets[24],and the governing equations of SST-DES can be written as

As mentioned above,early separation would be created by GIS.For instance,the separated point on an airfoil trailing edge predicted by the SST-DES will move upstream compared to SST-RANS[25].To improve the SST-DDES approach,a modification was proposed by Menter et al.[19]using the SST-F2function as a shield function to delay the LES simulation in boundary layer region,then the new revision of SST-DDES method can be given as
2.2 Hybrid central/upwind numerical scheme
So far,upwind schemes have been widely and successfully used to discrete Euler fluxes of the Navier-Stokes equations in almost all commercial RANS solvers,but it must be a bad choice for LES since small turbulent scales are likely dissipated by the excessive numerical dissipation.In general,for the LES computations,high order schemes with low dissipation should be applied.However,it may be difficult to apply such high order schemes for complex configuration,for example,a realistic aircraft.In particular,most industry codes are built on a finite volume approach in order to deal with the severely distorted cells.Fortunately,previous work[26,27]pointed out that the centered scheme was also relevant for LES with a very fine grid,and a hybrid numerical scheme was proposed by Strelets[24]to approximate the inviscid fluxes Finv,which is given as

where Fctrand Fupwrepresent the convective fluxes discretized by the central(fourth order)and by the upwind(third/fifth order)scheme,respectively.The parameter φ as a blending function is calculated according to


where τ denotes the time scale.If the flow is separated(LES region),theadaptivefunctionφwouldequal1andthescheme canbeconvertedtothecenteredfourthorderone.Conversely,at the attached boundary layer regions or where the flow is irrotational,a fully upwind scheme can be attained when φ is set to 0.Similarly,in our house code,a cell finite volume method based on block structured grid is also applied to discretize the Navier-Stokes equations,the viscous flux is discretized by a second-order centered scheme[28]and the low Mach number preconditioning[29]coupled with a dual time-stepping scheme LU-SGS implicit method[30]is used in the solution of time integration.An upwind Roe scheme[31],combining the sixth-order symmetric scheme and the fifth-order weighted essential non-oscillating interpolation,is applied in the spatial approximation:

and the hybrid scheme had been successfully applied to simulate the massively separated flows by Xiao et al.[32,33].
3 Code validation
3.1 Computation of decaying homogeneous isotropic turbulence
Homogeneous isotropic turbulence,as a simple turbulent field,can be created by a uniform grid in the wind tunnel[34].No turbulent energy is produced and the turbulent kinetic decay with time as the viscous dissipation,so it is very popular to evaluate the decaying isotropic turbulence to validate the influence of numerical dissipation on the turbulent energy decay[24].In the current work,the governing equations(2)ofSST-LES,discretizedbythepuresixth-order centered scheme in spatial direction,is applied to calculate the evolution of homogeneous isotropic turbulence.In order to capture correctly the turbulent energy decay,the value of
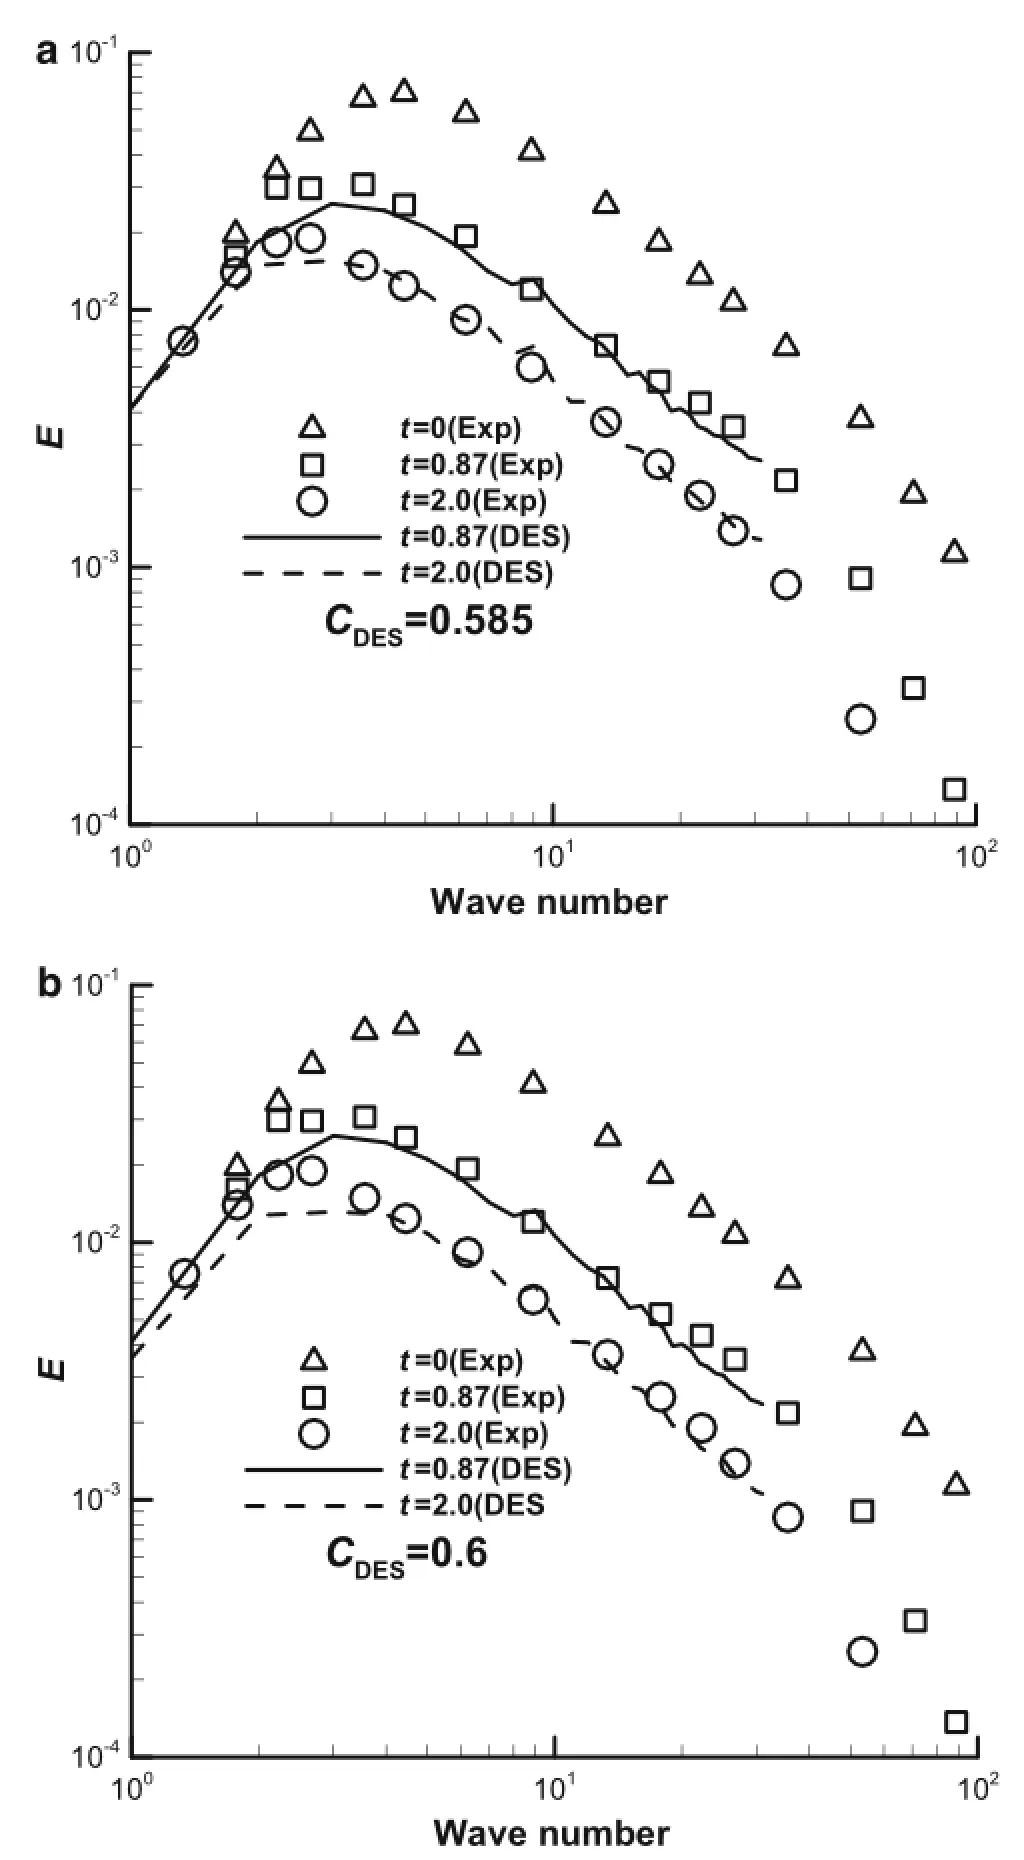
Fig.1 Time evolution of the turbulent kinetic energy spectra.a Based onthek-ε modelwithCDES=0.585.bBasedonthek-ω modelwith CDES=0.6
CDESshouldbecarefullycalibratedfirstly.AstheSSTmodel composites of k-ω model and k-ε model,Strelets[24]suggested that CDESin SST-DES model should be calibrated separately,and the F1function in SST model is adopted by Strelets as a switch function:

Employing 643cells to compute the evolution of homogeneous isotropic turbulence in the present work,Fig.1a,b displays the energy spectra at t=0.87 and t=2.0 based on the k-ε and k-ω model,respectively.When theis set to 0.585 and theequals 0.60,a good agreement
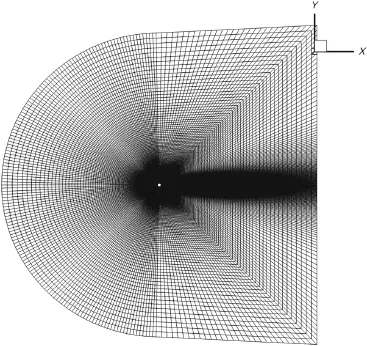
Fig.2 Computational grid used for DDES
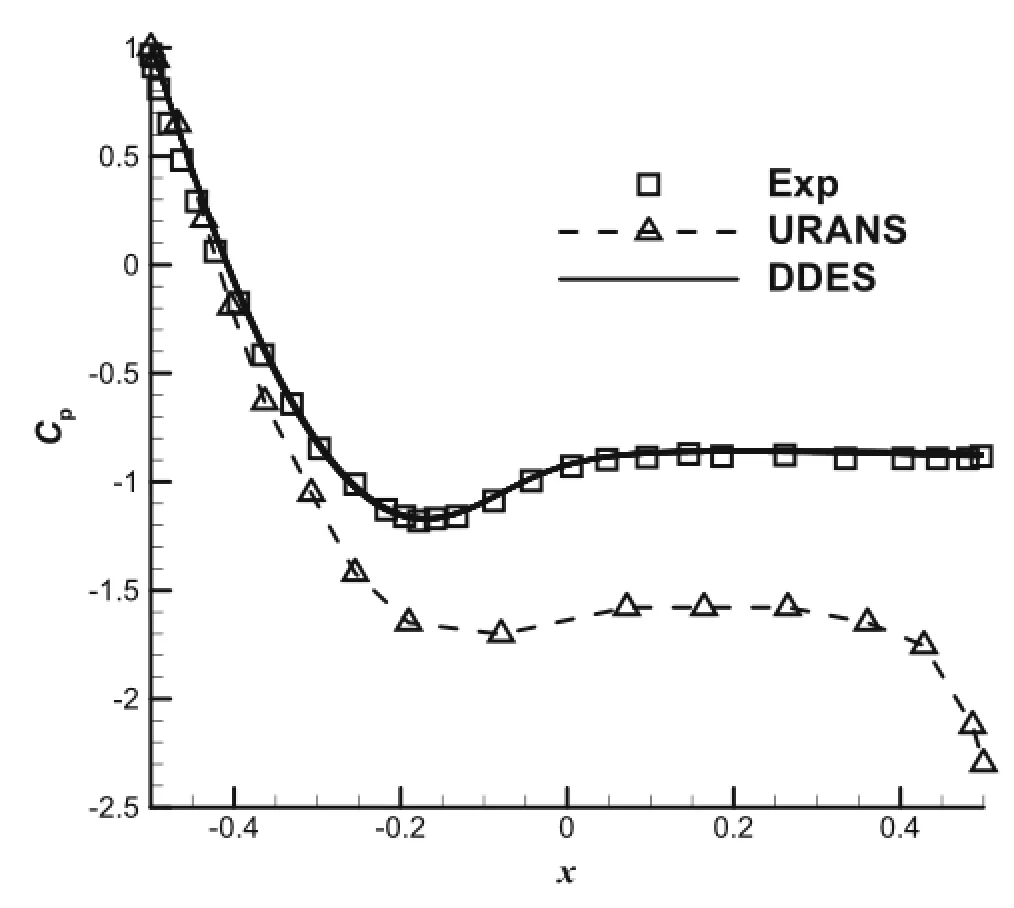
Fig.3 Pressure coefficient on the surface
with experimental data can be achieved and also validates the simulation capability of LES model in our house code.
3.2 Flow over a circular cylinder at ReD=3900
Simulation of flow over a circular cylinder at Reynolds number ReD=3900(D representsthecylinder diameter)isalso carried out by means of DDES,and the freestream Mach number is about 0.2.Fig.2 shows the O-type mesh with 3.0 million cells.A dense mesh is used in the wake region,and there are 201 and 245 points in the circumferential and radial directions,respectively.Periodic boundary conditions areappliedinthespanwisedirection,thewidthofthedomainis 2πD,and 64 grids are distributed in the spanwise direction.The comparison of pressure coefficient on the wall is shown in Fig.3,and it can be seen that the pressure coefficient on the surface computed on the basis of URANS and DDEarehighdifferent.TheDDESresultismuchbetterthan thatfromURANS.Thetime-averagedprofilesofstreamwise velocityandcrossflowvelocityfromDDESarealsoshownin Fig.4a,b,respectively.Agoodagreementcanbeobtainedin the comparison with the B-spline simulation of Kravchenko and Moin[26],especially at x/D=1.06,and a U-shaped profile for streamwise velocity u can be captured by the current DDES method.
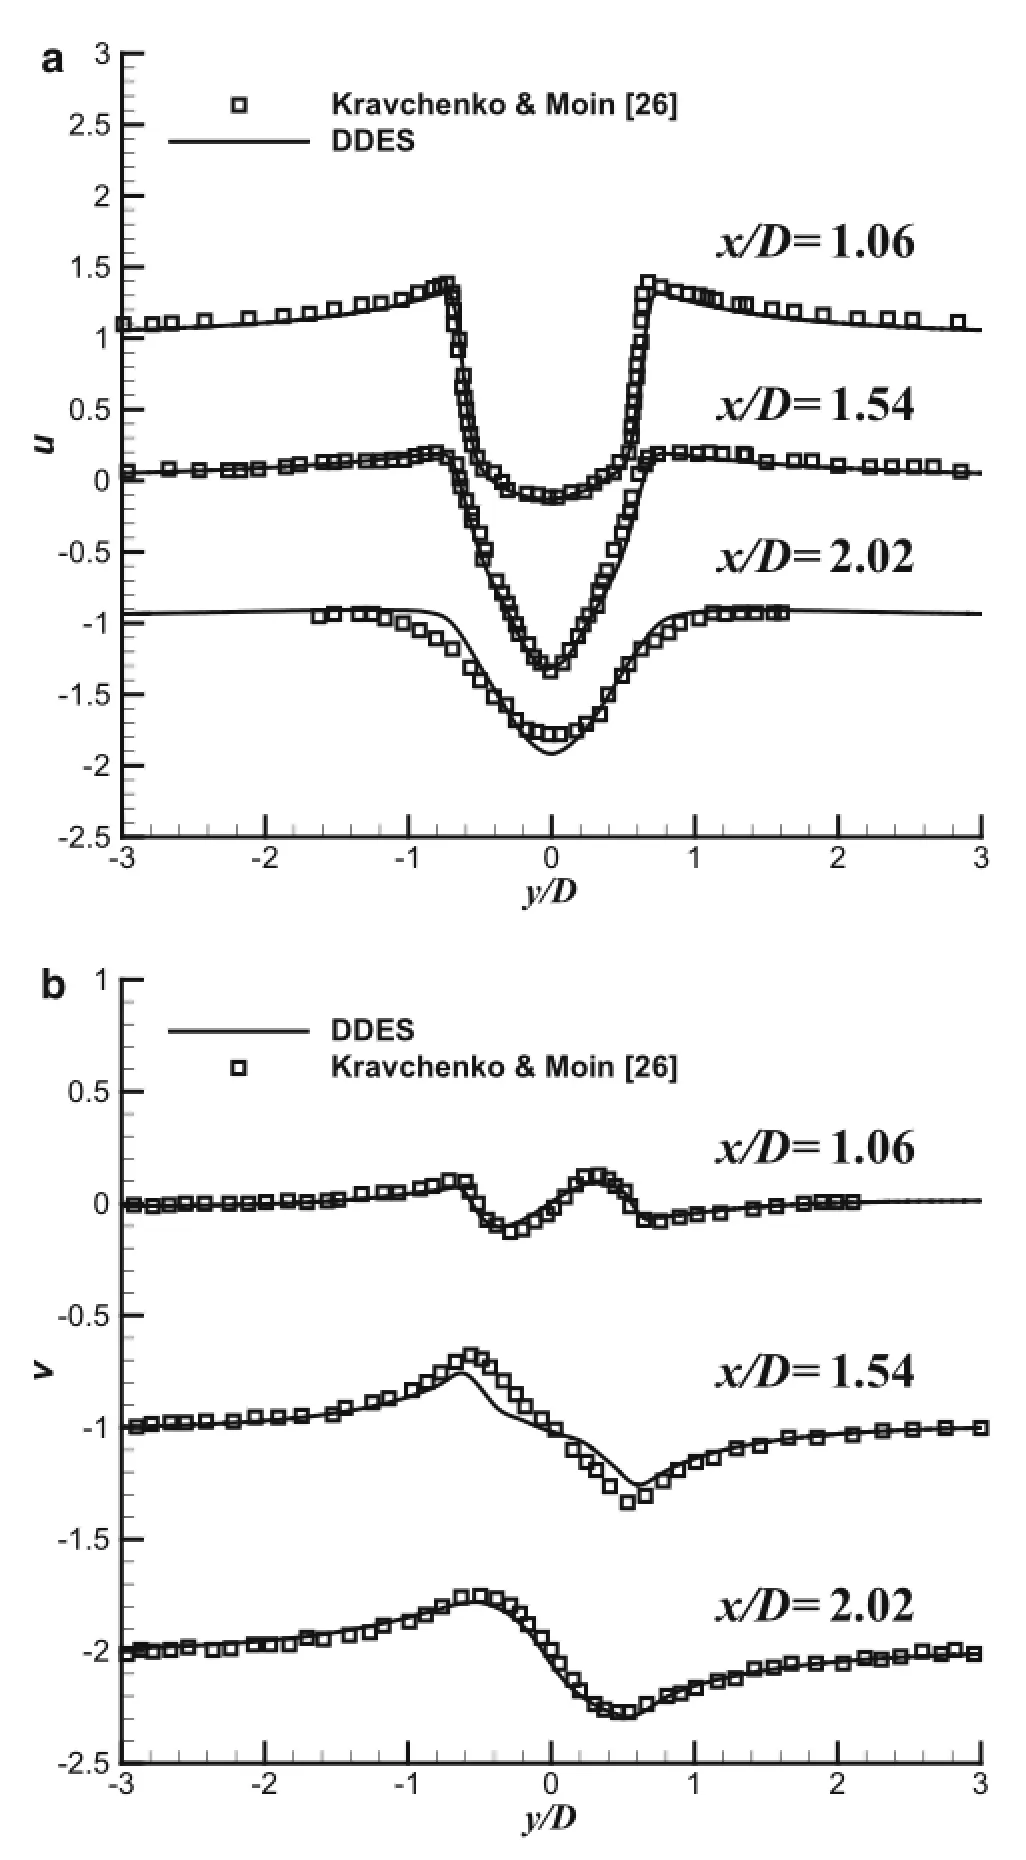
Fig.4 a Streamwisevelocityprofilesand bcrossflowvelocityprofiles at 3 stations in the wake of the cylinder at ReD=3900
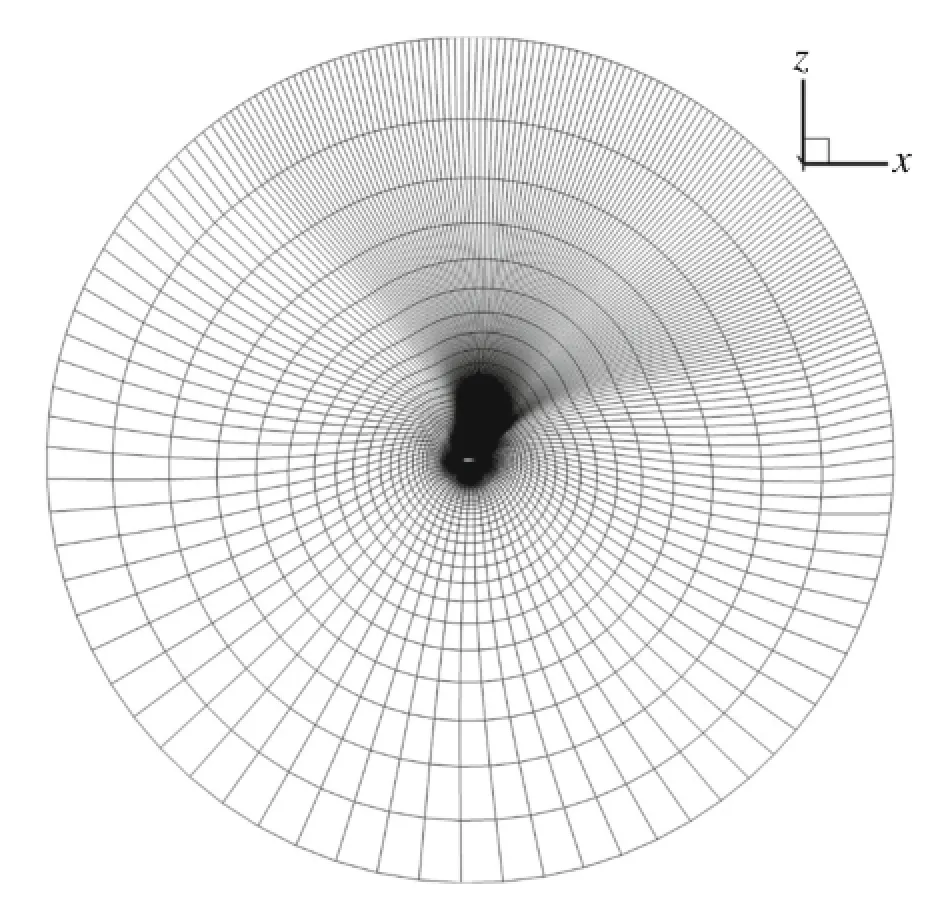
Fig.5 O-type grids for NACA0021 computation
3.3 NACA0021 airfoil at 60◦AOA
Flow over NACA0021 airfoil at a 60◦AOA has been studied extensively and numerically,as a standard case of the flows for the validation of DES model[35].The freestream Mach numberisabout0.2,theReynoldsnumberbasedonthechord lengthisabout2.7×105,andtheexperimentaldataincluding meanflowstatistics,lift,anddragtimehistoriesareavailable. Figure 5 shows the O-type grids for the DDES computation,thecomputationaldomaininthex-yplaneisabout30c×30c(c denotestheairfoilchordlength),and281gridsareapplied on the surface in the x-y plane.Furthermore,the spanwise domainis4×c,and65nodesaredistributed.DDEScalculation is carried out with the physical time step of 0.02 c/U∞. The instantaneous and time-averaged values of predicted lift and drag coefficients from DDES are compared with experimental data are displayed in Fig.6 and Table 1.Figure 7 shows the pressure coefficient on the airfoil surface.These results allow one to conclude that a high accuracy can be obtained by DDES within the experimental data.
4 Results and analysis
The massively separation flows over a realistic aircraft at 40◦,50◦,and 60◦AOAs are investigated here using the RANS,URANS,and DDES methods,which are also studied experimentally in the low speed wind tunnel of the China Aerodynamics Research and Development Center(CARDC).Thefreestream Mach number isabout 0.088,and the Reynolds number Recbased on the mean aerodynamic chord(c)isabout8.93×105.Thecomputationaldomainsize used for the three-dimensional calculations is a rectangularshape,which is 120c×120c×120c in the x,y,z directions,respectively.Noslipboundarylayerconditionsaredefinedon the wall.A structured mesh is applied to simulate accurately the flow inside of the boundary layer,and the first grid space y+normal to the wall is less than 1.0.To account for the grid density sensitivity,two meshes,referred to medium-density mesh and very fine mesh,are generated with the same topology.Themedium-densitymeshconsistsof20.0millioncells and thevery fine meshcontains 31.0 millioncells.Figure8a,b shows the top views of the surface grid for the mediumdensity mesh and very fine mesh,respectively,and Fig.8c,d shows the distribution of grid on the symmetric plane for the medium-density mesh and very fine mesh,respectively.
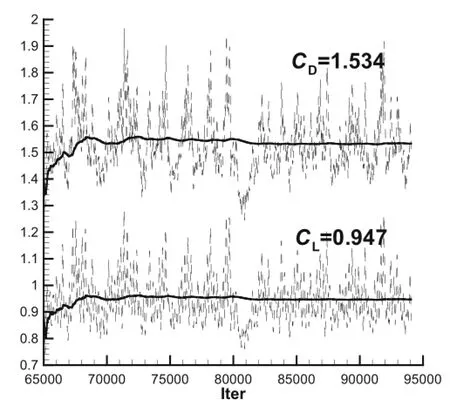
Fig.6 Time evolutions of lift and drag coefficients.(The dash lines denote the instantaneous value,and the solid lines represent the timeaveraged value)
TheinitialflowfieldfortheDDESisobtainedbyusingthe RANS convergence result.Similar to the work[14,16],neither RANS nor URANS methods can capture any unsteady phenomena and no vortex breakdown process occur,so only RANS results are provided and analyzed in this work.To investigate the sensitivity of both the grid resolution and the time step to the DDES computations,two sets of time steps Δt∗are examined here:Δt∗=0.025 and Δt∗=0.01,and the time step Δt∗is defined as follows

where the symbol*represents dimensionless,U∞denotes the free stream velocity,and c stands for the mean aerodynamic chord length.Employing the medium density mesh in conjunction with Δt∗=0.025 and the very fine mesh in conjunction with Δt∗=0.01,DDES computations are carried out for the aircraft at a 60◦AOA and zero slip.For Δt∗=0.01,100 time steps are needed for the freestream to travel over the mean aerodynamic chord of wing.Figure 9a,b shows the influence of the grid density and the time step on the lift and drag coefficients of the DDES computations.Figure 10 displays the effect of the grid and the time step on the distribution of the instantaneous Q=10,the details about the definition of Q can be found in citer36.It is seen that more and smaller turbulent structures surrounding the detached vortex in the wake can be captured not only by increasing the grid density,but also by decreasing the time step.From Fig.9,both lift and drag coefficients decrease when the fine mesh in conjunction with Δt∗=0.01 is used as more and small flow structures can be captured,but the variation is slight within 0.6%,so it can be concluded that a very fine convergence can be achieved for the DDES calculationbasedonthetimestepΔt∗=0.01inconjunctionwith the very fine mesh.Indeed,the time step of Δt∗=0.01 is shown small enough for the massively separated flows over chine fuselage/delta-wing configurations and fighter aircraft[16,22].

Fig.7 Pressure coefficient on the airfoil surface

Table 1 Comparison of DDES results with the experimental data
Starting the time averaging in all computations after first 3000-4000 time steps removes the transient influence and about 25000 time steps are carried out for the DDES computations.Figure 11a,b shows the distributions of the mean Mach number on the symmetric plane(x-y plane)from the RANS and the DDES computations,respectively.It is foundthat these are highly different between the separation pattern atthisselectedcondition.Theseparationzoneontheleeward predicted by DDES looks larger,and the dominant vortex is lifted up and turns to be away from the fuselage.Moreover,a new recirculation zone exists behind the aircraft cabin,but is not observed in RANS results,so a deeper stall can be capturedbytheDDESmethod,resultinginthedecreasingof lift and drag coefficients.Figure 12 shows the cross-planes(y-z)of the mean Mach number and streamlines at several chordwise positions,x=0.4,0.8,and 0.95 m,it can also be found that separation regions on the cross planes are under-predicted by the RANS method.Although the flowfield predicted by RANS is fully separated at 60◦AOA,the vorticesarestationaryandsymmetricattheseselectedchordwisestations.Contrarily,theflow-fieldfromDDESbecomes asymmetricatx=0.4m,andsmallervortexstructuresbegin to form further downstream.
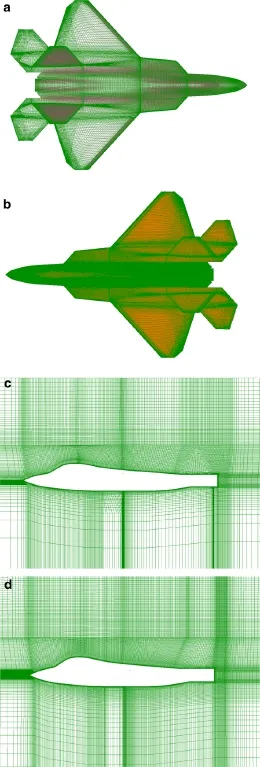
Fig.8 a The surface grid of the medium-density mesh.b The surface grid of the very fine mesh.c The distribution of grid on the symmetric plane(x-y plane)of the medium-density mesh.d The distribution of grid on the symmetric plane(x-y plane)of the very fine mesh
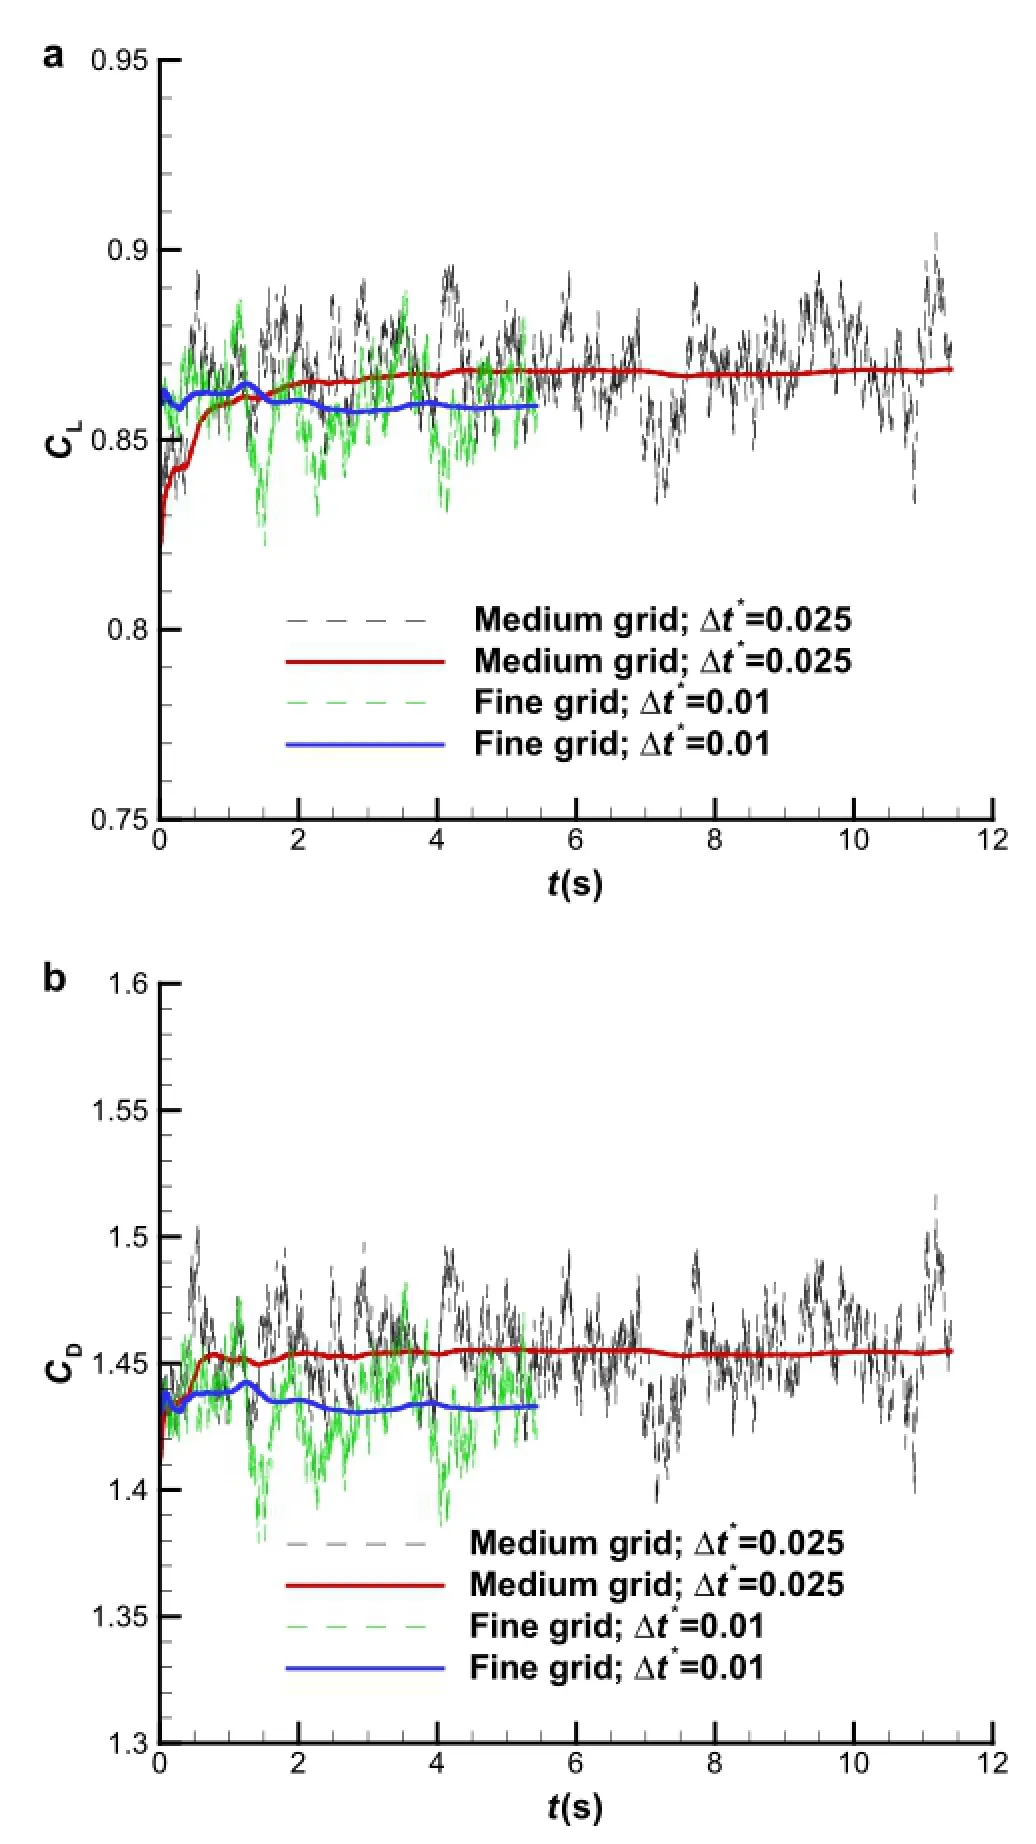
Fig.9(Color online)Effects of grid density and time step on the time-dependent(dash lines)and time-averaged(solid lines).a Lift coefficients.b Drag coefficients.The green and blue lines represent the instantaneous value and mean value based on the medium-density mesh in conjunction with Δt∗=0.025,respectively,and the black and red lines represent the instantaneousvalue and meanvalue basedon the very fine mesh in conjunction with Δt∗=0.01,respectively

Fig.10(Color online)Effects of grid density and time step on the instantaneous Q criterion

Fig.11(Color online)Time-averaged Mach number and streamlines on the symmetric plane(x-y).a RANS predictions.b DDES predictions
The flows over the aircraft at 40◦and 50◦AOAs are also calculated by the DDES method.The instantaneous views of the Mach number based on the RANS and the DDES approach on the symmetric plane(x-y plane)are depicted in Fig.13;it can be observed that the separation zone above the fuselage from both RANS and DDES becomes larger with the increase of AOA.Furthermore,a larger separation region can be captured by the DDES than that from RANS. As mentioned above that the DDES approach is sufficient to capture smaller turbulent structures,it is interesting to find that a vortex shedding starts to form near the nose of aircraft at 50◦and 60◦AOAs but not at 40◦.Figure 14 shows the comparison of lift,drag,and pitching moment between the calculation and experimental data as a function of theAOA.Not only the RANS,but also the DDES method can correctly predict the pitching moment coefficients at these selectedconditions.However,theliftanddragcoefficientsat 50◦and60◦AOAsareover-predictedbytheRANSapproach,and all of results from DDES are in good agreement with the experimental data.It is important to highlight that the agreement of lift and drag coefficients at the stall AOA of 40◦between the RANS and DDES calculation can be seen to be excellent.We can deduce that the DDES works as well as RANS for attached flow and the grid induced separation do not exist in DDES simulations.

Fig.12(Color online)The distribution of time averaged Mach number and streamlines on cross-planes at three stations:x=0.4,0.8 and 0.95 m. a,c,e RANS computations.b,d,f DDES computations
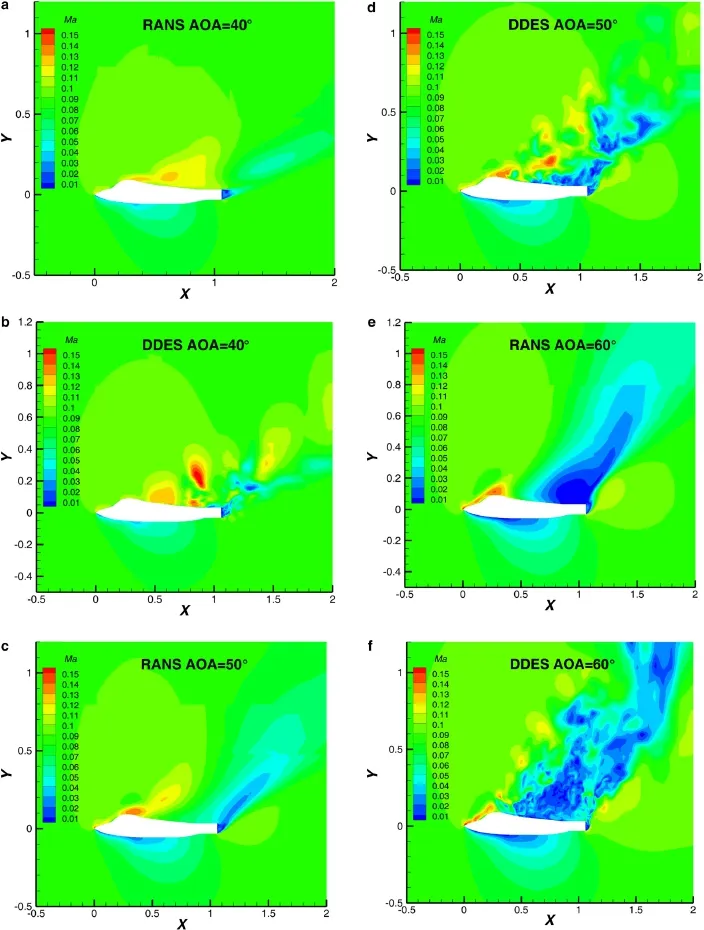
Fig.13(Color online)Instantaneous Mach number magnitude on the symmetric plane(x-y)for the three cases.a,c,e RANS computations.b,d,f DDES computations
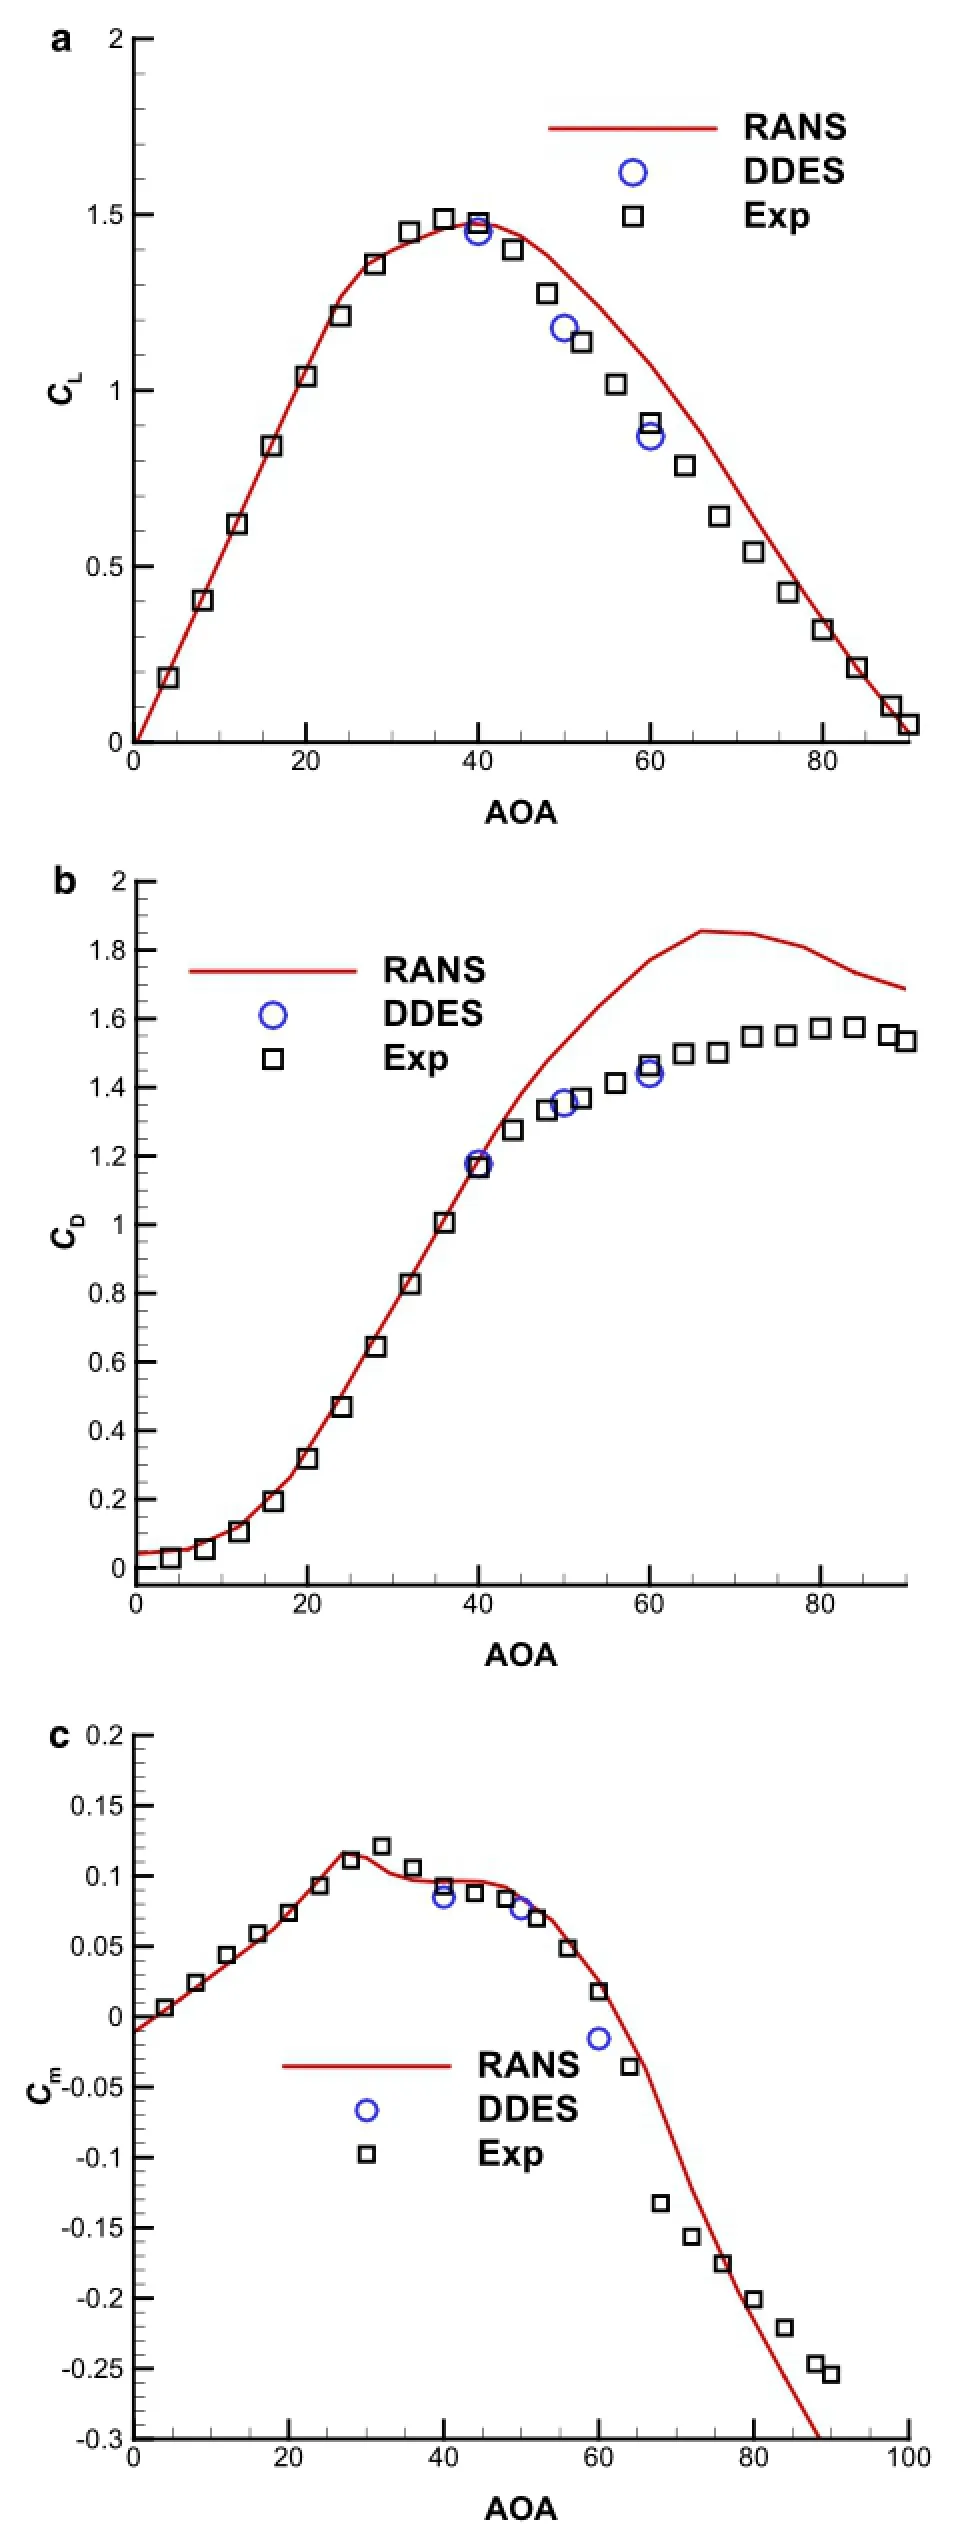
Fig.14 ComparisonoftheRANSandDDESresultswithexperimental data.aLiftcoefficients.bDragcoefficients.cPitchmomentcoefficients

Fig.15(Color online)a Power spectral density of lift coefficients based on DDES.b The Strouhal number of the 1st order for the three cases
The power spectrum density of the lift coefficients for the three cases is given in Fig.15a,and the Strouhal numberof the dominant frequency is also depicted in Fig.15b.The Strouhal number is defined as:TheStrouhalnumberofthedominantfrequencyisabout0.15 at an AOA of 60◦,which stands for a vortex-shedding frequency,and the Strouhal number of the 1st order for three cases decreases as the AOA increases.It is well known that the Strouhal number of the vortex shedding process of the flow over a two-dimensional cylinder is about 0.21.However,owing to the three-dimensional effect,the Strouhal number of the vortex shedding around a three-dimensional swept cylinder is smaller.The iso-surfaces of Q=10 of the vortex structures extracted from the DDES calculations at AOAs of 40◦,50◦,and 60◦are plotted in Fig.16.An alternate vortex shedding process exists for the three cases,producing asymmetry on the vortex distribution.Obviously,only one dominated frequency is observed at 60◦of AOA in Fig.15a,indicating that flow is characterized by the vortex shedding.On the other hand,a different behavior can be observed in both of the spectral distributions of the lift coefficients at 40◦and 50◦of AOAs that multiple frequencies existing for these two cases.This suggests that the vorticity dynamics is associated with both vortex breakdown and vortex shedding processes.Moreover,from Fig 15a,it can be seen that the Strouhal number associated with the vortex breakdown process is about 1.0,so it can be deduced that the time step of Δt∗=0.01 is small enough to capture the vortex dynamic process.Furthermore,for the separated turbulent boundary layer,Simpsonetal.[37]confirmed thatthe turbulence spectrum decays with St-3scaling at higher frequencies.However,for these detached eddy flow,as shown in Fig.15a,the profiles of the lift coefficients vary approximatelylikeSt-1inthelow-frequencyrange,andhavescaling St-4in the high-frequency range.
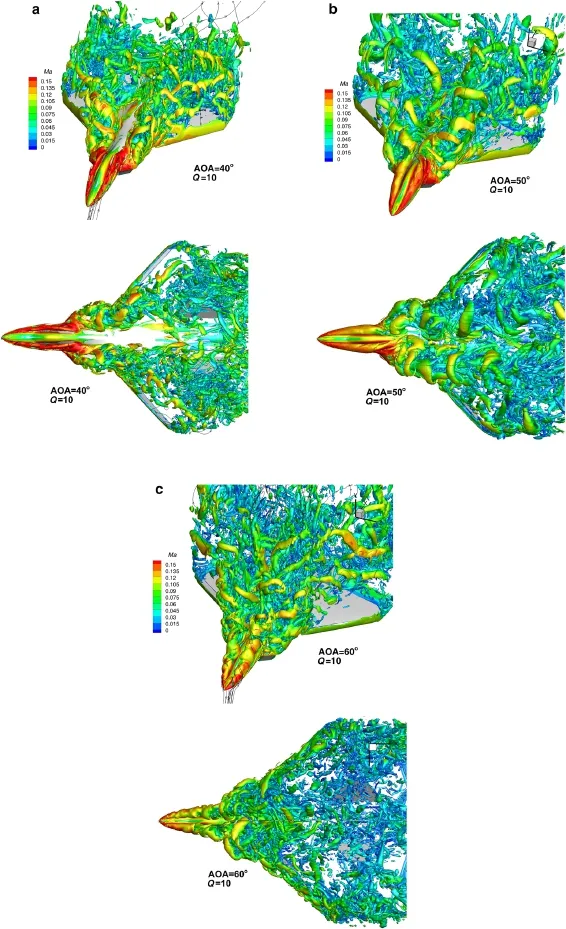
Fig.16(Color online)Isosurface of the Q=10 criterion,colored by the local Mach number.a At 40◦.b At 50◦.c At 60◦

Fig.17(Color online)Top view of the distribution of time-averaged pressure on the wall for various DDES simulations.a At 40◦.b At 50◦. c At 60◦
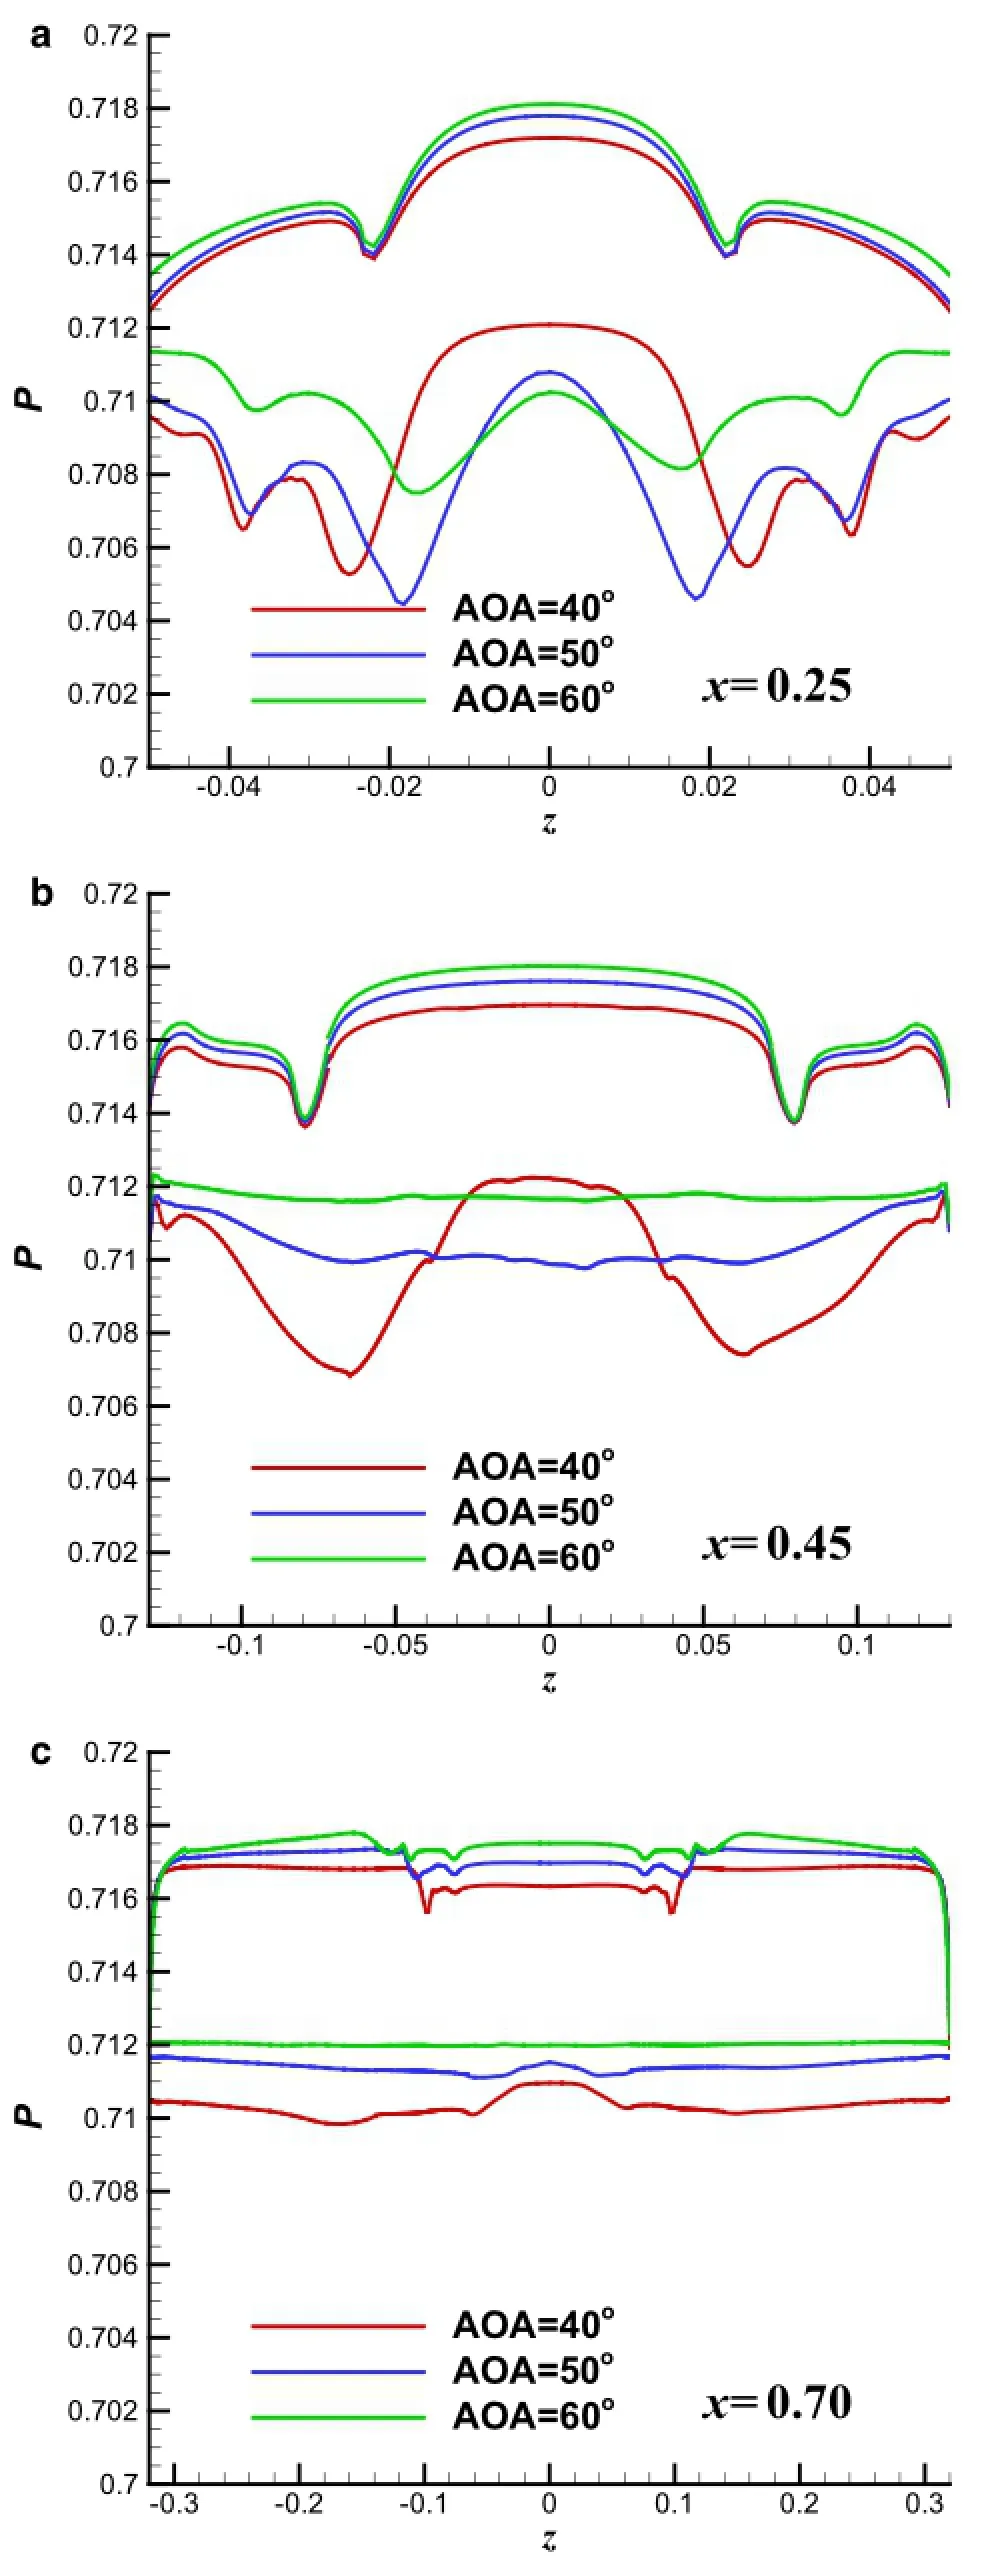
Fig.18 Distributions of time-averaged pressure at several constant streamwise locations based on the DDES simulations.a At x=0.25. b At x=0.45.c At x=0.70

Figure17displaysthetime-averagedpressuredistribution on the surface for three cases.It can be seen in Fig.17a that the low-pressure region on the upper surface is destroyed by the vortex breaking down process at AOA of 40◦.Furthermore,similar to the supersonic base flow[38],in the fully separation region,the pressure on the upper surface is high and almost constant p~=0.713,which is more obvious at AOA of 60◦.This high-pressure region on the upper surface is extended forward with increasing AOA,accounting for the decrease of lift and pitching moment coefficients in Fig.14.Thesectionalpressuredistributionsarealsodepicted in Fig.18,distributions are plotted at x=0.25,0.45,and 0.70 for each case.Figure 18a shows that there are two fore-body vortices at AOA of 40◦,their locations being near z=0.25and0.40,andthesefore-bodyvorticesmoveinward with increasing AOA due to the decrease of the pressure on the symmetric plane.Moreover,the subsequent development of the fore-body vortices can be found in Fig.18b,c,the dominant vortex can also be captured at x=0.45 for AOA of 40◦,but the flow is almost fully separated for both AOAs of 50◦and 60◦as the sectional pressure distributions are almost invariable.
5 Conclusions
In this work,numerical simulations of flow over a realistic fighterat40◦,50◦,and60◦AOAshavebeenperformedusing the RANS,URANS,and DDES methods,and the results are compared and analyzed with the experimental data provided by the low speed wind tunnel in CARDC.The massively separated flow is poorly predicted by the RANS method at high AOAs conversely,the DDES solutions can capture a“deeper”stall leeward,reducing the liftand drag coefficients andaredemonstratedtobemoreaccurate,whichisconsistent with the experimental measurements.
The DDES simulation of flow at the critical stall AOA of 40◦provided good agreement with the compared RANS results and experimental data,showing that the grid induced separation in DES can be overcome by applying the DDES method.The effect of AOA on the flow dynamics over the general aircraft is also investigated using the DDES method. The power spectral density analysis of the lift coefficients are also investigated for three cases,and multiple peaks can be distinguished in profiles of lift coefficient PSD for the flow at 40◦and 50◦AOAs.It can be concluded that both vortex breakup and vortex shedding are active.On the other hand,only one dominated frequency exists in the PSD of lift coefficient at 60◦AOA it suggests that the vortex shedding is the main mechanism.
Acknowledgments ThispaperwassupportedbyNationalNaturalScience Foundation of China(Grant 11302245).The authors have been benefited from discussions with Prof.Song Fu and Associated Prof. Zhixiang Xiao of Tsinghua University.Dr.Zhitao Liu and Dr.Haiyou Zhang provided the experimental data and discussions.
References
1.Nelson,R.C.,Pelletier,A.:The unsteady aerodynamics of slender wings and aircraft undergoing large amplitude maneuvers.Prog. Aerosp.Sci.39,185-248(2003)
2.Erickson,G.E.,Brandon,J.M.:Low-speed experimental study of thevortexfloweffectsofafighterfore-bodyhavingunconventional cross-section.12th Atmospheric Flight Mechanics Conference,AIAA Paper 19885-1798(1985)
3.LeMay,S.,Rogers,L.:Pneumatic vortex flow control on a 55-degree cropped delta wing with chined forebody.AIAA 16th Aerodynamic Ground Testing Conference,AIAA Paper 90-1430(1990)
4.Fisher,D.F.,Richwine,D.M.,Banks,D.W.:Surface flow visualization of separated flows on the forebody of an F-18 aircraft and wind-tunnel model.NASA TM-100436(1988)
5.Del Frate,J.H.,Fisher,D.F.,Zuniga,F.A.:In-flight flow visualization with pressure measurements at low speeds on the NASA F-18 high alpha research vehicle.NASA TM-101726(1990)
6.Fisher,D.F.,Banks,D.W.,Richwine,D.M.:F-18 High alpha research vehicle surface pressures:initial in-flight results and correlation with flow visualization and wind tunnel data.AIAA Paper 1990-301(1990)
7.Alcorn,C.W.,Croom,M.A.,Francis,M.S.,etal.:TheX-31aircraft: advancesinaircraftagilityandperformance.Prog.Aerosp.Sci.32,377-413(1996)
8.Ravi,R.,Mason,W.H.:Acomputationalexaminationofdirectional stability for smooth and chined forebodies at high-α.NASA CR-4465(1992)
9.Agosta Greenman,R.M.,Gee,K.,Cummings,R.M.,et al.:Computational investigation of tangential slot blowing generic chined forebody.J.Aircr.32,811-817(1995)
10.Degani,D.,Schiff,L.B.:Computation of turbulent flows around pointed bodies having crossflow separation.J.Comput.Phys.66,173-196(1986)
11.Gee,K.,Cummings,R.M.,Schiff,L.B.:Turbulence model effects on separated flow about a prolate spheroid.AIAA J.30,655-664(1992)
12.Mariani,Dacles:J.,Zilliac,G.G.,Chow,J.S.,et al.:Numerical/experimental study of a wingtip vortex in the near field.AIAA J.33,1561-1568(1995)
13.Spalart,P.R.,Jou,W.H.,Strelets,M.,et al.:Comments on the feasibility of LES for wings and on a hybrid RANS/LES approach. In:Advances in DNS/LES,1st AFOSR International Conference on DNS/LES,Greyden Press,Columbus,pp.137-147(1997)
14.Forsythe,J.R.,Squires,K.D.,Wurtzler,K.E.,et al.:Detached eddy simulationoffighteraircraftathighalpha.AIAApaper,2002-0591(2002)
15.Forsyth,James R.,Squires,Kyle D.,Wurtzler,Kenneth E.,et al.: Detached-eddy simulation of the F-15E at high alpha.J.Aircr.41,193-200(2004)
16.Forsythe,James R.,Woodson,Shawn H.:Unsteady computations of abrupt wing stall using detached-eddy simulation.J.Aircr.42,606-616(2005)
17.Morton,S.A.,Steenman,M.B.,Cummings,R.M.,et al.:DES grid resolution issues for vortical flows on a delta wing and an F-18C. AIAA paper 2003-1103(2003)
18.Morton,S.A.,Cummings,R.M.,Kholodar,D.B.:High resolution turbulence treatment of F/A-18 tail buffet.J.Aircr.44,1769-1775(2007)
19.Menter,F.R.,Kuntz,M.:Adaptation of eddy-viscosity turbulence models to unsteady separated flow behind vehicles.In:McCallen,R.,Browand,F.,Ross,J.(eds.)Symposiumon“TheAerodynamics ofHeavyVehicles:Trucks,BusesandTrains.”Monterey,USA,2-6 Dec Springer,Heidelberg(2004)
20.Spalart,P.R.,Deck,S.,Shur,M.,et al.:A new version of detached eddysimulation,resistanttoambiguousgriddensities.Theor.Comput.Fluid Dyn.20,181-195(2006)
21.Jeans,T.L.,McDaniel,D.R.,Cummings,R.M.,etal.:Aerodynamic analysis of a generic fighter with a chinefuselage/delta wing configuration using delayed detached-eddy simulation.AIAA Paper 2008-6228(2008)
22.Jeans,T.L.,McDaniel,D.R.,Cummings,R.M.,etal.:Aerodynamic analysis of a generic fighter using delayed detached-eddy simulation.J.Aircr.46,1326-81339(2009)
23.Menter,F.R.:Two-equation eddy-viscosity turbulence models for engineering applications.AIAA J.32,1598-1605(1994)
24.Strelets,M.:Detached eddy simulation of massively separated flows.AIAA Paper 2001-0879(2001)
25.Menter,F.R.,Kuntz,M.:A zonal SST-DES formulation.DES workshop,St.Petersburg,Russia(2003)
26.Kravchenkoa,A.G.,Moin,P.:Numerical studies of flow over a circular cylinder at ReD=3900.Phys.Fluids 12,403-417(2000)
27.Mary,I.,Sagaut,P.:Largeeddysimulationofflowaroundanairfoil. AIAA paper 2001-2559(2001)
28.Jameson,A.,etal.:Numericalsolutionsofeulerequationsbyfinite volume methods with Runge-kutta time stepping schemes.AIAA 1981-1259(1981)
29.Weiss,J.M.,Smith,W.A.:Preconditioning applied to variable and constant density flows.AIAA J.33,2050-2057(1995)
30.Yoon,S.,Jameson,A.:An LU-SSOR scheme for the Euler and Navier-Stokes equations.AIAA paper 1987-6000(1987)
31.Roe,P.L.:Approximate Riemann solver,parameter vectors,and difference schemes.J.Comput.Phys.43,7-372(1981)
32.Xiao,Z.X.,Liu,J.,Huang,J.B.,etal.:Numericaldissipationeffect on the massive separation around tandem cylinders.AIAA J.50,1119-1136(2012)
33.Xiao,Z.X.,Liu,J.,Luo,K.Y.,et al.:Numerical investigation of massively separated flows past rudimentary landing gear using advanced DES approaches.AIAA J.51,107-125(2013)
34.Bellot Comte,G.,Corrsin,S.:Simple Eulerian time correlation of full and narrow band velocity signals in grid generated‘isotropic’turbulence.J.Fluid Mech.48,273-337(1971)
35.Swalwell,K.E.,Sheridan,J.,Melbourne,W.H.:Frequencyanalysis of surface pressure on an airfoil after stall.AIAA Paper 2003-3416(2003)
36.Jeong,J.,Hussain,F.:Ontheidenticationofavortex.J.FluidMech. 285,69-94(1995)
37.Simpson,R.L.,Ghodbane,M.,McGrath,B.E.:Surface pressure fluctuationsinaseparatingturbulentboundarylayer.J.FluidMech. 177,167-186(1987)
38.Simony,F.,Decky,S.,Guilleny,P.,et al.:RANS-LES Simulations of supersonic base flow.AIAA Paper 2006-898(2006)
RESEARCH PAPER
Energy corrugation in atomic-scale friction on graphite revisited by molecular dynamics simulations
Xiao-Yu Sun1,2·Yi-Zhou Qi1·Wengen Ouyang1·Xi-Qiao Feng1,3· Qunyang Li1,3
Received:16 July 2015/Revised:20 August 2015/Accepted:7 October 2015/Published online:1 December 2015
©The Chinese Society of Theoretical and Applied Mechanics;Institute of Mechanics,Chinese Academy of Sciences and Springer-Verlag Berlin Heidelberg 2015
AbstractAlthough atomic stick-slip friction has been extensively studied since its first demonstration on graphite,the physical understanding of this dissipation-dominated phenomenon is still very limited.In this work,we perform moleculardynamics(MD)simulationstostudythefrictional behavior of a diamond tip sliding over a graphite surface.In contrasttothecommonwisdom,ourMDresultssuggestthat theenergybarrierassociatedlateralsliding(knownasenergy corrugation)comesnotonlyfrominteractionbetweenthetip andthetoplayerofgraphitebutalsofrominteractionsamong the deformed atomic layers of graphite.Due to the competitionofthesetwosubentries,frictionongraphitecanbetuned by controlling the relative adhesion of different interfaces. Forrelativelylowtip-graphiteadhesion,frictionbehavesnormally and increases with increasing normal load.However,for relatively high tip-graphite adhesion,friction increases unusually with decreasing normal load leading to an effectivelynegativecoefficientoffriction,whichisconsistentwith therecentexperimentalobservationsonchemicallymodified graphite.Our results provide a new insight into the physical origins of energy corrugation in atomic scale friction.
KeywordsStick-slip friction·Energy corrugation· Molecular dynamics simulation·Graphite
1 Introduction
Since its first experimental demonstration on graphite by Mate et al.[1],atomic stick-slip friction has been reported to be a persistent phenomenon when a nanoscale tip sliding over crystalline surfaces[2,3].This interesting behavior could be well understood by the theoretical model,which was originally proposed by Prandtl and Tomlinson[4,5]to describe the surface diffusion problem.In the Prandtl and Tomlinson(PT)model[4,5],a particle linearly coupled to a spring is dragged forward while experiencing an interaction force originating from a one-dimensional periodic energy landscape.Ifthevariationamplitudeoftheenergylandscape is high or the spring constant is low enough,instability will occur during sliding leading to a special state where sticking and slipping appear alternatingly.The PT model has been shown to be able to qualitatively reproduce the experimental results and reveal many key characteristics of the stick-slip friction[2,6,7].
Despite the successful application of the PT model,severalkeyaspectsofatomicstick-slipfriction,e.g.,thephysical interpretationofthedamping/dissipationmechanismandthe originofenergycorrugation,remainunclear[3,8,9].According to the PT model,the energy barrier associated lateral sliding,known as energy corrugation,will largely determine the frictional resistance of the system.As friction is an interfacial process,the energy corrugation is commonly found to be dictated by the energy associated with the tipsurface interactions[3,10,11].However,a recent atomic force microscopy(AFM)experiment[12]on chemicallymodified graphite showed that friction could abnormally increase as the contact load was reduced resulting in an effectively negative coefficient of friction.This peculiar friction behavior was hypothesized to be caused by the localdelamination of atomic graphite layer during retraction[13]. Nevertheless,how this delamination affects the frictional resistance and,furthermore,what the physical origins of energy for a general sliding process are,invite a more systematic investigation.
✉ Qunyang Li qunyang@tsinghua.edu.cn
1AML and CNMM,Department of Engineering Mechanics,Tsinghua University,Beijing 100084,China
2Department of Engineering Mechanics,School of Civil Engineering,Wuhan University,Wuhan 430072,China3State Key Laboratory of Tribology,Tsinghua University,Beijing 100084,China
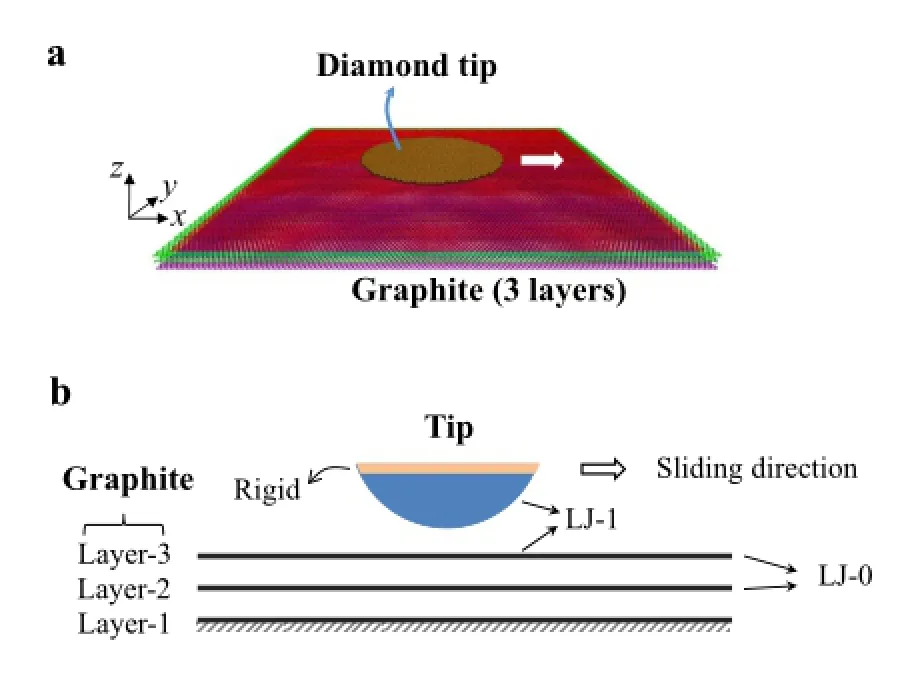
Fig.1 Simulationmodel.a Theatomisticmodelusedinthemolecular dynamics simulations.b A schematic showing the diamond-graphite system with their specific interactions
In this work,we performed molecular dynamics(MD)simulations to study the frictional behavior of a nanoscale diamond tip sliding over a graphite surface with various degrees of tip-graphite adhesion.The energy variation during the sliding process was analyzed to identify the physical origins of energy corrugation associated with the frictional resistance.Our simulation results suggest that the energy inside the bulk materials associated with pushing the deformed configuration forward can also play an indispensable role in contrast to the common wisdom.
2 Methods
The simulation model is shown in Fig.1a,b.A diamond tip was used to slide on a three-layered graphite substrate,and the resultant friction and interaction energy were recorded continuously during the simulation.The spherical diamond tip with a radius of R=200Å and a height of h=8Å was held and translated horizontally along the graphite surface. The top few layers of tip(2 Å thick)were assumed to be rigid while the lower part was set as deformable.For all simulations,the top surface of the diamond tip had a crystal orientation along the[100]direction.The graphite substrate contained three layers of graphene,which had a length of 266 Å and a width of 245 Å.The coordinate system was chosen such that the z-axis is normal to the graphite,the x-axis is along the zigzag direction and the y-axis is along the armchair direction,shown in Fig.1a.The whole bottom layergraphenewerefixedtoconstraintherigid-bodymotion of the graphite and the atoms at the edges of the top two graphenelayerswerealsofixedtoavoidglobalslidingamong the layers.
We performed MD simulations using large-scale atomic/ molecular massively parallel simulator(LAMMPS)[14]. The C-C atomic interactions within the tip or graphite were described by the many-body Tersoff potential[15,16]. Becauseourworkfocusesontheelasticandwearlessregime,twoLennard-Jones(LJ)typevanderWaals(vdW)potentials were used for describing the atomic interactions between the tip and graphite layers(LJ-1)and between different layers of graphite(LJ-0),respectively.The LJ potential has been widely adopted in simulating friction of graphitic materials andfoundtoreproducequalitativelyconsistentbehaviorwith experiments[9,13,17,18].IntheLJpotential,theinteraction potential is formulated as U(r)=4ε?(σ/r)12-(σ/r)6?,where ε is the depth of the potential well and σ is the characteristic distance at which the potential is zero.For the LJ potential between different layers of graphite,i.e.,LJ-0,we used σ0=3.40 Å and ε0=2.84 MeV[19].For the interaction between the tip and graphite,i.e,.LJ-1,we used the LJ parameters with σ=σ0and ε=λε0,where λ is the relative adhesionfactorrepresentingtheratioofadhesionstrengthof tip-graphene to graphene-graphene.
AccordingtothePTmodel,stick-slipfrictiononlyoccurs when the system has a finite loading stiffness[4,5].By varying the loading stiffness,Socoliuc et al.[20]experimentally demonstratedthatslidingcanbetunedfromstick-slipregime to continuous sliding regime.In contrast to the energy dissipation,whichmaydependonstiffnessoftheloadingsystem,temperature control algorithm and the masses of the systems,the maximum frictional resistance during sliding is less affected by the system parameters[17].Examining the source of energy corrugation help identify the origin of sliding resistance.However,we want to note that the maximum lateral force values revealed in our quasi-static simulations are upper bounds,and,in a real situation,the tip can slip earlierwithasmallerdragging forcewhenitisdrivenbyafinite speed and at a finite temperature.To minimize the impact of thermal noise and better extract the subtle energy variations,weperformedaquasi-staticsimulationatrelativelylowtemperature(0.01K).For a typical simulation,the tip and the substrate,where they were far apart,were firstly relaxed to obtain the minimum energy configuration by using conjugate gradient method.Then,the tip was gradually brought into contact with the substrate until a desired normal load Fnwas reached.The system was further thermally equilibrated for 20 ps before sliding.The lateral sliding was imposed by incrementally translating the tip along the x-direction.For each step,the tip moved 0.1 Å followed by a thermal equilibration at 0.01K for 5ps while the rigid part of the tip was held fixed.This loading scheme successfully mimicked a quasi-static sliding as demonstrated by good correlation between friction force and energy corrugation.
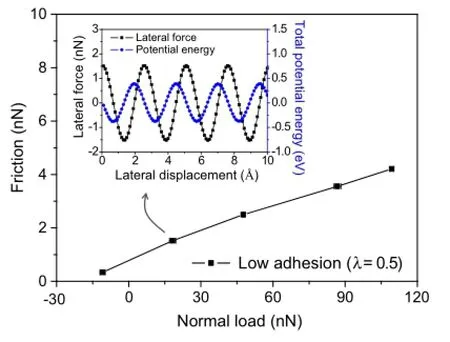
Fig.2 Variation of friction force Ffas a function of normal load.The inset shows the variation of the lateral force and the total potential energy of the system as functions of the lateral displacement under a normal load of 18.3nN
3 Results and discussions
3.1 Friction with low adhesion(λ=0.5)
Wefirstexploredthefrictionalbehaviorwhenthetip-graphite adhesion was relatively weak(λ=0.5).Variation of friction force Ffas a function of normal load is given in Fig.2.Friction force was calculated by averaging local peak values of lateralforcetraceoverafewatomicperiods,andthenegative and positive normal forces indicate attractive and repulsive interaction between the tip and graphite,respectively. Because we kept the tip at a constant height in each simulation,the normal load would change slightly(depicted by the x-uncertainty bar of the data points)when the tip moved forward.Asindicatedbythecurve,frictionongraphiteincreases monotonically with the normal load,which is qualitatively consistent with the common experimental observations on freshly cleaved graphite[1].
We also plot the variation of the lateral force and the total potential energy of the system as functions of the lateral displacement under a normal load of 18.3nN,as shown in the inset of Fig.2.To highlight the oscillating feature,the values of the potential energy reported in this paper have all been offset to remove the constant part.It can be seen that the variationofthepotentialenergy,orenergycorrugation Etotal,appears to be periodic and very close to a sinusoidal shape. By taking the negative derivative of Utotalwith respect to x,i.e.,-∂Utotal(x)/∂x,one can nicely recover the lateral force FL.This good consistency between-∂Utotal(x)/∂x and FLdemonstrates that our system was indeed a good approximation of the quasi-static loading process where the dynamic and kinetic effects have been minimized.
Since the friction force is closely related to the potential energy of the system,we calculated the individual components of potential energy and compared their variation trends during the sliding process.In our simulation model,the total potential energy of the system is given by Utotal=Uij,whereUtiis the potential energy between the tip and the i-th-layer of graphite,Uttis the potential energy inside the tip,Uijis the potential energy between the i-th-layer,and j-th-layer of graphite.To better understand the dependence of friction on normal load as revealedbyFig.2,wecarriedoutasystematiccomparisonof these ten potential energy variations at three typical normal loads,which can be found in Fig.7 of the Appendix.
From the schematic and the atomistic simulation results of the deformed configuration shown in Fig.3a,the different components of the potential energy can be essentially categorized into two types:the potential energy associated with the sliding interface,and the potential energyassociatedwiththedeformationinsidethebulkmaterials.Figure 3b-d present the variation of Uint,Ubulk,and Utotalas functions of the lateral displacement at three typical normal loads.
It can be seen that all the potential energies are oscillatory in phase with a similar period of roughly 2.5 Å,which well matches the lattice period of graphite along the zigzag direction.The results also indicate that the contribution from the bulk materials Ubulkis nontrivial at low normal loads and becomes significant,or even dominating,at high normal loads.This means that the work done by the lateral force is not only used for driving the tip sliding over the surface atoms but also used for pushing the deformed configuration of the substrate forward.When the normal load increases,the amplitude of ΔUintonly changes slightly due to incommensurate contact,but the amplitude of ΔUbulkbecomes more and more prominent,leading to higher frictional resistance.To the best of our knowledge,this is the first time that the configurational force due to atomically oscillatory variation of Ubulkwas discussed under the framework of the PT model.
3.2 Friction with strong adhesion(λ=5)
When the tip-graphite adhesion is relatively strong(λ=5),variation of friction force Ffas a function of normal load is shown in Fig.4,and variations of the lateral force and the totalpotentialenergyofthesystemasfunctionsofthelateral displacement under a typical normal load are included in the inset.Similar to the low adhesion case,the energy corrugation ΔUtotalalso appears to be periodic and very close to a sinusoidal shape.In addition,by taking the negative derivative of ΔUtotaland comparing it with the lateral force,we again confirmed that the system is in a quasi-static state. However,in sharp contrast to the low adhesion case,friction on a highly adhesive graphite surface increases abnormally with decreasing normal load,resulting in a negative slope(or effective coefficient of friction).The numerical predic-tion is consistent with the recent experimental observation on chemically-modified graphite[12],where the slope of friction-load curve was found to be sensitively dependent on tip-graphite adhesion.
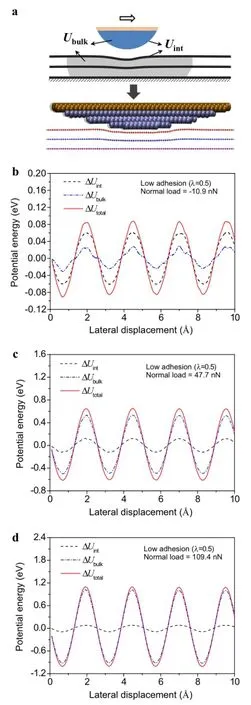
Fig.3 a A schematic and a typical atomistic simulation result of the deformed configuration for systems with low adhesion.Variations of Uint,Ubulkand Utotalas functions of the lateral displacement at three typical normal loads.b Fn=-10.9nN.c Fn=47.7nN.d Fn= 109.4nN
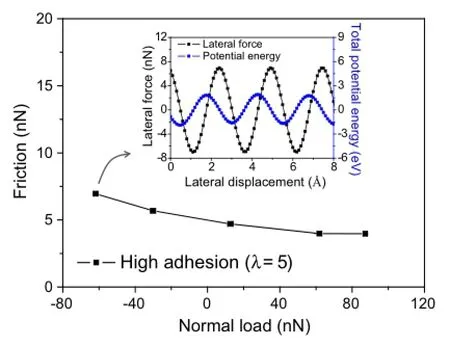
Fig.4 Variation of friction force Ffas a function of normal load.The insetshowsthevariationofthelateralforceandthetotalpotentialenergy of the system as functions of the lateral displacement under a normal load of-61.8nN
Although it was hypothesized that the abnormal increase of friction was related to the local delamination of the top graphene layer[12,13],it was still not clear on how this subsurface delamination affects frictional resistance.To reveal the physical mechanism of this abnormal phenomenon,we analyzed the variations of the potential energy in the same fashion as the low-adhesion case.A schematic and a typical atomistic simulation result of the deformed configuration at high adhesion are shown in Fig.5a.Our simulations again confirmed that the unusual increase of friction during tip retraction was correlated with the local delamination of the top few graphene layers,as depicted in Fig.5a.Similarly,we plot the variation of Uint,Ubulk,and Utotalas functions of the lateral displacement at three normal loads in Fig.5b-d(detailed variation of individual energy components can be found in Fig.8 in the Appendix).It is seen that,when the normal load decreases during tip retraction,the amplitude of the total energy corrugation ΔUtotalabnormally increases consistent with the variation trend of friction.However,by comparing Fig.5b-d with Fig.3b-d,we found that the key mechanism of increase of ΔUtotalis fundamentally different for the two cases.In the low adhesion case,the deformation occurs mainly via shearing of interfaces(both tip-graphene and graphene-graphene interfaces),and the lateral force is transmitted across the interfaces directly.Therefore,both ΔUintand ΔUbulkwill vary in phase during sliding,and as a result,the increase of ΔUtotalis achieved by increase of individual components.In contrast,when the tip-graphene adhesionishigh,theatomiclayersofgraphitecangetdelaminated internally,as depicted in Fig.5a.The lateral force is mainlyusedforshearingalongthetip-grapheneinterface;but it is used for cracking along the graphene-graphene interfaces.Because of the different deformation modes,ΔUintand ΔUbulkdo not necessarily vary in concert,and thereis a phase difference between these two components.The increase of ΔUtotalwith decreasing load at high adhesion is largely caused by the change in phase difference during tip retraction.Forexample,althoughtheamplitudeofΔUintand ΔUbulkdo not change much when the normal load changes from87.2to-61.8nN,theamplitudeofΔUtotalcanincrease almost 100%by adjusting the phase difference of individual components.
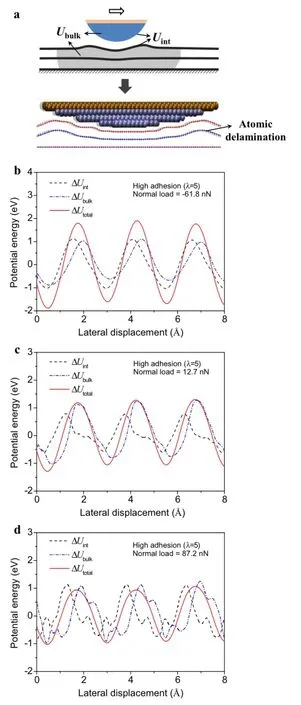
Fig.5 a A schematic and a typical atomistic simulation result of the deformed configuration for systems with high adhesion.Variations of Uint,Ubulk,and Utotalas functions of the lateral displacement at three typical normal loads.b Fn=-61.8nN.c Fn=12.7nN.d Fn= 87.2nN

Fig.6 A schematic showing a general contact sliding problem:the energy barrier(or energy corrugation)associated with sliding the tip forward consists of two parts:Uintfrom the contact interface and Ubulkfrom the bulk materials;these two components can vary with different amplitudes and phases
4 Conclusions
In summary,the frictional behavior of a diamond tip sliding over a graphite surface with different tip-graphite adhesions was investigated using MD simulations.It was found that the interaction between the tip and the top layer of graphite andtheelasticenergyassociatedwiththedeformationinside graphite both play an important role in determining the frictional behavior.By controlling the relative strength of tip-graphite adhesion,friction on graphite can be tuned by invoking the competition of these two subentries.
In a broader sense,our simulation results clearly show that the energy corrugation associated with frictional sliding comes not only from the interfacial interaction but also from the deformation inside the bulk materials.For a general sliding contact problem as shown in Fig.6,a driving force is needed to overcome the interfacial resistance as well as to push the deformation configuration forward.The latter part can be exhibited as a constant term at the macroscale or as an extra oscillatory configurational force at the atomic scale. More importantly,the simulations suggest that,by adjusting its relative amplitude and the phase difference with respect to the interfacial potential energy,this oscillatory configurational force adds rich ingredients to the nanoscale friction,which in turn may offer novel means for tuning friction at larger scales.
AcknowledgmentsQunyang Li would liketo thank the support from the National Natural Science Foundation of China(Grants 11272177,11422218,11432008),the National Basic Research Program of China(Grants 2013CB933003,2013CB934201 and 2015CB351903),the Tsinghua University Initiative Scientific Research Program and the Thousand Young Talents Program of China.Xiao-Yu Sun acknowl-edges the financial support from China Postdoctoral Science Foundation(Grant 2014M562055).The simulations were performed on the Explorer100clustersystemofTsinghuaNationalLaboratoryforInformation Science and Technology.
Appendix
See Figs.7 and 8.
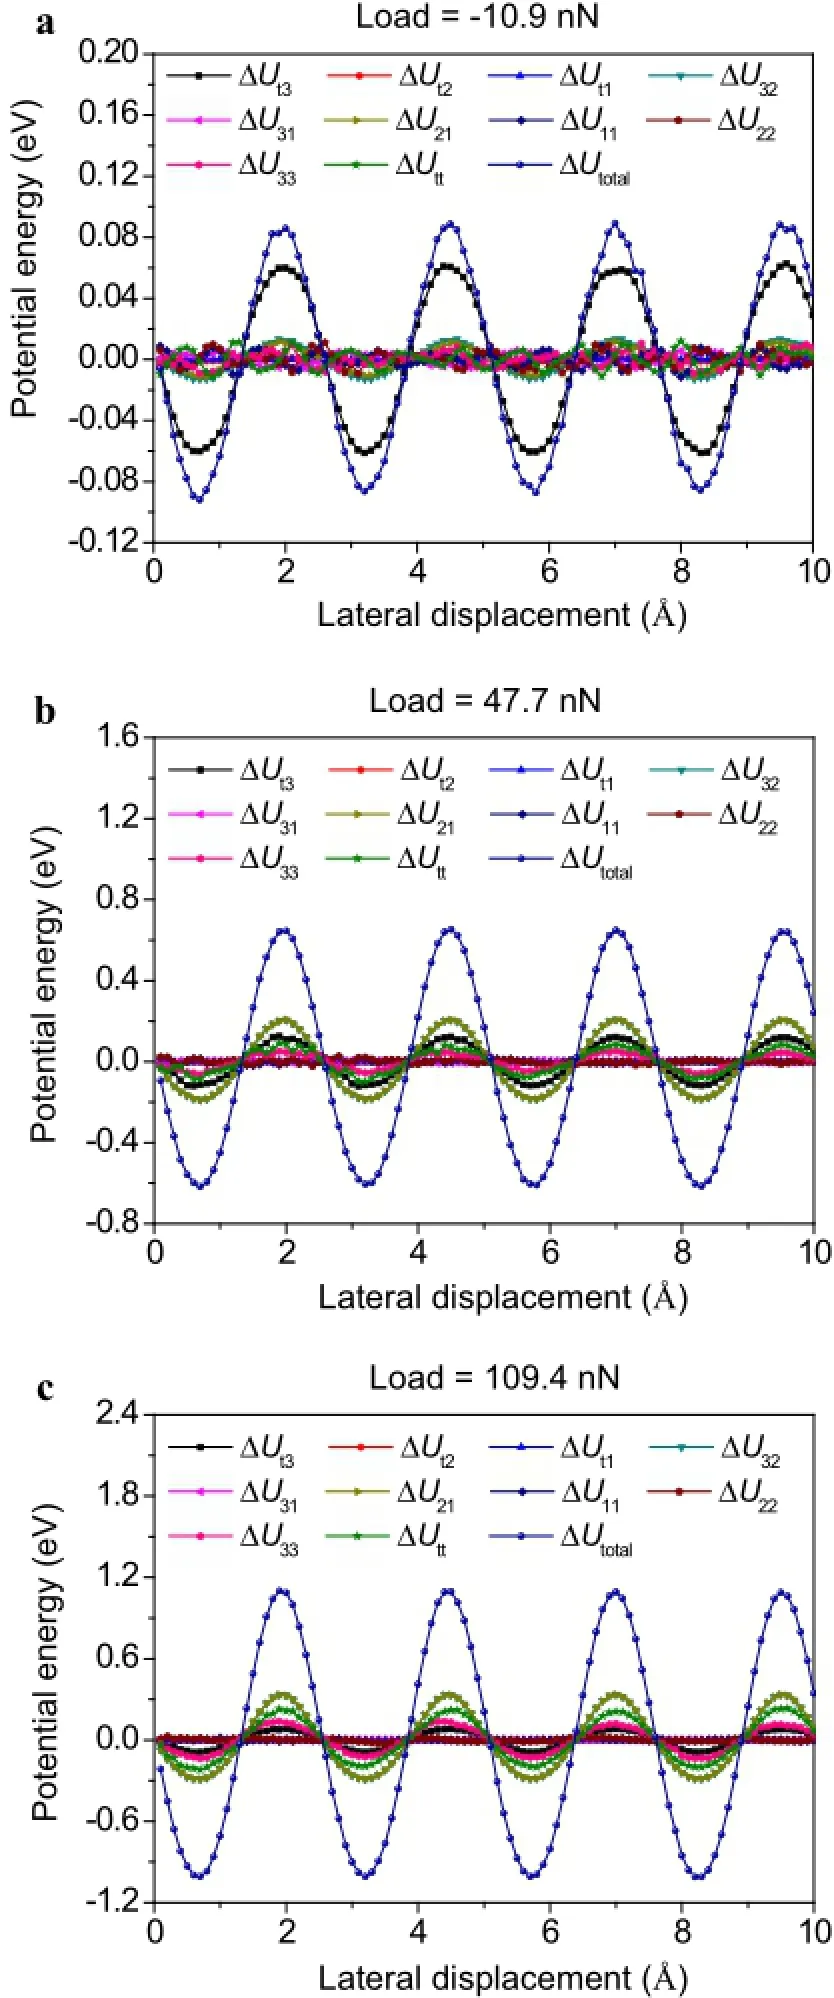
Fig.7 Variation of different components of the potential energy as functionsofthelateralslidingdisplacementwithlowtip-graphiteadhesion.a Normal load at-10.9nN.b Normal load at 47.7nN.c Normal load at 109.4nN
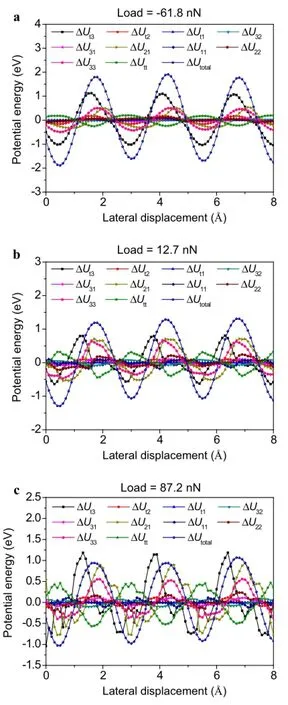
Fig.8 Variation of different components of the potential energy as functionsofthelateralslidingdisplacementwithhightip-graphiteadhesion.a Normal load at-61.8nN.b Normal load at 12.7nN.c Normal load at 87.2nN
References
1.Mate,C.M.,Mcclelland,G.M.,Erlandsson,R.,etal.:Atomic-scale frictionof a Tungsten tipon a graphite surface.Phys.Rev.Lett.59,1942-1946(1987)
2.Carpick,R.W.,Salmeron,M.:Scratching the surface:fundamental investigations of tribology with atomic force microscopy.Chem. Rev.97,1163-1194(1997)
3.Mate,C.M.:Tribology on the Small Scale:A Bottom up Approach toFriction,Lubrication,andWear.OxfordUniversityPress,Oxford(2008)
4.Prandtl,L.:Ein gedankenmodell zur kinetischen theorie der festen Körper.Z.Math.Mech.8,85-106(1928)
5.Tomlinson,G.A.:A molecular theory of friction.Philos.Mag.7,905-939(1929)
6.Dedkov,G.:Experimental and theoretical aspects of the modern nanotribology.Phys.Status Solidi A 179,3-75(2000)
7.Gnecco,E.,Bennewitz,R.,Gyalog,T.,et al.:Friction experiments on the nanometre scale.J.Phys.Condens.Matter 13,R619-R642(2001)
8.Braun,O.,Naumovets,A.:Nanotribology:Microscopic mechanisms of friction.Surf.Sci.Rep.60,79-158(2006)
9.Szlufarska,I.,Chandross,M.,Carpick,R.W.:Recent advances in single-asperity nanotribology.J.Phys.D-Appl.Phys.41,123001(2008)
10.Sasaki,N.,Tsukada,M.:Load dependence of the frictional-force microscopy image pattern of the graphite surface.Phys.Rev.B 57,3785-3786(1998)
11.Fujisawa,S.,Yokoyama,K.,Sugawara,Y.,etal.:Loaddependence of sticking-domain distribution in two-dimensional atomic scale friction of NaF(100)surface.Tribol.Lett.9,69-72(2000)
12.Deng,Z.,Smolyanitsky,A.,Li,Q.,et al.:Adhesion-dependent negative friction coefficient on chemically modified graphite at the nanoscale.Nat.Mater.11,1032-1037(2012)
13.Smolyanitsky,A.,Zhu,S.,Deng,Z.,et al.:Effects of surface compliance and relaxation on the frictional properties of lamellar materials.RSC Adv.4,26721-26728(2014)
14.Plimpton,S.:Fast parallel algorithms for short-range molecular dynamics.J.Comput.Phys.117,1(1995)
15.Tersoff,J.:New empirical approach for the structure and energy of covalent systems.Phys.Rev.B 37,6991(1988)
16.Tersoff,J.:Modeling solid-state chemistry:interatomic potentials for multicomponent systems.Phys.Rev.B 39,5566(1989)
17.Dong,Y.,Li,Q.,Martini,A.:Molecular dynamics simulation of atomic friction:a review and guide.J.Vac.Sci.Technol.A 31,030801(2013)
18.Ye,Z.,Tang,C.,Dong,Y.,et al.:Role of wrinkle height in friction variation with number of graphene layers.J.Appl.Phys.112,116102(2012)
19.Neek-Amal,M.,Peeters,F.M.:Nanoindentation of a circular sheet of bilayer graphene.Phys.Rev.B 81,235421(2010)
20.Socoliuc,A.,Bennewitz,R.,Gnecco,E.,et al.:Transition from stick-slip to continuous sliding in atomic friction:entering a new regime of ultralow friction.Phys.Rev.Lett.92,134301(2004)
26 October 2015/Revised:25 February 2016/Accepted:8 March 2016/Published online:28 May 2016
✉ Guoliang Xu xuguoliang07@tsinghua.org.cn
1China Aerodynamics Research and Development Center,Mianyang 621000,China
- Acta Mechanica Sinica的其它文章
- Plate/shell topological optimization subjected to linear buckling constraints by adopting composite exponential filtering function
- Numerical simulations of the process of multiple shock-flame interactions
- Analytical and finite-element study of optimal strain distribution in various beam shapes for energy harvesting applications
- The comparative analysis of rocks’resistance to forward-slanting disc cutters and traditionally installed disc cutters
- Modal parameter identification of flexible spacecraft using the covariance-driven stochastic subspace identification(SSI-COV)method
- New method for oblique impact dynamics research of a flexible beam with large overall motion considering impact friction force

