区域生态系统健康动态评价
——以毛集生态实验区为例
杨 阳,蔡怡敏,白艳莹,陈卫平,杨秀超
1 中国科学院生态环境研究中心 城市与区域生态国家重点实验室,北京 100085 2 中国科学院地理科学与资源研究所, 北京 100101 3 淮南市毛集区科技局,淮南 232181
区域生态系统健康动态评价
——以毛集生态实验区为例
杨阳1,蔡怡敏1,白艳莹2,*,陈卫平1,杨秀超3
1 中国科学院生态环境研究中心城市与区域生态国家重点实验室,北京1000852 中国科学院地理科学与资源研究所, 北京1001013 淮南市毛集区科技局,淮南232181
区域生态系统健康状况对区域可持续发展具有重要意义。基于“系统和谐”理念,构建区域生态系统健康评价体系,对毛集生态试验区生态系统及其4个子系统健康水平和演进趋势进行量化分析。结果表明:5年尺度上社会系统得分受人口健康水平及民众幸福感知强度制约而增幅不大;经济系统得分提高迅速,增幅达到149.5%,但负外部效应明显;自然系统健康水平先降低再增加,主要受湖泊生物多样性下降影响;风险系统得分先降低再增加,自然-经济-社会耦合系统发展失衡是导致风险水平激增的主要原因。区域生态系统健康各年评价结果均为亚健康隶属,正向隶属先增大后减小,环境负荷增大是造成区域生态系统弹性减弱,敏感性增强,发展活力降低的主要原因。
区域生态系统;风险系统;整合模型;动态评价;模糊数学
区域生态系统健康是指其系统内多样性景观和有机组分保存完整,物质流与能量流循环有序,并对长期或突变的自然及人为扰动造成的代谢耗散保持弹性和稳定性[1-2]。通过对区域生态系统及其子系统健康水平的诊断,可以了解区域景观功能的发挥情况,寻找系统发展的障碍因素,提出系统协调优化对策,实现生态系统可持续发展的生态合理性、经济有效性和社会接受性[3-5]。随着生活水平的提高,人们对生态系统功能的需求趋于多元化,工业发展、生产养殖、生态旅游等逐步成为区域景观服务于当地社会及经济发展的重要内容[6]。而频繁的人为扰动造成区域生态系统补水不足,植被退化,景观单调贫乏、异质性变大,生态系统功能退化严重。作为社会可持续发展的重要保障,区域生态系统健康受到国内外学者的广泛重视[7-9]。目前,有关区域生态系统健康的研究主要集中在环境质量、水文因素驱动、景观转移风险、动植物种群丰度等单一系统组分或生态单元[10-12],忽略了引发系统劣质化和无序化的风险系统,这在对具有多重功能的区域生态系统进行测评时方案代表性不强,易造成指标信息量缺失、也使评价结果变得抽象、片面,缺少说服力[5]。本文以淮南市毛集生态实验区为研究对象,运用层次分析、模糊数学、GIS空间分析及DEA效益分析等方法建立起一套区域生态系统健康的多指标动态测评体系,对研究区生态系统及自然、社会、经济、风险4个子系统健康发展水平进行定量分析,结果可为区域可持续发展提供科学参考,对其他生态系统健康评价也具有借鉴作用。
1 评价模型
1.1区域生态系统健康评价体系
引入社会物理学中“系统和谐”理念[13],即生态系统通过内在基本能量燃烧的不断积累朝着熵增的方向演进,演进趋势取决于自然、社会、经济3个非线性过程连续变化的强度、方向和组织性。当系统熵增达到可以跃迁的能量储备,便会在不良代谢因子的点燃下,引发不同尺度的景观无序和劣质化。对系统无序性风险的度量和对约束变量的定量表达有助于对区域生态系统发展现状和演进趋势作出有效的判断和预测[14]。传统评价中常常忽略系统劣质化因子,或只提及一部分,易造成指标信息量损失,使评价结果不够客观。因此本研究提取生态系统中自然、社会、经济3个子系统内的劣质化因子构成风险系统,以识别因人类扰动而造成生态系统结构和功能损伤的不良代谢因子,风险系统得分值越高,对区域生态系统健康胁迫越大。由此建立“自然系统-社会系统-经济系统-风险系统”4个维度的区域健康评价体系。根据Su等[5]及Horwitz等[6]提出的生态系统健康评价策略,结合指标的易得性及国内外研究进展构建区域生态系统健康评价体系(图1),包括1个目标层,4个决策层,16个准则层及相应指标层。运用Delphi法[6]进行指标筛选和调整,并通过Pearson相关分析(P<0.05)对指标层重复指标进行剔除,所选具体指标见表1。

表1 区域生态系统健康评价指标体系
a: 休闲旅游价值计算中设游客逗留时间最少为1 d,生态容量为300 d,机会工资为一般工资成本工资1/3;b: 所用指标为毛集实验区与相邻区县(八公山区、寿县、颍上县、凤台县)的各年相应数据; c: Do为逆指标,代入模型时采用 (8-Si)/(8-Ci) 进行转换
自然系统(B1)健康通过水资源承载力,生态系统服务能力,环境调节能力和生态恢复能力4个特征进行定义[1]。其中水资源承载力(C1)是度量区域水资源可利用总量支撑的社会经济发展规模的重要指标[15],应用模糊识别模型[15]进行计算;生态服务能力可反映区域自然资源物质生产水平[2],考虑到湿地资源在研究区的重要地位,应用湿地单位面积产值(C2)[16]来表示;环境调节能力(C3)反应区域景观应对外界扰动的自我调控能力[17],通过选取相应环境绩效指标进行加权求和来表示(表1);生物多样性是维持自然资源生产力和可再生能力的基础,应用湖泊生物多样性指数(C4)[12]来表示。
社会系统(B2)健康包括人口健康水平[7],公共服务水平[9],城乡和谐发展水平[18]和民众幸福感知水平[19]4个方面。其中人口健康水平(C5)、公共服务水平(C6)和城乡和谐发展水平(C7)计算方法同C3,选取指标见表1,民众幸福感知水平通过幸福感知强度(C8)[19]来表示。
经济系统(B3)通过经济发展规模,经济可持续发展能力,经济发展潜力和科技创新能力4个特征进行定义[18,20]。其中经济发展规模应用经济综合发展指数(C9)[21]表示,经济可持续发展能力(C10)应用DEA效益模型[22]计算,经济发展潜力(C11)应用潜力发展模型[23]计算,科技创新能力[20](C12)计算方法同C3。
风险系统(B4)包括土地利用压力、景观危机触发值、水质污染水平和湖泊富营养化水平4方面[5-6]。其中土地利用压力应用土地转移程度综合指数(C13)[24]表示;景观危机触发值(C14)用来度量区域生态系统退化趋势,危机触发值越高,系统无序化和劣质化水平越高,可通过选取不同系统劣质化因子进行加权求和来表示(表1),指标选取及权重大小通过专家打分获得;水质污染水平采用水体污染指数(Nemerow指数)(C15)[25]表示;湖泊富营养化水平采用富营养化指数(C16)[25]来表示。

图1 区域生态系统健康多指标评价体系Fig.1 System structure of evaluation index of regional ecosystem health方框里的数值为各子系统权重
1.2计算方法
模糊数学被广泛应用于降低生态系统不确定性的评价研究中[8]。在模糊集合设定的基础上,根据各准则层运算结果,结合国内外相关文献的建议和规划值将各指标评价等级标准划分为疾病、一般病态、亚健康、健康、很健康5个层次(表2)。通过模糊数学隶属函数建立各子系统评价矩阵Ri及复合系统评价矩阵Rt,评价结果为评价矩阵与相应权重的线性相乘。风险系统隶属函数采用升半梯形公式,其余子系统隶属函数采用降半梯形公式[8]。评价指标权重由Delphi法[6]结合层次分析模型获取[10]。按不同模型要求计算准则层各指标得分,标准化后进行加权求和即为相应决策层及目标层得分。目标层计算和模糊评价时对风险系统得分进行逆向转换。
2 研究案例
2.1区域概况
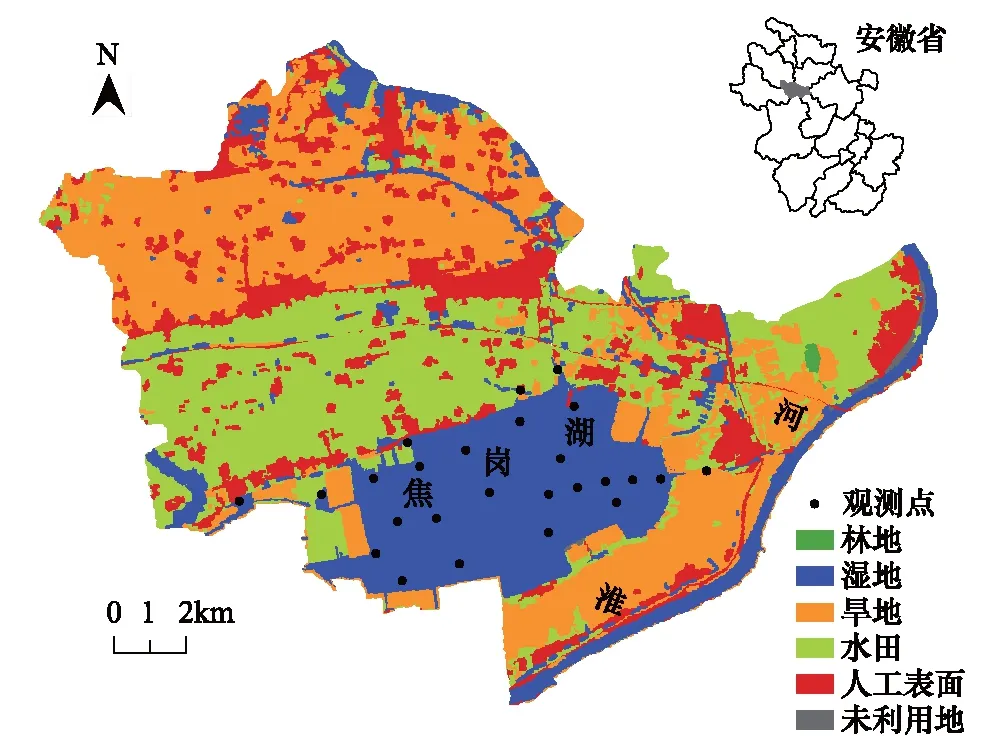
毛集生态实验区位于安徽省北部,淮河与西淝河交汇处(图2),年均降水量905.2 mm,为亚热带季风气候。辖区内湿地、煤炭、生物资源丰富,有着被誉为淮河变迁“活化石”之称的皖北第一淡水湖——焦岗湖[26]。近年来,以区域生态资源为依托,研究区建成“国家区域公园”,“可持续发展示范区”,“生态旅游观光区”等绿色产业,有效的推动了当地生态文明建设及经济发展的进程[26]。然而随着人口增长,旅游开发及部分乡镇工业的发展,该地环境负荷增大,湿地面积萎缩,区域生态服务功能退化,其生态系统健康受到政府和民众的广泛关注。
2.2数据获取与分析

图2 研究区土地利用格局及水质观测点 Fig.2 The land-use pattern of ecosystem and monitoring points in the study area
根据《安徽省统计年鉴》、《淮河片水资源公报》、《淮南市统计年鉴》、《淮南水资源公报》、《毛集实验区志》、《毛集区统计公报》获取2009—2013年研究区75组数据样本(表1);土地利用数据来自中国科学院数据云(www.csdb.cn);水质数据来自当地水利部门监测(图2);民众幸福感知强度数据由调查问卷获得(采用李克特5分制量表[19],共发放问卷550份,回收492份,核查得有效问卷448份,有效率81.4%,各维度一致性信度系数均在0.736—0.847之间[19])。
原数据根据各模型要求进行不同量化处理,影像数据处理采用ENVI 4.8和ArcGIS 10.0,数据统计分析采用SPSS 17.0,DEA效益分析应用Deap 2.1,其余模型运算应用Matlab 7.0。

表 2 区域生态系统健康评价指标分级标准
a: 水资源承载水平(C1)所用测度模型为模糊识别模型,级别划分具体内容参看文献[15];模糊评价时对风险系统指标得分进行逆向转换
3 结果和讨论
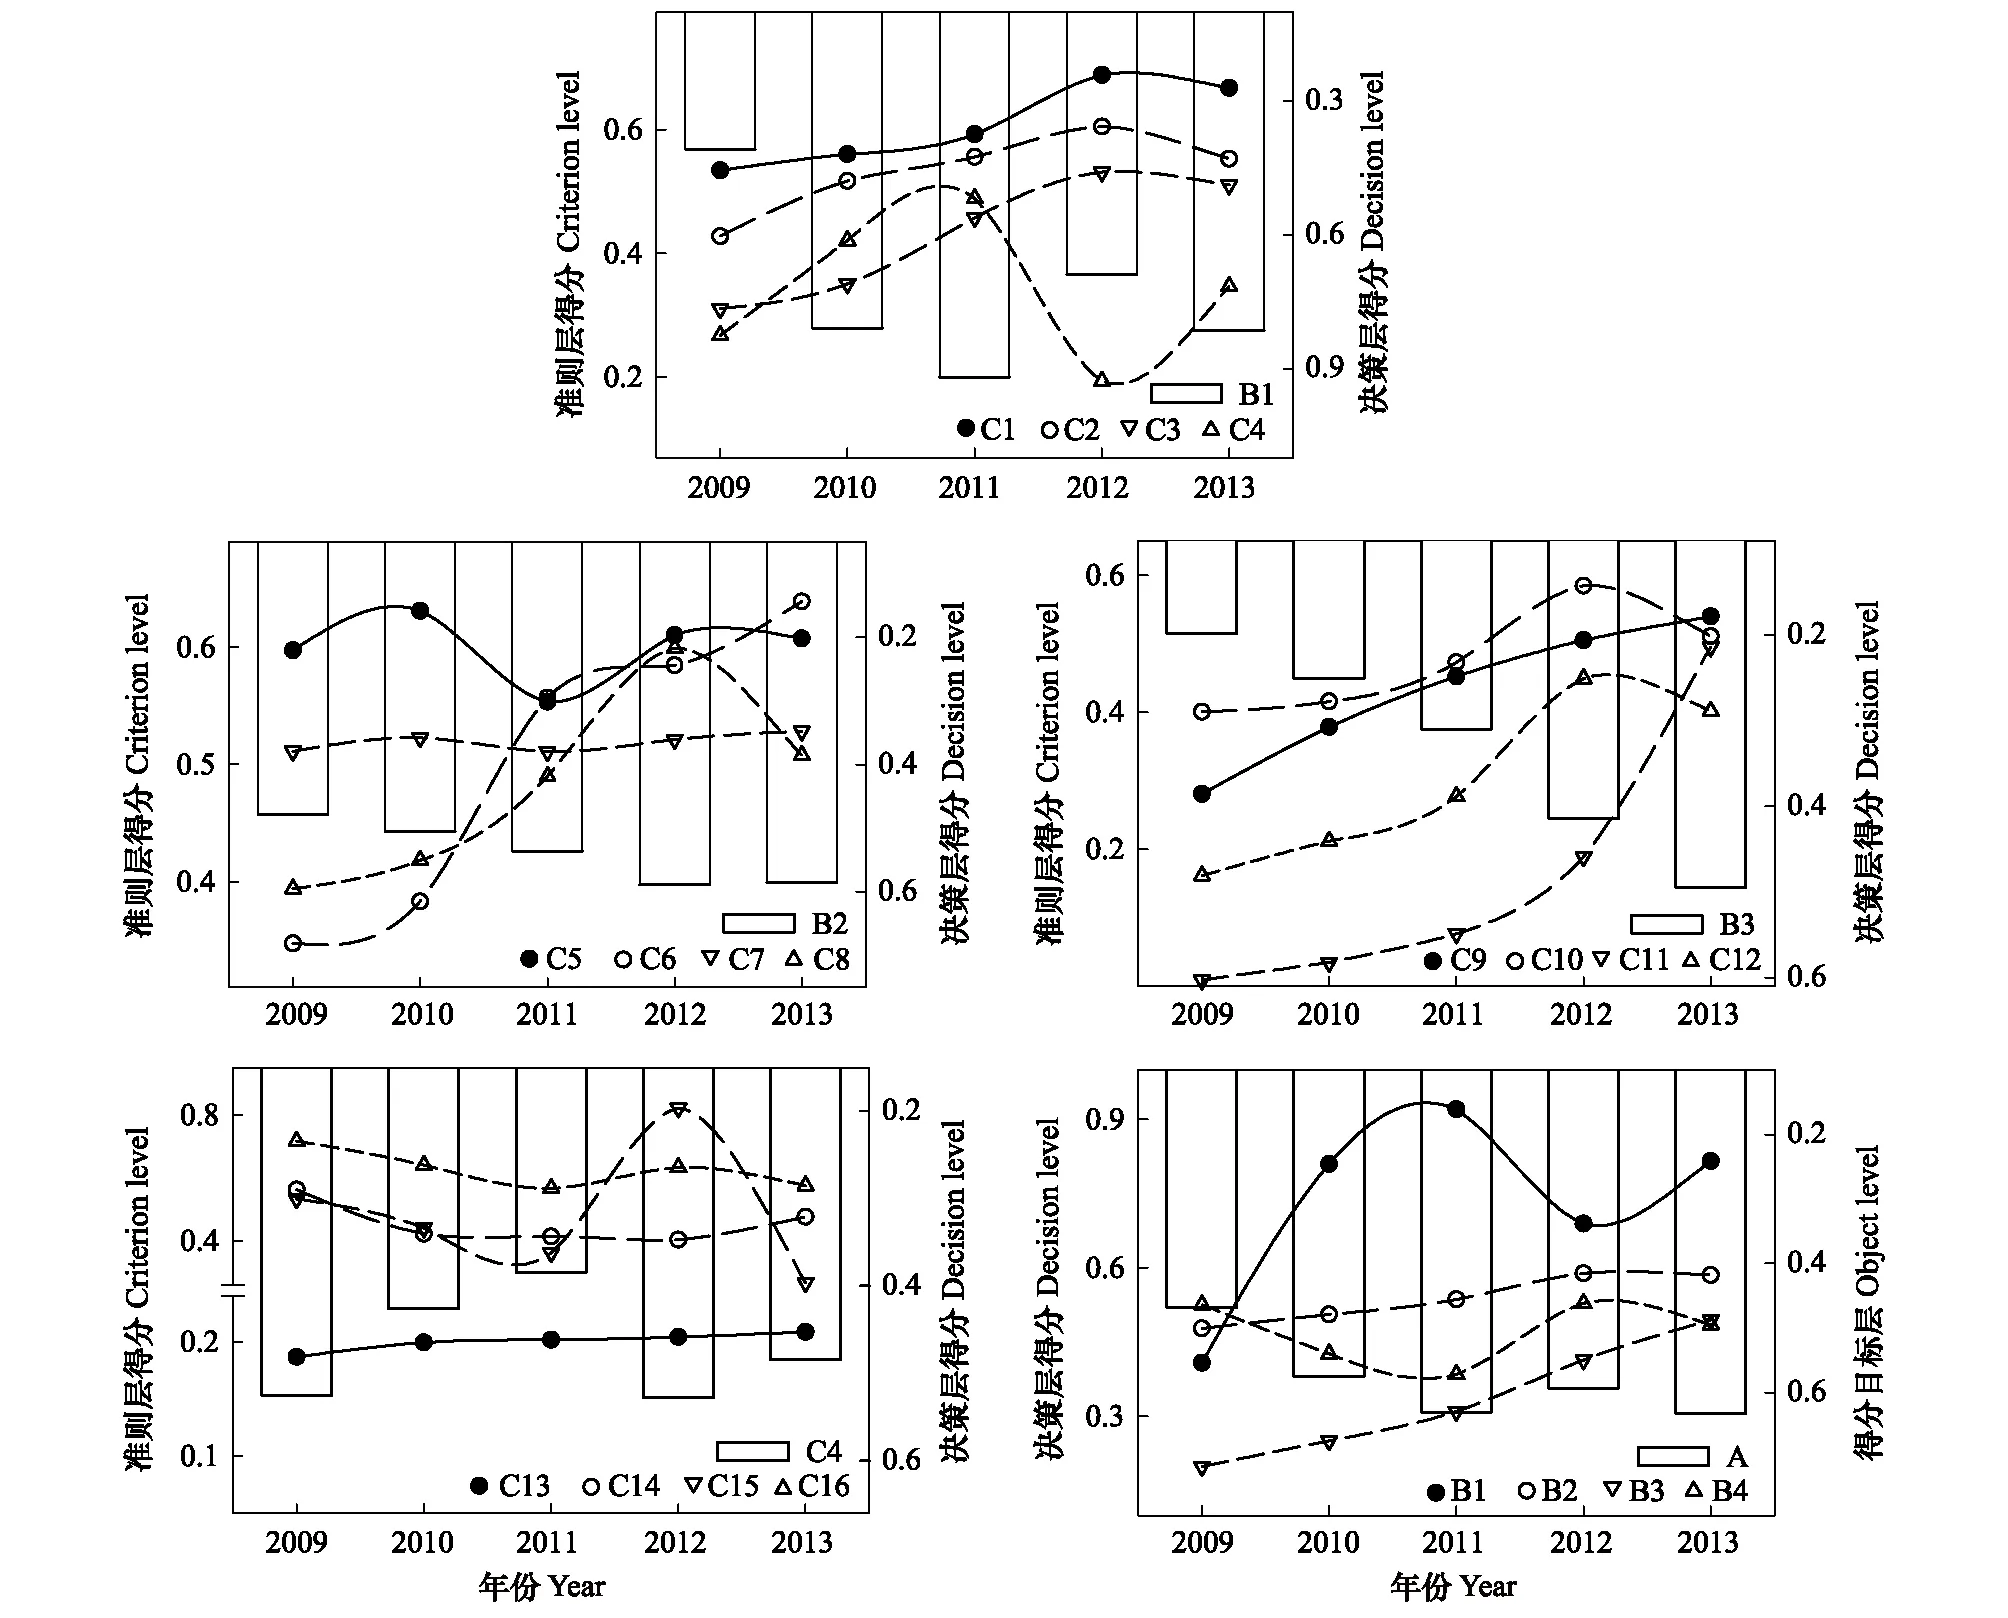
3.1指标体系评价结果
各准则层计算结果如图3所示。5a尺度上各评价指标变化差异较大。引入物理学波峰和波谷概念,不同系统内指标呈现不同组合模式。B1(自然系统)中,除C4变化为明显的峰-谷模式外(2009—2011年为峰,2011—2013年为谷),其他指标变化相对平稳,整体呈上升态势;对B1影响较大的C1(权重为0.1359)在2011年前增长缓慢,2011—2012年增幅明显加大(主要表现在灌溉率下降和生态用水率增加两方面),之后略有下降,整体增幅24.9%。B2(社会系统)中,C6增长幅度较大,C7变化相对平稳,C8呈明显的谷—峰模式(2009—2011年为谷,2011—2013年为峰)。对该系统影响最大的C5(权重为0.1174)呈现峰-谷-峰模式,2011年C5为5年来最低(受新生儿死亡率和人口老龄化制约),此后开始回升,较2009年整体增幅不大(1.7%)。B3(经济系统)中,各指标均表现为上升趋势,对该系统影响最大的C9(权重为0.0496)整体增幅为92.4%(由工业总产值和内资引进增加带动),影响次之的C11(权重为0.0454)增幅高达5439.5%(由产业梯度增加带动)。B4(风险系统)中, C15变化为谷-峰模式,2012年达到5年来最差水平(3 图3 5年尺度上各系统健康水平动态变化Fig.3 The dynamic changes in multi-indicators assessment of regional ecosystem at 5 years scale 为统一分析,C2,C4,C8,C11,C15,C16等6项指标按比例调整到[0,1]区间 2009—2013年B2 (社会系统)和B3 (经济系统)得分均呈稳定上升趋势,增幅分别为22.5%和149.5%;B1 (自然系统)和B4 (风险系统)表现出明显的逆向协调性,前者先上升后下降,后者则由风险下降转变为风险上升;区域生态系统健康 (A)得分为0.47—0.63,整体表现为增长趋势(增幅35.2%)。2009—2011年,研究区社会和谐程度、环境绩效和经济活力水平逐步上升,系统风险降低。2011年后,自然系统对社会系统和经济系统的支持力开始小于后者对其的压力,区域资源供给能力下降,环境风险升高,生态系统发展活力受到抑制。 3.2区域生态系统健康模糊评价 模糊评价结果如图4所示。5a尺度上,B1(自然系统)健康水平除2009年为Ⅱ级(一般病态)隶属外,其它年份均为Ⅲ级(亚健康)隶属,但各级隶属度变化较大(图4)。2011年B1健康水平最高,有52.5%为Ⅲ级,31.7%处于Ⅱ级,3.0%处于Ⅰ级(病态);2012年Ⅰ级隶属增大为20.4%,Ⅱ级为23.5%,Ⅲ级隶属降为40.0%;2013年Ⅲ级隶属略有回升,但Ⅱ级隶属增大到30.0%。可见区域景观受人类扰动在逐年增强,目前可提供一定的生态服务功能,但系统弹性减弱,敏感性增强,有少量生态异常现象出现。 B2(社会系统)各年度健康水平均为Ⅲ级隶属,无Ⅰ级和Ⅴ级(非常健康)隶属。Ⅲ级和Ⅱ级隶属均呈先增高再减小的趋势,其中2013年Ⅳ级隶属为5a中最高(21.1%);虽然公共服务水平(C6)有了大幅度提高,但人口压力(C5)的增加、老龄化现象(C5)的日趋明显、城乡贫富差距(C7)的扩大、民众幸福感知水平(C8)降低等问题也逐渐出现。当前,研究区社会系统基本稳定,劣质化程度较低,为确保其进一步的可持续发展,应在继续完善公共服务水平的基础上,整合社会有序能力,提高社会抗逆性,将社会系统应急管理关口前移至危机发生的萌芽状态。 B3(经济系统)健康水平除2009年为Ⅰ级隶属外,其它年份均为Ⅲ级隶属,以2012年和2013年变化最为显著,均无Ⅰ级隶属,Ⅲ级隶属度分别为2009年Ⅲ级隶属的2.9和3.0倍。整体来看虽然Ⅲ级隶属度逐渐增加,但资源能耗(C10)较大,绿色经济效益(C10)整体水平不高。考虑到污染累积的放大效应,决策者应警惕“高增长、高污染”的赶超型经济带来的环境风险。同时,科技创新能力(C12)与东部同等级区县相比仍有很大的提升空间[23]。在目前经济增长形势良好的情况下,当地政府应通过积极有效的经济 政策引导企业走科技含量高,能源消耗低,经济效益好的“生态工业”道路,充分发挥区位资源优势,为区域可持续发展打好微观基础。 B4(风险系统)各年均无失控风险(I级)和萌芽段风险(Ⅴ级)隶属。2009年系统风险值较高(Ⅱ级隶属13.9%,Ⅲ级隶属61.5%),2010—2011年风险水平持续降低, 2011年为低风险(Ⅳ级)隶属(41.8%)。2012年风险激增至高风险隶属(37.5%处于Ⅱ级,31.4%处于Ⅲ级),环境负荷增大是区域系统风险增加的主要原因。同时,风险水平的多变(图3)也说明了研究区生态系统敏感性较强,增长活力易受到抑制。2013年风险水平略有下降,但仍为中高等风险。为降低区域生态系统风险水平,在今后社会经济发展同时,研究区应加强生态建设和环境保护,明确区域主体功能分区,提高环境资源利用效益,达到自然-社会-经济系统的高水平耦合。 区域生态系统健康(A)各年综合评价均为亚健康隶属(Ⅲ级),正向隶属呈上升趋势(图4)。说明研究区5年来“因地制宜,减灾消贫,绿色发展,提升观念”的举措[26]在自然、社会、经济3方面均取得了一定的进展。2009年各系统健康水平较低, Ⅰ级隶属和Ⅱ级隶属所占组分较高(13.7%和21.2%),此时,毛集生态实验区正处于社会发展转型后期(2000年—2009年),当地生态文明系统建设很不稳定,环境建设、市政基础、人口健康水平较低,区域生态风险较高。2010年开始,随着环境质量提升,公共设施改善,经济的快速发展,生态建设开始略有成效,区域生态系统有序性增强,失控风险隶属下降明显。到2011年,生态文明建设的加强,有效改善了区域景观片段化格局,系统弹性增大,景观格局趋于合理,风险水平持续降低。2011年后,“毛集速度[26]”的负外部效应增加,自然-经济-社会3个子系统协调度出现震荡,系统风险水平激增,劣质化速度提升。目前,系统对外界干扰及其内部的涨落较为稳定,系统代谢与耗散水平在可控范围内,但较大的环境负荷和生态风险水平的攀升应引起决策者足够重视。 本研究在“系统和谐”的理念基础上,借助多个评价指标量化区域景观发展水平和趋势,从自然系统-社会系统-经济系统-风险系统4个维度构建一个系统的、完整的、连续的识别区域生态系统健康的时空谱,反映区域生态功能现状,对其他生态系统健康评价也有决策指导意义。 案例分析说明研究区2009—2011年在环境绩效、社会和谐、经济活力等三方面取得了一定进展,2011年后自然-社会-经济耦合系统发展失调造成区域生态系统稳定性下降,运转风险升高,可持续发展活力受阻。培育生态资源禀赋,提高社会系统抗逆性,转变经济发展模式应作为保护与提升研究区生态系统健康的主要措施。 [1]Costanza R. Ecosystem health and ecological engineering. Ecological Engineering, 2012, 45: 24-29. [2]Helfenstein J, Kienast F. Ecosystem service state and trends at the regional to national level: A rapid assessment. Ecological Indicators, 2014, 36: 11-18. [3]Vo Q T, Kuenzer C, Vo Q M, Moder F, Oppelt N. Review of valuation methods for mangrove ecosystem services. Ecological Indicators, 2012, 23: 431-446. [4]Sims A, Zhang Y Y, Gajaraj S, Brown PB, Hu Z Q. Toward the development of microbial indicators for wetland assessment. Water Research, 2013, 47(5): 1711-1725. [5]Su M R, Fath B D, Yang Z F. Urban ecosystem health assessment: A review. Science of the Total Environment, 2010, 408(12): 2425-2434. [6]Horwitz P, Finlayson C M. Wetlands as settings for human health: incorporating ecosystem services and health impact assessment into water resource management. BioScience, 2011, 61(9): 678-688. [7]Wolf K L, Blahna D J, Brinkley W, Romolini, M. Environmental stewardship footprint research: linking human agency and ecosystem health in the Puget Sound region. Urban Ecosystems, 2013, 16(1): 13-32. [8]Prato T. Assessing ecosystem sustainability and management using fuzzy logic. Ecological Economics, 2007, 61(1): 171-177. [9]Li Y F, Li D. Assessment and forecast of Beijing and Shanghai′s urban ecosystem health. Science of the Total Environment, 2014, 487: 154-163. [10]Herath G. Incorporating community objectives in improved wetland management: the use of the analytic hierarchy process. Journal of Environmental Management, 2004, 70(3): 263-273. [11]Bradley B A. Assessing ecosystem threats from global and regional change: hierarchical modeling of risk to sagebrush ecosystems from climate change, land use and invasive species in Nevada, USA. Ecography, 2010, 33(1): 198-208. [12]Salas F, Neto J M, Borja A, Marques J C. Evaluation of the applicability of a marine biotic index to characterize the status of estuarine ecosystems: the case of Mondego estuary (Portugal). Ecological Indicators, 2004, 4(3): 215-225. [13]Glymour C. Social science and social physics. Behavioral Science, 1983, 28(2): 126-134. [14]牛文元. 基于社会物理学的社会和谐方程. 中国科学院院刊, 2008, 23(4): 343-347. [15]王海峰, 胡吉敏, 李春燕. 淮河流域水资源承载能力综合评价. 人民长江, 2010, 41(6): 53-57, 60. [16]王凤珍, 周志翔, 郑忠明. 城郊过渡带湖泊湿地生态服务功能价值评估——以武汉市严东湖为例. 生态学报, 2011, 31(7): 1946-1954. [17]Jasch C. Environmental performance evaluation and indicators. Journal of Cleaner Production, 2000, 8(1): 79-88. [18]Kwan M P, Murray A T, O′Kelly M E, Tiefelsdorf M. Recent advances in accessibility research: Representation, methodology and applications. Journal of Geographical Systems, 2003, 5(1): 129-138. [19]史兴民, 刘戎. 煤矿区居民的环境污染感知——以陕西省韩城矿区为例. 地理研究, 2012, 31(4): 641-651. [20]Singh R K, Murty H R, Gupta S K, Dikshit A K. An overview of sustainability assessment methodologies. Ecological Indicators, 2009, 9(2): 189-212. [21]史亚琪, 朱晓东, 孙翔, 李扬帆, 魏婷. 区域经济-环境复合生态系统协调发展动态评价——以连云港为例. 生态学报, 2010, 30(15): 4119-4128. [22]Li X G, Yang J, Liu X J. Analysis of Beijing′s environmental efficiency and related factors using a DEA model that considers undesirable outputs. Mathematical and Computer Modelling, 2013, 58(5/6): 956-960. [23]王娇, 马克明, 杨柳, 唐荣丽. 北京郊区县经济发展潜力及其对景观格局与河流水质的影响. 生态经济, 2010, (11): 39-43, 47-47. [24]Liu J Y, Liu M L, Zhuang D F, Zhang Z X, Deng X Z. Study on spatial pattern of land-use change in China during 1995-2000. Science in China Series D: Earth Sciences, 2003, 46(4): 373-384. [25]Yu S, Wang M Y. Comprehensive evaluation of scenario schemes for multi-objective decision-making in river ecological restoration by artificially recharging river. Water Resources Management, 2014, 28(15): 5555-5571. [26]中国可持续发展研究会. 里约之新——国际可持续发展新格局、新问题、新对策. 北京: 人民邮电出版社, 2012: 128-137. A dynamic evaluation of regional ecosystem health using a multiple index system: a case study of Maoji Biosphere Reserve YANG Yang1, CAI Yimin1, BAI Yanying2,*, CHEN Weiping1, YANG Xiuchao3 1StateKeyLaboratoryofUrbanandRegionalEcology,ResearchCenterforEco-EnvironmentalSciences,ChineseAcademyofSciences,Beijing100085,China2InstituteofGeographicSciencesandNaturalResourcesResearch,ChineseAcademyofSciences,Beijing100101,China3Science&TechnologyBureauofMaojiDistrict,Huainan232181,China The health of regional ecosystem is the key element for sustainable socio-economic development and the base for friendly environment. With rapid urbanization, intensification of agriculture, and industrial production, the influence of human activities on regional ecosystems is increasingly apparent. The anthropogenic disturbances of regional ecosystems cause a series of problems: resource destruction, environmental pollution, ecological deterioration, soil and water losses, and frequent disasters. The evaluation of regional ecosystem health has been the hotspot of the present research in ecology. Several indicators have been employed to measure the changes in ecosystem functions, but most of the studies are focusing only on environmental pollutants and economical conditionals, neglecting the nonlinear process involving the comprehensive natural and socio-economic systems at different scales. Based on the theoretical foundation of system science, landscape ecology, and management science, we built a dynamic evaluation system, comprising one object layer, four decision layers, and 16 criterion layers. The key indicators involving the natural, social, and economic data were employed to assess the fitness level of the ecosystem and other four subsystems (social system, environmental system, economical system, and risk system) quantitatively. In the case study, the ecosystem health of the Maoji Biosphere Reserve was evaluated by using the proposed method. Results carried out on a 5-year scale indicated that the health condition of the social system increases but at a modest rate and it is limited by the population health level and the happiness perception intensity. The health condition of economic system soared to 149.5% in just 5 years, but with a significantly negative effect. Two key factors in this subsystem, the comprehensive economic development index (with a weight of 0.0496) and the potential economic development index (with a weight of 0.0454), experienced a 92.4% and 5439.5% expansion, respectively. The health condition of the nature fluctuated 15% in a peak-to-trough pattern, and it was inversely correlated with the risk system. The biodiversity decreased, resulting in the less resilient nature subsystem. Shaking of the comprehensive socio-economic and natural system led to the surge of the risk index in 2011.The health condition of the regional ecosystem belonged to class III (ordinary level) each year; positive membership degree first increased and then decreased. These results showed that the study area progressed greatly toward achieving a harmonious society and vigorous economy in the past 5 years. Nevertheless, the stress effect of strong human disturbance on regional ecosystem enhanced the system′s sensitivity and landscape fragmentation mainly by the pressure from environmental contamination. The management of the Maoji Biosphere Reserve will focus on the strategies in cultivating the natural endowment of ecology, improving the resistance of the social system, and optimizing the economic structure. Proposed model yields satisfactory results in evaluation of fitness conditions of the regional ecosystem in the study area. This approach plots a time spectrum of regional system change systemically, integrally, and insistently, and it can be applied to assess other similar ecosystems. regional ecosystem; risk system; integrated model; dynamic assessment; fuzzy model 安徽省科技攻关项目(1301042120) 2014-12-11; 网络出版日期:2015-10-30 Corresponding author.E-mail: baiyy@igsnrr.ac.cn 10.5846/stxb201412112455 杨阳,蔡怡敏,白艳莹,陈卫平,杨秀超.区域生态系统健康动态评价——以毛集生态实验区为例.生态学报,2016,36(14):4279-4287. Yang Y, Cai Y M, Bai Y Y, Chen W P, Yang X C.A dynamic evaluation of regional ecosystem health using a multiple index system: a case study of Maoji Biosphere Reserve.Acta Ecologica Sinica,2016,36(14):4279-4287.
4 结论

