Uncertainty profile for NIR analysis of tanshinone Icontent in tanshinone extract powders
Zhong Xue,Bing Xu,2,Chan Yang,Xin Wang,Fei Sun,Xin-Yuan Shi,2,Yan-Jiang Qiao,2*
1Beijing University of Chinese Medicine,Beijing,100029,China.2 Beijing Key Laboratory of TCM Manufacturing Process Control and Quality Evaluation,Beijing Municipal Science&Technology Commission,Beijing,100029,China.
Introduction
Since 2004,the United States Food and Drug Administration (FDA) has encouraged the pharmaceutical industry to apply process analytical technology(PAT)tools to strengthen the understanding of the manufacture processes and to obtain the quality information of drug products[1].The near infrared(NIR)spectroscopy as a fast and non-destructive PAT technique has gained more and more attention in recent years.And many studies had been reported about NIRS successfully applied in quality control of Chinese herbal medicines(CHMs)[2-4].
With the development of modern analytical technology,tremendous amount of chemical and physical data generated by near infrared was calling for multivariate data analysis methods.Variable selection techniques have played a key role in data-driven approaches.Liang and his co-workers confirmed the importance and significance of variable selection in complex analytical systems[5,6].Variable selection can improve the prediction performance of the NIR analytical method,provide faster and more cost-effective predictors by reducing the model complexity and computation load and provide a better understanding and insight into the relationship between the NIR spectra and the interested quality attributes of the CHMs[7,8].
However,except for the advantage of NIR method for CHMs,it has high detection limit and low sensitivity[9,10].And CHMs have low active pharmaceutical ingredients(API).So,a robust NIR model should be developed and validated for determination of API in a pharmaceutical intermediate or product.Conventionally,a NIR analysis model was evaluated according to traditional chemometrics criteria,such as the correlation coefficients(r)of calibration and validation,the root mean square error of calibration(RMSEC),the root mean square error of cross validation(RMSECV)and the root mean square error of prediction(RMSEP),etc.However,there is no information about the suitability of these criteria for achieving the method’s intended purpose and no evaluation of the reliability of the analytical results that will be produced by them in the method’s future routine applications.In addition,it does not give information about the range of concentration over which the method is providing results of acceptable accuracy.Thus in 2004,the accuracy profile(AP)was brought forward by the SFSTP(La Societé Francaise des Sciences et Techniques Pharmaceutiques)[11-13],and was used in the many NIR analysis method[14-16].
The AP method is based on the combination in the same graph of the tolerance interval and the acceptable limits,and circumvents some of drawbacks of the traditional validation procedures.Compared with the traditional approach,the AP approach not only simplifies the validation process of an NIR analytical procedure,but also allows monitoring the utilization risk for CHMs.
In order to guarantee the quality of the results of the analytical method for CHMs,the measurement uncertainty becomes an important parameter for assessing the performance of an analytical method so as to be considered as the analytical validation.In 2013,Saffaj introduced a novel method to estimate the measurement uncertainty [17]. Meanwhile the uncertainty profile (UP) was recommend for assessment of the validity of analytical procedures as well as estimation of the uncertainty of chemical measurements without any extra effort.The assessment of measurement uncertainty was achieved by the β-content tolerance interval,and then the uncertainty profile was built to validate each investigated concentration level of the analytical method.The UP approach that gathered validation and uncertainty in the same time allows the analyst to control the risk of the analytical method in routine use and to have full information about its performance.
Salvia miltiorrhiza is one of the most popular CHMs and has a huge consumer market for the pharmaceutical and health care products in China.Tanshinone I is one of the main contents in tanshinone extract of Salvia miltiorrhiza.To the best of our knowledge, there are no studies about the determination of tanshinone I in Salvia miltiorrhiza extract by NIRS.In the present study,the tanshinone I content in Salvia miltiorrhiza extract was determined by NIR method combined with different variable selection methods.And the UP approach was applied for the evaluation and quality control of the NIR analytical method for tanshinone I content in tanshinone extract.
Theory
Uncertainty computation
In accordance with the LGC/VAM protocol[18]and recommendations form the ISO/DTS 21748 guide[19],a basic model for the uncertainty estimation of the measured Y,can be expressed by Eq.(1):

Whereis the reproducibility standard deviation;)is the uncertainty associated with the bias of the method;andis the sum of all of the effects due to other deviations.
When Feinberg[20]has used the concept of accuracy profile and validation data to estimate the measurement uncertainty,he has ignored the third term of Eq.(1).Well,uncertainty can be expressed by the following equation:

The accuracy profile can be built using the tolerance interval(Feinberg,2007).This interval is equal to:

Where,k is a coverage factor.The value of the factor k is based on the level of confidence desired.For the confidence level of 95%,k approximates 2.t(ν)is the(1+γ)/2 quantile of the Student’s t distribution with νdegrees of freedom.For balanced data set,νcan be estimated by the Satterthwaite formula[22].Thus it can be easily verified that:

And the mathematical model that brings the uncertainty and the tolerance interval is given by:

Note that:
By virtue of Eq.(5),we can write that

Finally,the uncertainty can be expressed as

h is the higher limit of the tolerance interval,and l is the lower limit of the tolerance interval.
β-content tolerance intervals calculation by the Hoffman-Kringle approach
To calculate the uncertainty limits expressed in Eq.(8),the β-content tolerance intervals via the Hoffman-Kringle approach were used.This strategy was based on the Modified Large Simple(MLS)procedure[23].
To illustrate this methodology in balanced one-way random model,it is defined that:

is the between conditions variance andis the within conditions variance(repeatability).They can be easily got by ANOVA analysis through the validation data.m isthe number of series,n is the number of independent replicates per series.
Wecan write

The MLS upper confidence limit foris given by:
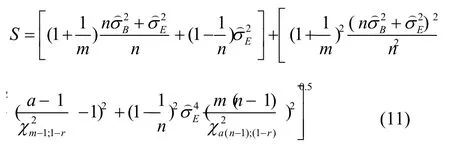
A tolerance interval at the confidence levelγis thus given by:

Where Z(1+β)/2 is(1+β)/2 quantile of the standard normal distribution.
Uncertainty profile building procedure
After calculating the uncertainty through Eq.(1),we have used the following formula to build the uncertainty profile.

is the estimate of the mean results.lis the acceptance limits.
The overall uncertainty limits can be written as follows:

is the true value or the reference value.H is higher uncertainty limit.L is lower the uncertainty limit.
The proposed uncertainty profile building procedures are as follows:
1)Set acceptance limits(-λ,+λ).
2) Determination of the uncertainty for each concentration level using Eq.(1).
3)Construct the uncertainty limits according to Eq.(14)and make 2D-graphical representation results for the acceptability and uncertainty limits.
4)Compare the interval of uncertainty(L,U)to the acceptance limits(-λ,+λ)
5)If(L,U)falls completely within(-λ,+λ),the method is accepted;otherwise,the method is not accepted.
Experimental
Materials
The Salvia miltiorrhiza extracts were purchased from Xi’an Honson Biotechnology Co.,Ltd.(Xi’an,China),Xi’an Changyue Phytochemistry Co.,Ltd(Xi’an,China)and Shanxi Undersun Bimedtech Co.,Ltd,and others were self-produced.The tanshinone I standard(lot number:150105)was purchased from Beijing Fang Cheng Biological Technology Co.,Ltd.(Beijing,China).HPLC grade acetonitrile and phosphoric acid were purchased from Fisher Scientific(USA).And the pure water was purchased from Wahaha Co.,Ltd.(Hangzhou,China).
Spectroscopic data
The NIR spectra were collected in integrating sphere diffuse mode with an Antaris Nicolet FT-NIR system(Thermo Fisher Scientific Inc.,USA).Each sample spectrum was the result of average 64 scans with the resolution 8 cm-1 between 10000 and 4000 cm-1 at ambient temperature.A background spectrum was taken daily in air.All NIR spectra were collected and archived using the Thermo Scientific Result software.
HPLC analysis
The reference method used for the tanshinone I determination was HPLC assay recommended by the Chinese Pharmacopoeia(Ch.P.,2010 Edition).An Agilent 1100 HPLC apparatus equipped with a quaternary solvent delivery system,a DAD detector,an auto sampler and the HP workstation for data processing was used.The separation was performed by the reverse phase chromatography on an Agilent XDB C18 column(4.6× 250 mm,5μm)with gradient elution at 25◦C.The mobile phase A is acetonitrile and the mobile phase B is phosphoric acid water(0.026%).The elution procedures are as follows:0~25min,60%~90%A; 25~30min,90%~90%A;30~31min,90%~60%A;31~40min,60%~60%A.The flow rate was 1.2 mL·min-1 and the detection wavelength was 270 nm.
The samples after NIR scanning were dissolved by methanol properly.Then the solution was filtered through a Millipore membrane filter with an average pore diameter of 0.45μm before being injected into the HPLC system.
Calibration and validation protocols
4 g of tanshinone powder extract sample was weighed and was then directly measured by NIR under the conditions specified in Section 3.2.And a total of 102 samples were used in the calibration set.
The validation protocol used the“6×3×3” full factorial experimental design. Six different concentration levels for tanshinone I,i.e.1.18%,2.55%,5.02%,9.40%,15.16%and 19.84%(w/w),were investigated.And each concentration level was performed in 3 replicates on 3 different days,resulting in 54 samples in the validation set.And all the validation samples were from different batches of tanshinone extract in the calibration set.
Data Processing
Different spectra pre-processing methods were used and compared to build the PLS model.Multiplicative signal correction(MSC)and standard normal variate(SNV)were used to eliminate the impact of light scattering generated by the uneven distribution of the particles size.The first derivative(1st)and second derivative(2nd)treatments for spectral data were to eliminate the spectral baseline drift,strengthen band characteristics and overcome overlapping bands.The Savitzky-Golay (S-G) smoothing and wavelet de-nosing of spectra(WDS)were used to effectively smooth the high frequency noise,improve the signal to noise ratio and reduce the noise impact.
After spectroscopy pretreatment,different variable selection methods such as interval partial least square(iPLS)[24],synergy interval partial least square(SiPLS),uninformative variables elimination(UVE)[25],successive projections algorithm(SPA)[26,27]and competitive adaptive reweighted sampling(CARS)[28]were used to select sensitive variables.
Software
SIMCA-P 11.5(Umetrics,US)and Unscrambler 7.0(CAMO,Norway)softwares were used to perform spectral pretreatments.The calibration models based on PLS (Partial Least Squares)regression were developed on Matlab 7.0(Mathwork,USA)with PLS Toolbox 2.1(Eigenvector Research Inc.,USA).The iToolbox used to run iPLS and SiPLS was downloaded from http://www.models.kvl.dk/.The codes for both UVE and CARS algorithms are publicly available at http://code.google.com/p/carspls.A graphical user interface for SPA is available at http://www.ele.ita.br/∼kawakami/spa/.The uncertainty calculation was realized using homemade programs based on Matlab 7.0.These programs were compiled in the form of Matlab function files according to the principles and steps described in Section 2.The inputs are the NIR predicted values and reference analysis values at each concentration of the validation experiments,and the outputs are directly the uncertainty limits.
Results and discussion
Quantitative analysis of tanshinone I by HPLC method
For quantitative consideration,calibration curves based on the concentration range from 0.18 to 39.58(%,w/w)for tanshinone I were established upon 9 consecutive injections of different concentrations.Regression equation calibrated was y=241.94 x+6.0117(r=0.9999,n=9)with y being the peak area in mAU and x being the concentration.
NIR method development
The 102 samples from the calibration protocol described in Section 3.5 were divided into the calibration set(68 samples)and the validation set(34 samples)by the Kennard-Stone(K-S)method.The following parameters were calculated to evaluate the success of model performance:the r for both calibration and validation sets,RMSEC,RMSECV,RMSEP and RPD.When the r value is closer to 1,the model developed is better.And the smaller values of RMSEC,RMSECV and RMSEPalso indicated that theNIRS method had good quantitative performance.In addition,for quantitative considerations,the RPD value needs to be greater than 3.

Table 1 Comparison of different spectra data preprocessing methods
Spectra pretreatment
Different spectral pretreatment methods were investigated in order to improve the prediction ability of NIR method.As seen in Table 1,the NIR spectra with SNV preprocessing are found to bear the good capability in both calibration and validation.
Variable selection
After spectroscopy pretreatment,iPLS,SiPLS,UVE,SPA,CARS algorithms were used to select sensitive variables, eliminate the redundant information,extracting useful information about the tanshinone I and improve the PLS model performance.
The iPLS algorithm was applied to calibration data,the raw spectrum was divided equally into different numbers of sub-intervals from 5 to 40.The optimal interval number was chosen according to the lowest RMSECV.As seen in Fig.1,the favorite number of interval is 16,and the corresponding sub-interval selected is 1699-1814 nm.
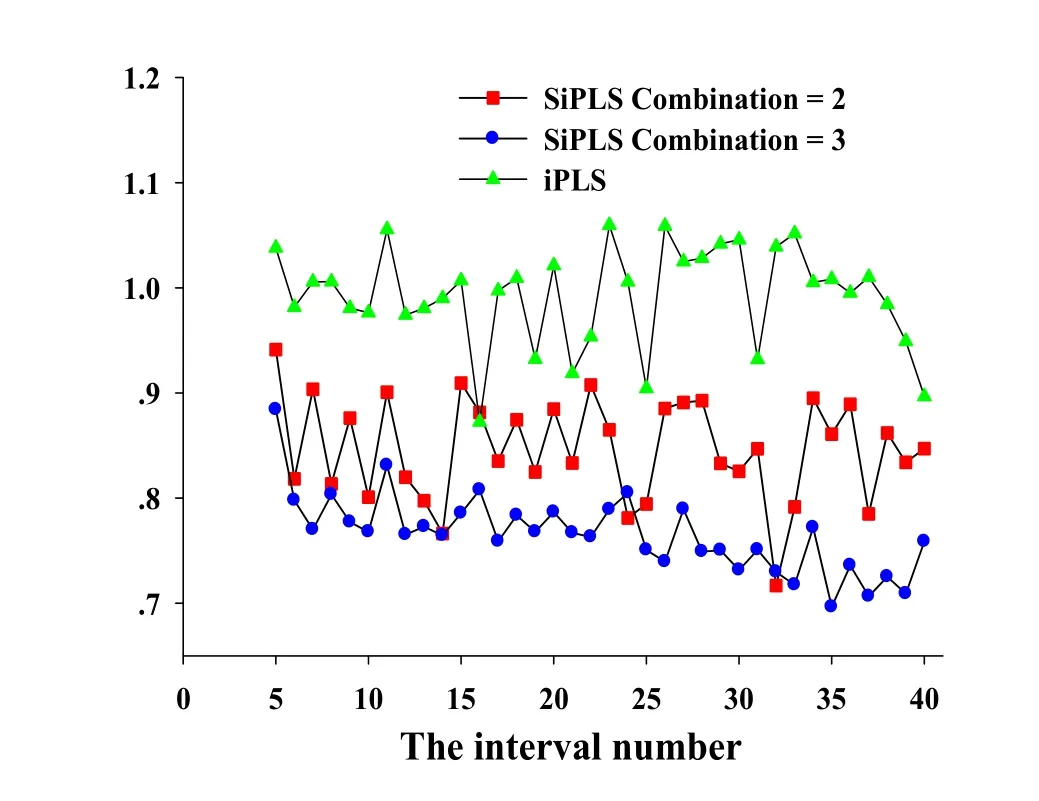
Figure 1 Results of the iPLS and SiPLS with different sub-interval numbers.
For the SiPLSalgorithm,the number of combination of intervals was set to 2 and 3,respectively.And the result is shown in Fig.1.We can see that the optimal interval number was 35 when the number of combination was set at 3.The selected variables corresponded to 1113-1134 nm,1283-1310 nm and 1693-1743 nm.
As for the CARS method,the group number for cross validation was set at 5,and the number of Monte Carlo sampling runs was set at 50,and the pretreatment method was mean centering.Result of the CARS method for tanshinone I related variables selection is displayed in Fig.2.Fig.2(a)indicates that the changes of spectral variables are selected in the process of variable selection.Fig.2(b)shows the trend of RMSECV values during the process of variable selection.It could be seen that with the increasing of the numbers of sampling, the selected spectral variables were decreased gradually,while the RMSECV values decreased first and then increased,indicating that the variables selection process eliminated useless or redundant variables first and then gradually eliminated useful variables.Fig.2(c)reveals the changes of the spectral regression coefficients during the process of variables selection and the different colorful lines are different variables for selection.The position of“★”corresponds to 35 sampling runs as shown in the Fig.2(c).And a total of 15 spectral variables are retained for 35 sampling runs as shown in the Fig.2(a).
The result of SPA for tanshinone I related variables selection is displayed in Fig.3.When the numbers of variables for model increased from 2 to 21,the root mean square error(RMSE)values of tanshinone I content decreased rapidly,suggesting that the PLS model should contain at least 21 useful spectral variables.When modeling variables number continued to increase,the RMSE values changed smoothly.Therefore,using the SPA variable selection method,a total of 21 spectral variables was finally retained.
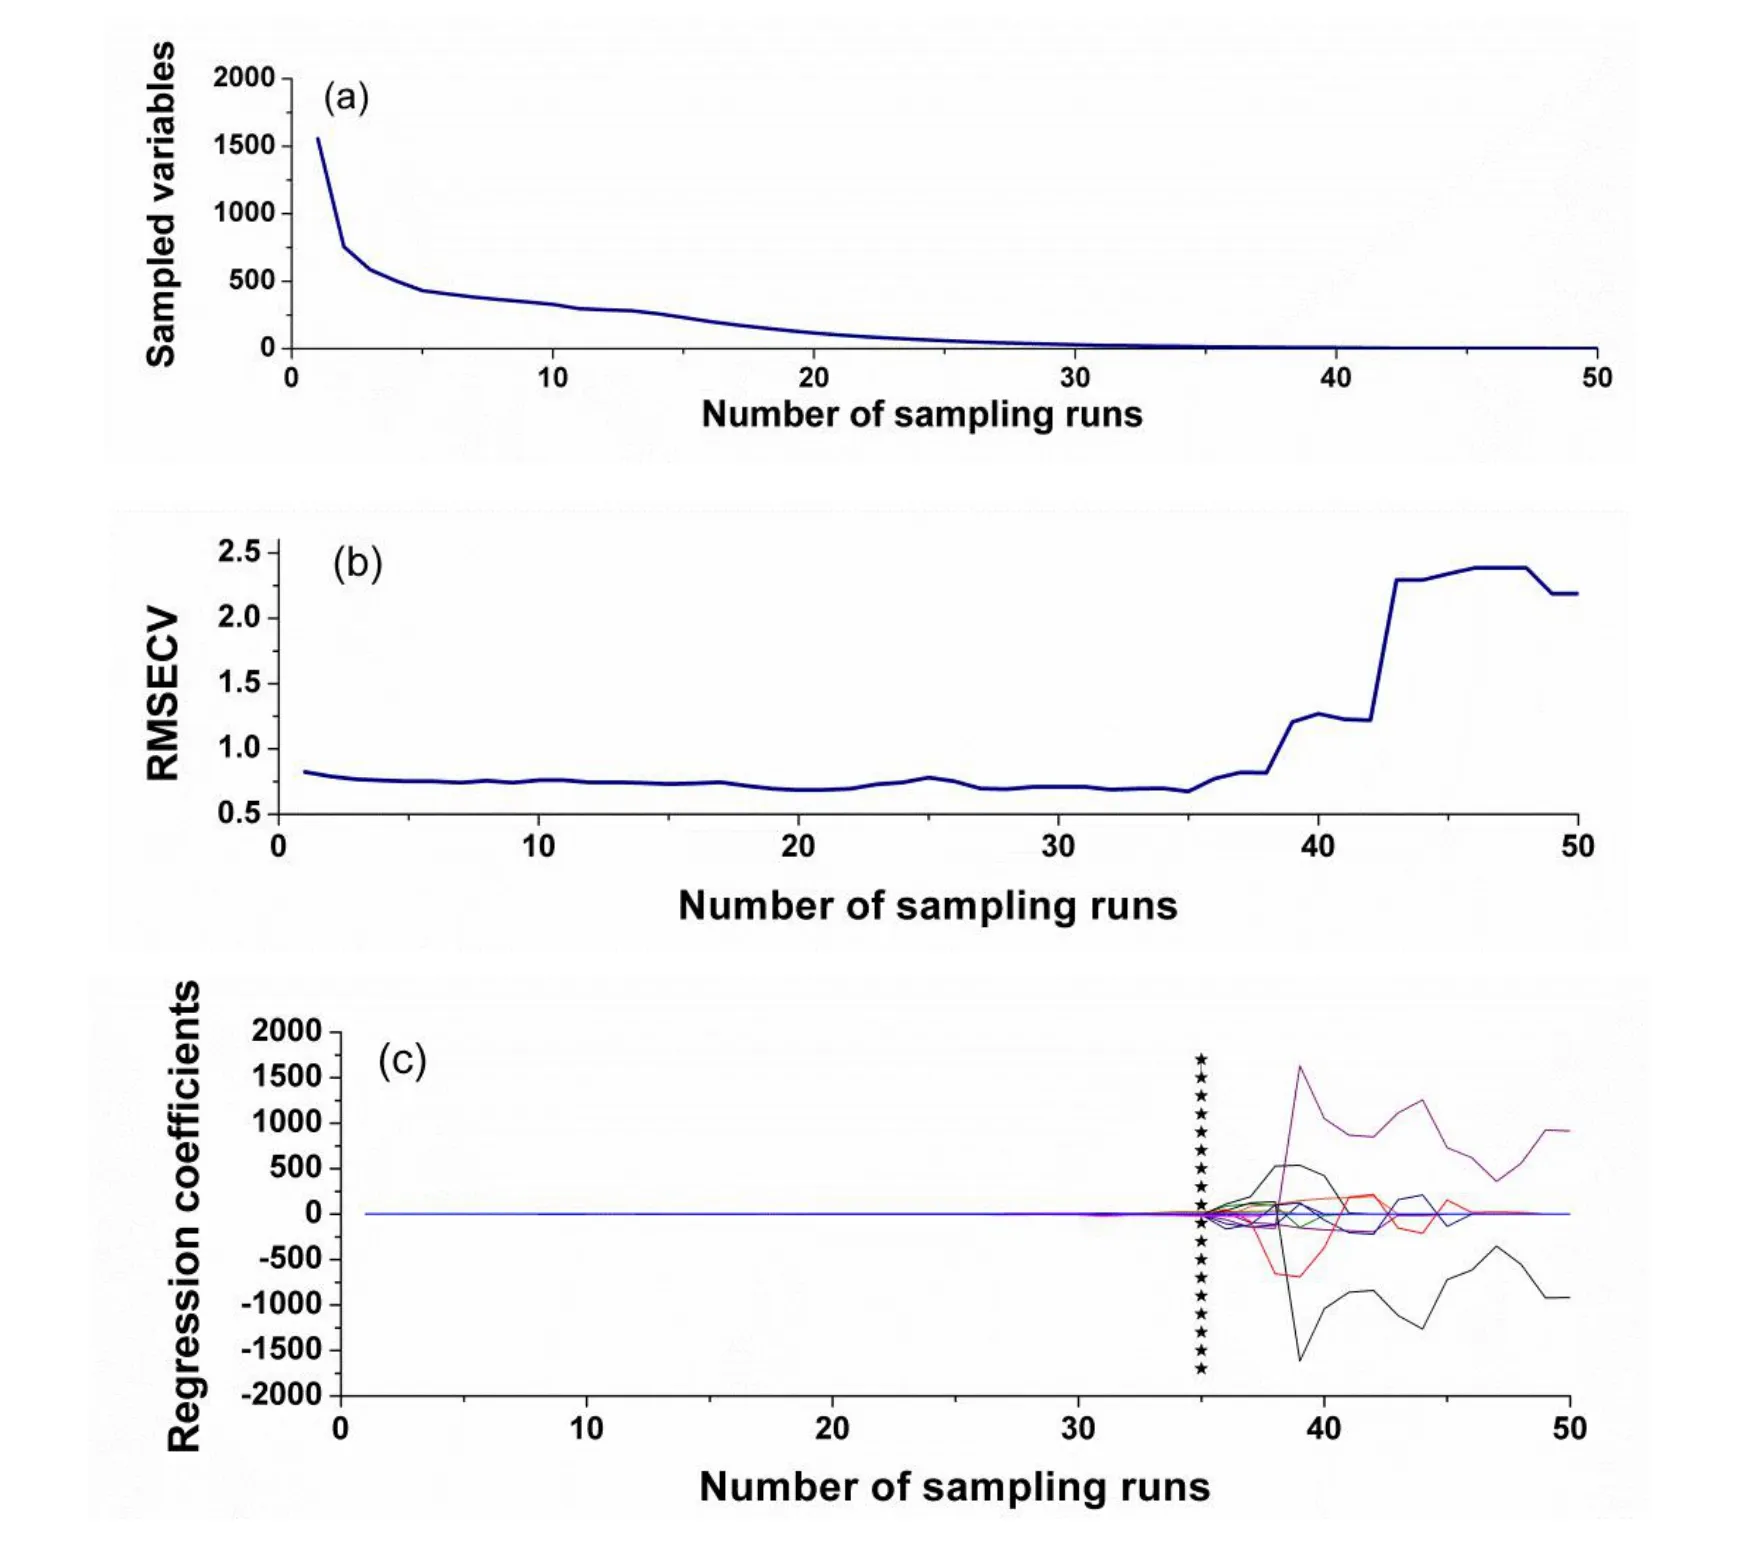
Figure 2 Results of the CARS method on tanshinone Ispectra.
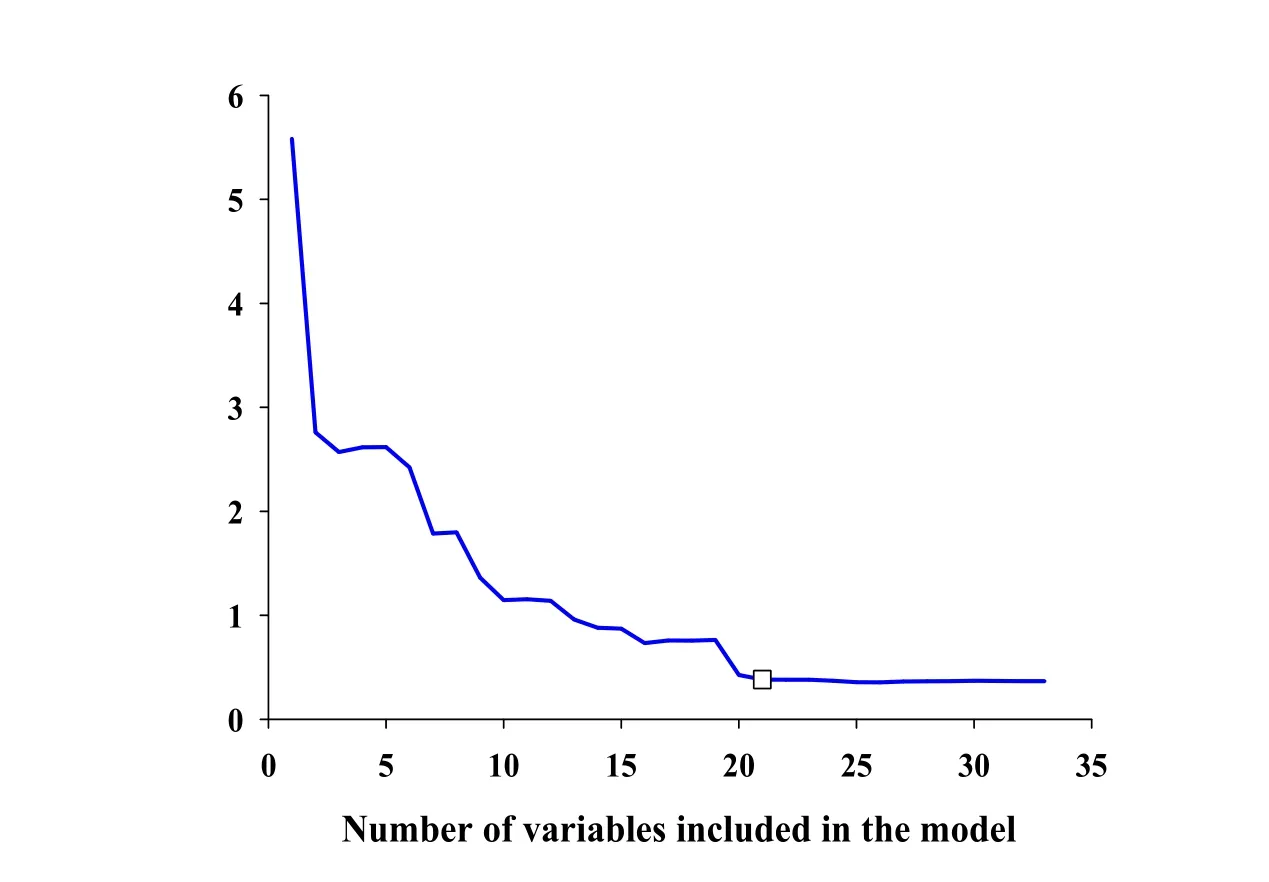
Figure3 Results of the SPA method on tanshinone Ispectra.
As for the UVE,1557 random noise variables were added to the spectral matrix,where the number of noise variables was the same as the number of variables in the raw spectrum.And 99%of the largest absolute value of random noise variable stability was selected as the threshold of variables selection.Fig.4 shows the result of UVE for tanshinone I related variables selection on spectrum.The left side of this graph represented spectral variables,and random noise variables were put in the right side,where the vertical line was the dividing line.The horizontal medium dashed lines were the upper and lower thresholds for UVE variables selection.Variable stability values of spectral variables beyond the horizontal medium dashed lines would be as useful information and the corresponding variables was retained. While the spectral variables between the two horizontal medium dashed lines would be useless or redundant information to be removed.After UVE variables selection,a total of 473 spectral variables were retained.
Models building and selection
After tanshinone I related variables selection on the SNV preprocessed NIR spectra,PLS models were established for different variables selection methods.As seen from Table 2,the UVE method is superior to other variables selection methods and is used for building the PLS models.
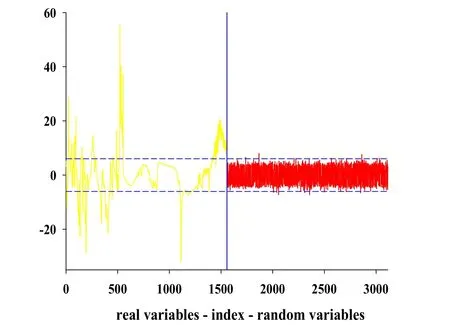
Figure 4 Results of the UVE method on tanshinone Ispectra.
Uncertainty assessment and method validation
The results of predicted concentrations of validation samples and the uncertainty were shown in Table 3.To compute the β-content, γ-confidence tolerance intervals and build the uncertainty profile,we opted for the 4-6-λrule proposed by the FDA for the validation of bioanalytical methods[29].And Hoffman and Kringle had translated this rule intoβ=66.7%andγ=90%[24,30,31].Due to the quality control of Chinese herbal medicines is similar to that of biological products,the acceptance limits(-λ,+λ)were set at±20% for the validation of the NIR analysis of tanshinone Icontent in the tanshinone extract[32,33].
As shown in the Table 3,with the decrease of tanshinone I concentrations,the expanded uncertainty and the uncertainty limits become larger.This coincided with fact that the total error(i.e.the systematic error and random error)was often large at the relatively low concentrations.However,the uncertainty limits did not exceed the acceptance limits settled at±20%for all concentration levels,including the lowest one(1.18%)as exposed in the Fig.5.That indicated that the accuracy and uncertainty of the developed NIR method were accepted over the concentration range studied.In other words,the NIR method for analyzing tanshinone I content in tanshinone extract can be considered as valid and reliable within the investigated concentration range.
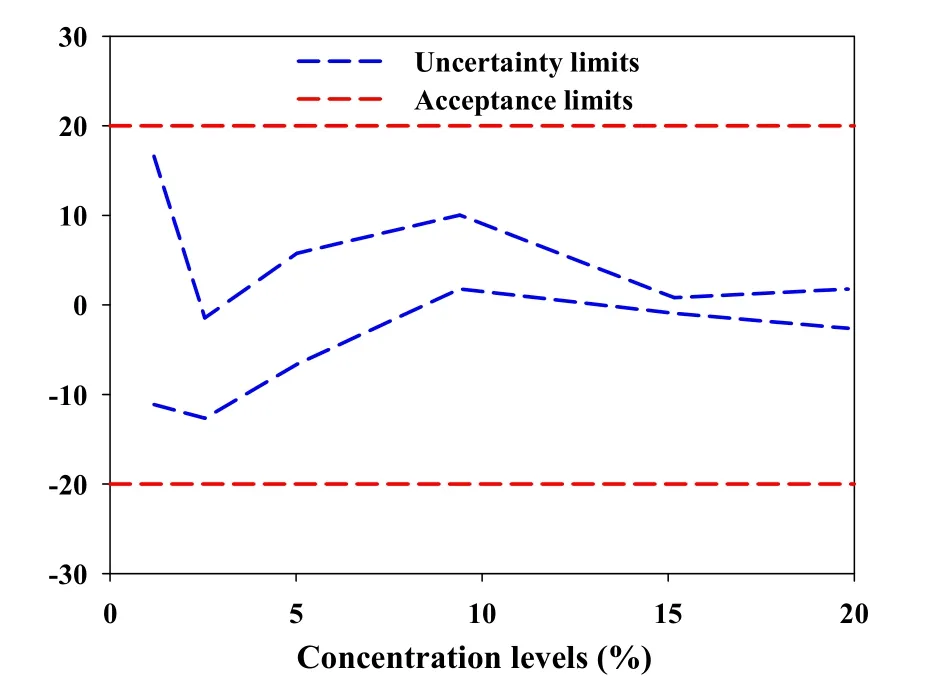
Figure 5 Uncertainty profile for NIR determination of tanshinone I content.

Table 2 PLS results for different variables selection methods after data preprocessing
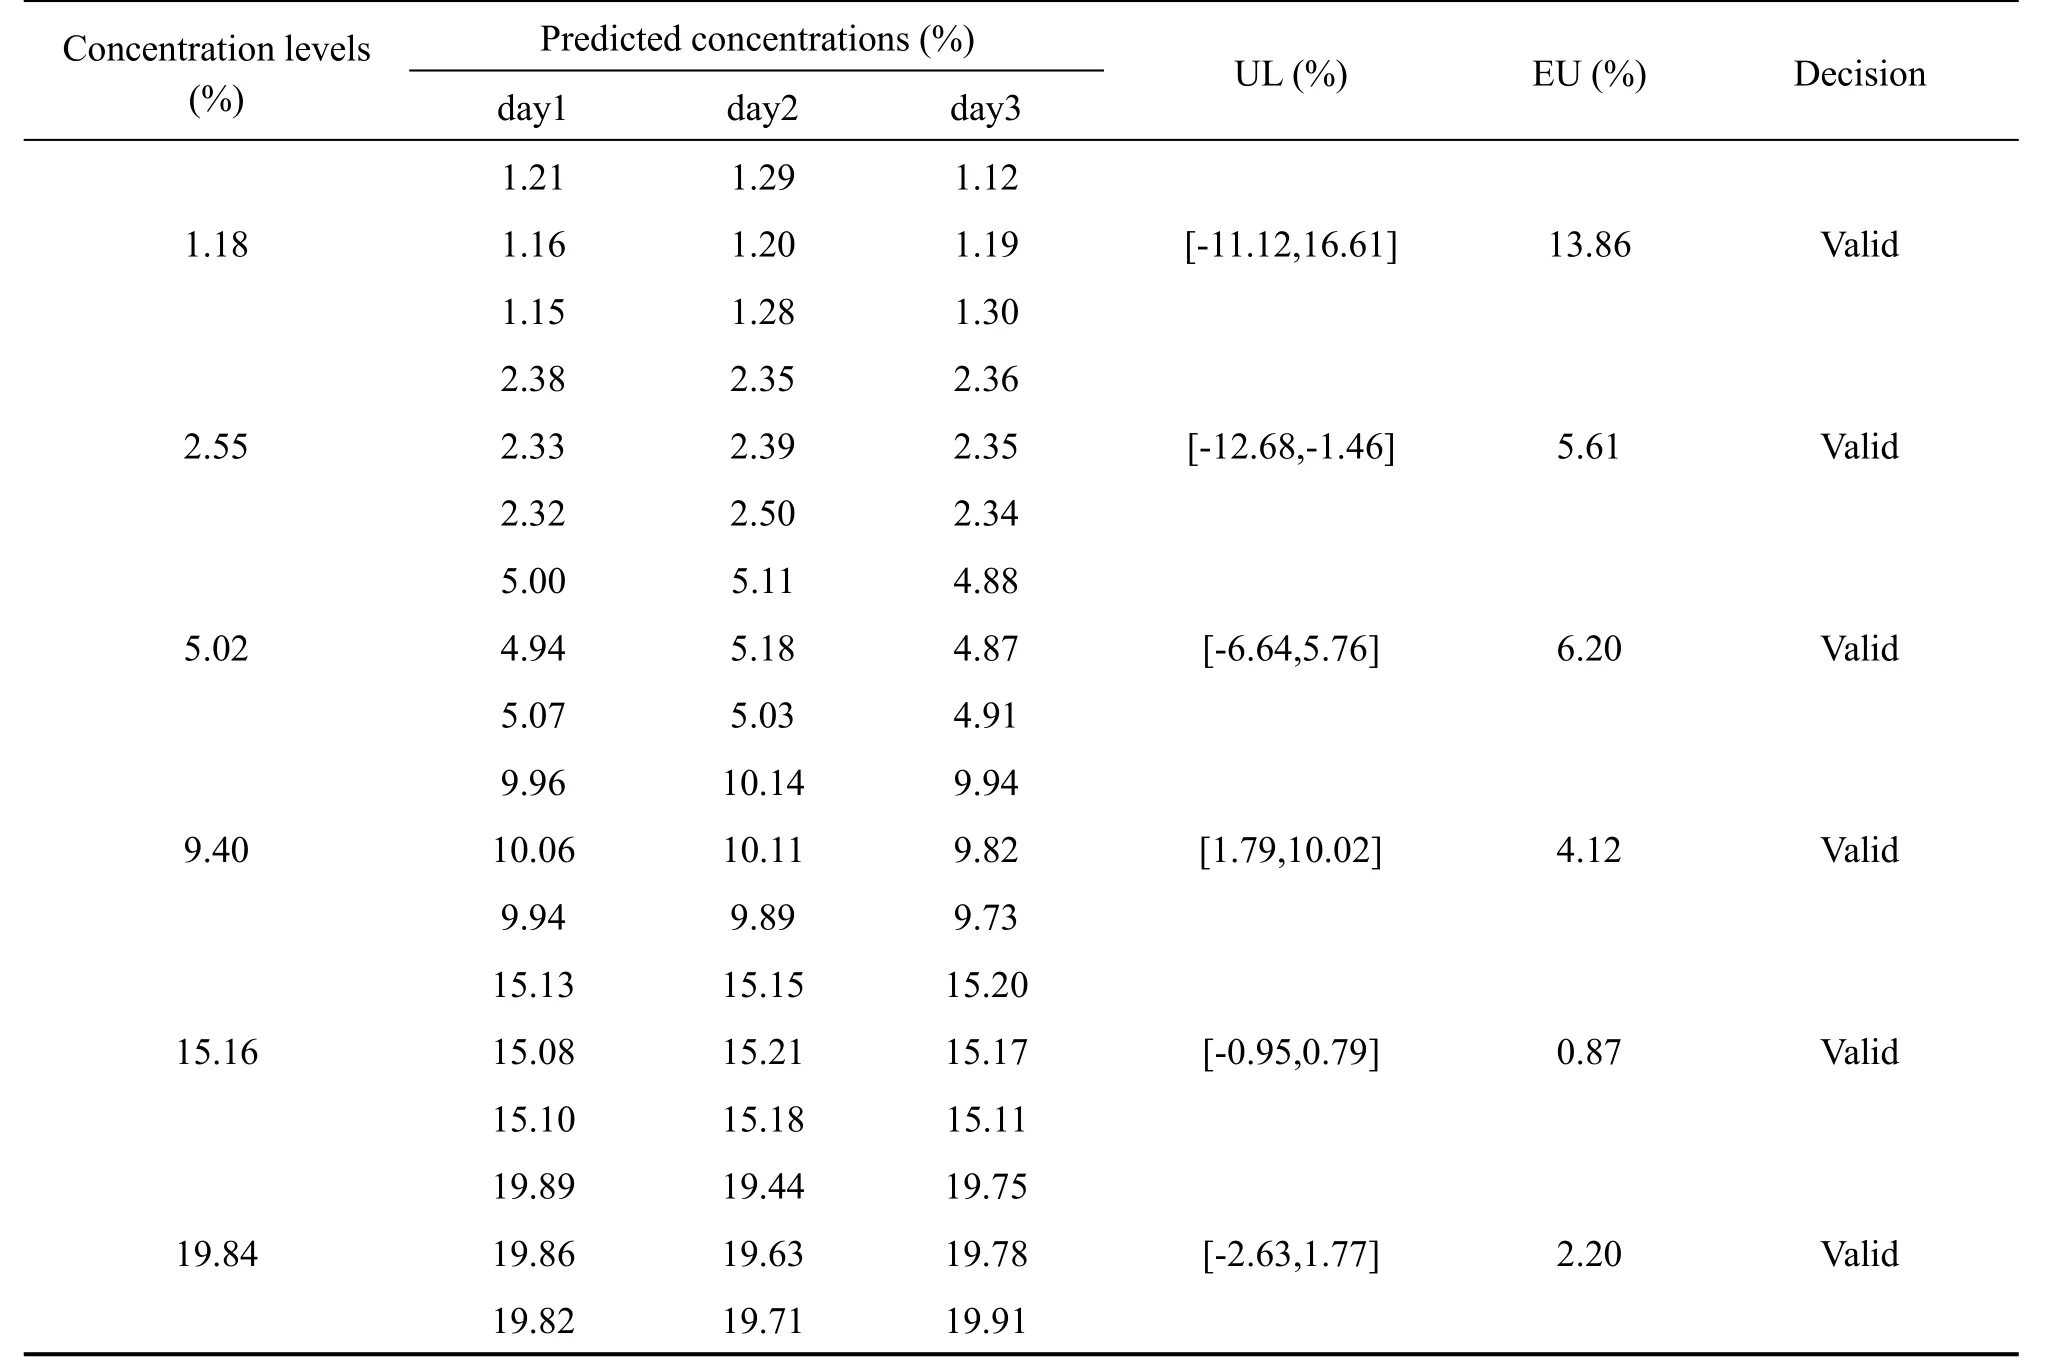
Table 3 Uncertainty evaluation for the validation results

Table 4 Uncertainty evaluation for the validation results without UVE
The uncertainty without UVE
To prove the advancement of the UVE variable selection for the NIR method,the uncertainty and UP without UVE variables selection of the NIR method completed.The result was shown in table 4 and Fig.6.As shown in the table 4,the uncertainty limits in the level 1.18(%)was beyond the acceptable limit,so the decision of the method at the level 1.18(%)was invalid and that result will indicate the method at the level 1.18 (%)was not acceptable.From the comparison of Fig.6 and Fig.5,marked differences were visualized.The uncertainty at the level 5.02(%)in the Fig.6 was much larger than the Fig.5.All this showed that the NIR data after UVE variables selection become more effective,and the NIR method after UVE selection variables become more accurate and reliable.

Figure 6 Uncertainty profile without UVE.
Conclusion
The development, uncertainty assessment and validation of the NIR method for quantification of tanshinone Icontent in Salvia miltiorrhiza extract were successfully accomplished. Different variables selection methods were compared to eliminate the redundant information,extract useful features of tanshinone I and improve the model performance.Finally,PLSalgorithms coupled with the UVE method showed the outstanding calibration and prediction performance.Then a global strategy based on the β-content tolerance interval was applied for estimation of measurement uncertainty.After that,the UP approach was constructed to evaluate the performance of NIR method.Results demonstrated the accuracy and reliability of the established NIR method for determination of tanshinone Icontent over the range of all concentration levels studied.
Conflict of Interests
The authors declare that there is no conflict of interests regarding the publication of this paper.
Acknowledgement
This work is supported by Beijing Natural Science Foundation(No.7154217)the Scientific Research Program of Beijing University of Chinese Medicine(No.2015-JYB-XS103)and the Joint Development Program Supported by Beijing Municipal Education Commission-Key Laboratory Construction Project(Study on the Integrated Modeling and Optimization Technology of the Chained Pharmaceutical Process of Chinese Medicine Products.
1.FDA(Food and Drug Administration),Guidance for industry:PAT—A Framework for Innovative Pharmaceutical Development,Manufacturing and Quality Assurance,2004.
2.Jiang Y,David B,Tu PF,et al. Recent analytical approaches in quality control of traditional Chinese medicines—A review,Anal Chim Acta 2010,657(1):9-18.
3.Wu ZS,Xu B,Du M,et al.Fourier transform mid-infrared (MIR) and near-infrared (NIR)spectroscopy for rapid quality assessment of Chinese medicine preparation Honghua Oil,J Pharm Biomed Anal 2008,46(3):498-504.
4.Xu B,Wu ZS,Lin ZZ,et al.NIR analysis for batch process of ethanol precipitation coupled with a new calibration model updating strategy,Anal Chim Acta 2012,720(1):22-28.
5.Li HD,Liang YZ,Long XX,et al.The continuity of sample complexity and its relationship to multivariate calibration:a general perspective on first-order calibration of spectral data in analytical chemistry,Chemometr Intell Lab Syst 2013,122(5):23-30.
6.Yun YH,Liang YZ,Xie GX,et al.A perspective demonstration on the importance of variable selection in inverse calibration for complex analytical systems, Analyst 2013, 138(21):6412-6421.
7.Lorber A, Kowalski BR. The effect of interferences and calbiration design on accuracy:implications for sensor and sample selection,J Chemometr 1988,2(1):67-79.
8.Guyon I,Elisseeff A.An introduction to variable and feature selection,JMach Learn Res 2003,3(6):1157-1182.
9.Swarbrick B,Process analytical technology:a strategy for keeping manufacturing viable in Australia,Vib Spectrosc 2007,44(1):171-178.
10.Luypaert J,Massart DL,Heyden YV.Heyden,Near-infrared spectroscopy applications in pharmaceutical analysis,Talanta 2007,72(3):865-883.
11.Hubert Ph,Nguyen-Huu JJ,Boulanger B,et al.Harmonization of strategies for the validation of quantitative analytical procedures:A SFSTP proposal—part I,J Pharm Biomed Anal 2004,36(3):579-586.
12.Hubert Ph,Nguyen-Huu JJ,Boulanger B,et al.Harmonization of strategies for the validation of quantitative analytical procedures A SFSTP proposal–Part II,J Pharm Biomed Anal 2007,45(1):70-81.
13.Hubert Ph,Nguyen-Huu JJ,Boulanger B,et al.Harmonization of strategies for the validation of quantitative analytical procedures A SFSTP proposal–Part III,J Pharm Biomed Anal 2007,45(1):82-96.
14.Schaefer C,Clicq D,Lecomte C,et al.A Process Analytical Technology(PAT)approach to control a new API manufacturing process:Development,validation and implementation.Talanta 2014,120(4):114-125.
15.Tomuta I, Rus L, Iovanov R, et al.High-throughput NIR-chemometric methods for determination of drug content and pharmaceutical properties of indapamide tablets.JPharm Biomed Anal 2013,84(5):285-292
16.Fonteyne M,Arruabarrena J,de Beer J,et al.NIR spectroscopic method for the in-line moisture assessment duringdrying in a six-segmented fluid bed dryer of a continuous tablet production line:Validation of quantifying abilities and uncertainty assessment,JPharm Biomed Anal 2014,100c(21):21-27.
17.Saffaj T,Ihssane B,Jhilal F,et al.An overall uncertainty approach for the validation of analytical separation methods,Analyst 2013,38(16):4677-4691.
18.Barwick VJ,Ellison LR.VAM Project 3.2.1,Development and Harmonization of Measurement Uncertainty Principles. Part D: Protocol Uncertainty for Evaluation from Validation Data,January 2000.Report No.:LGC/VAM/1998/088.
19.ISO/DTS 21748,Guide to the use of repeatability,reproducibility and trueness estimates in measurement uncertainty estimation,ISO,Geneva,2004.
20.Feinberg M,Boulanger B,DewéW,et al.New advances in method validation and measurement uncertainty aimed at improving the quality of chemical data,Anal Bioanal Chem 2004,380(3):502-514.
21.Feinberg M.Validation of analytical methods based on accuracy profiles,JChromatogr A 2007,1158(1-2):174-183.
22.Mee R, β-Expectation and β-Content Tolerance Limits for Balanced One-Way ANOVA Random Model,Technometrics 1984,26(26):251-254.
23.Hoffman D,Kringle R.Two-sided tolerance intervals for balanced and unbalanced random effects models,J.Biopharm Stat 2005,15(2):283-293.
24.Norgaard L,Saudland A,Wagner J,et al.Interval Partial Least-Squares Regression (iPLS): A Comparative Chemometric Study with an Example from Near-Infrared Spectroscopy,Appl Spectrosc 2000,54(3):413-419.
25.Centner V,Massart DL,deNoord OE,et al.Elimination of uninformative variables for multivariate calibration.Anal Chem 1996,68(21):3851-3858.
26.Araújo MCU,Saldanha TCB,Galvāo RKH,et al.The successive projections algorithm for variable selection in spectroscopic multicomponent analysis,Chemometr Intell Lab Syst.2001,57(2):65-73.
27.Galvāo RHK,Araújo MCU,Fragoso WD,et al.A variable elimination method to improve the parsimony of MLR models using the successive projections algorithm,Chemometr Intell Lab Syst 2008,92(1):83-91.
28.Li H,Liang Y,Xu Q,et al,Key wavelengths screening using competitive adaptive reweighted sampling method for multivariate calibration,Anal Chim Acta 2009,648(1):77-84
29.Food and Drug Administration,Guidance for Industry,Bioanalytical Methods Validation,2001.
30.Hoffman D,Kringle R.A Total Error Approach for the Validation of Quantitative Analytical Methods,Pharma Research 2007,24(6):1157-1164.
31.Hoffman D. Statistical Considerations for Assessment of Bioanalytical Incurred Sample Reproducibility,AAPSJ2009,11(3):570-580.
32.International Conference on Harmonization(ICH),Validation of analytical procedures:text and methodology,Q2(R1),2005.
33.Saffaj T,Ihssane B.Uncertainty profiles for the validation of analytical methods,Talanta 2011,85(3):1535-1542.
 Traditional Medicine Research2016年3期
- Traditional Medicine Research的其它文章
- Explore the medication rules of Chinese medicine of Professor Huang Wenzheng for the treatment of chronic kidney disease based on data mining
- Feiji Recipe Reverses Lung Cancer Immune Escapeby Inhibiting the Expression of IDO
- Computational study of the molecular mechanism of Lonicera japonica organic acidsagainst influenza
- Molecular docking study on the molecular mechanism of rhaponticin for treatment of chronic myelocytic leukemia
- The present treatment and mechanism progress of arsenic trioxide in hematological malignancies
- Traditional Chinese medicine should not beignored during the development of precision medicine with Chinese characteristics
