
基于X射线CT技术快速检测不同含水率状态下的毛竹密度
2016-07-12 13:01王卿平刘杏娥张桂兰杨淑敏田根林尚莉莉马建锋
光谱学与光谱分析 2016年6期
王卿平,刘杏娥,张桂兰,杨淑敏*,田根林,尚莉莉,马建锋
1. 内蒙古农业大学材料科学与艺术设计学院,内蒙古 呼和浩特 010018 2. 国际竹藤中心,竹藤科学与技术重点实验室,北京 100102
基于X射线CT技术快速检测不同含水率状态下的毛竹密度
王卿平1,2,刘杏娥2,张桂兰1,杨淑敏2*,田根林2,尚莉莉2,马建锋2
1. 内蒙古农业大学材料科学与艺术设计学院,内蒙古 呼和浩特 010018 2. 国际竹藤中心,竹藤科学与技术重点实验室,北京 100102
密度是竹材材性的重要指标之一,与竹材诸多物理力学性质紧密相关,且测定结果因含水率状态不同而不同。基于X射线计算机断层扫描(X-CT)技术,比较了不同竹龄毛竹全干、气干、饱水状态下CT值的差异程度,除4年生和10年生毛竹CT值差异较大以外,其余竹龄CT值差异较小; 分别在全干、气干、饱水状态下对所测定的CT值与相应状态下毛竹的密度进行拟合建模,同时还对不同含水率梯度状态下的CT值与密度进行拟合建模,进而系统分析了不同竹龄毛竹在单一含水率状态下和不同含水率梯度状态下CT值与密度之间的关系; 对不同竹龄毛竹全干状态下相对竹青径向位置的CT值进行了拟合,依据CT值与密度之间的关系,解释说明了毛竹径向密度因竹龄不同所产生差异的原因。试验结果表明,毛竹全干、气干、饱水密度与相应的CT值之间均存在线性关系,且拟合斜率相近; 在所选含水率梯度状态下毛竹密度与CT值之间存在线性关系,且密度与CT值关系受水分影响较小,回归方程为:D=0.001H+1.003 2,R2=0.968 3(D为密度,H为CT值),验证模型决定系数R2=0.974 3; 不同竹龄毛竹全干状态下竹青、竹黄处密度差异较小,而在竹肉处差异较大。这些结果为实现快速检测毛竹在不同含水率状态下的密度提供了技术支持和数据参考,同时X射线计算机断层扫描(X-CT)技术也为深入研究竹材材性和构造提供了一种切实可行的新途径。
X射线计算机断层扫描(X-CT)技术; 密度检测; 毛竹; 含水率
引 言
毛竹(Phyllostachysedulis)是我国森林资源的重要组成部分,是降低木材资源消耗的重要生物资源依托。密度是毛竹物理特性的重要指标之一,能够预测力学强度、耐磨性、硬度等物理力学性质,为机械加工提供参考数据。对于竹材密度的传统测量方法有: 直接测量法、排水法、水银容器法等[1]。这些传统测量方法需要复杂的制样程序,使批量化快速检测竹材密度受到一定程度的限制。而X射线计算机断层扫描(X-ray computed tomography,X-CT)技术是计算机与X射线技术相结合的产物,可在不破坏被检物的前提下快速检测其密度,避免了样品制备带来的不便。早在20世纪90年代,瑞典科学家Lindgren就已利用X-CT技术对木材密度进行了比较深入的研究[2-3]。近年来对于竹材密度的研究也渐渐受到国内外学者的普遍重视,Huang等通过X-CT技术分析了毛竹密度分布[4],单海斌等也运用该技术对梁山慈竹(Dendroclamusfarinosus)气干密度与CT值的相关关系进行了研究[5],而目前利用X-CT技术对不同含水率梯度下竹材密度的测定鲜有报道。本文以毛竹为试材,系统分析了不同竹龄毛竹在单一含水率状态和所选不同含水率梯度下密度与CT值之间的关系,并对不同竹龄毛竹密度差异进行了初步分析。
1 实验部分
1.1 材料
采取株高、胸径相差较小,生长正常的2~14年生7个竹龄毛竹各5株,并对所采毛竹编号(表1)。采集地为安徽黄山林场,气候属北亚热带湿润性季风气候,年平均气温15~16 ℃,无霜期236天,平均年降水量1 670 mm,降水多集中于5月—8月。
表1 7个竹龄毛竹采样表
1.2 方法
1.2.1 密度测定
为使不同竹龄毛竹具有可比性,均选取离地1.5 m处竹节,参照GB/T 15780-1995《竹材物理力学性质试验方法》制成10 mm×10 mm×tmm(竹壁厚)的试件2组(1组10个试件),分别测定饱水、气干、全干状态密度,1组用于建立模型,另1组用于验证,实验室室温20~22 ℃。
1.2.2 X-CT扫描值测定
试验采用美国通用电气(general electric,GE)Bright Speed Excel 4层螺旋CT(由国际竹藤中心提供)沿毛竹轴向方向扫描(图1)。考虑到扫描时间对CT测量值的影响(含水率变化),并参考前人研究成果[5-6],本试验扫描参数设定为: 120 kV、160 mAs、层厚0.625 mm、层间距1.25 mm、FOV 9.6、重建算法“std”,实验室室温20~22 ℃。对每个试件扫描5张CT图像,不同竹龄不同含水率梯度(饱水、气干、全干)共计2 100张CT图像。利用CT扫描仪工作站取每张图像上平均CT值,共计2 100个值; 取全干状态径向相对竹青5个位置的CT值,共计3 500个值(由于CT扫描仪分辨率的原因,对试件干缩忽略不计)。

图1 2,8,12年生毛竹气干状态下CT扫描图
2 结果与讨论
2.1 不同竹龄毛竹全干、气干、饱水状态下CT值
对已测定CT值进行分析,7个竹龄毛竹全干状态CT值介于-233.6~-104.38 Hu; 7个竹龄毛竹气干状态CT值介于-194.05~67.87 Hu; 7个竹龄毛竹饱水状态CT值介于133.66~180.95 Hu。由图2—图4可知,不仅含水率的变化会影响CT值的大小,竹龄的不同也会造成密度的差异,其中4年生和10年生差异较大,其余比较接近。
2.2 不同竹龄毛竹单一含水率状态下密度与CT值模型
分别建立不同竹龄毛竹全干、气干、饱水状态下密度与CT值拟合模型(图5、图7、图9),不同竹龄毛竹全干密度与CT值之间存在线性关系,回归方程为:D1=0.001 3H+1.030 5,R2=0.891 6(D1为全干密度,H为CT值),对拟合模型进行验证(图6),决定系数为R2=0.881。
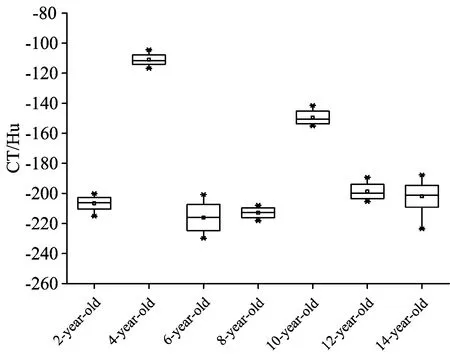
图2 7个竹龄毛竹全干状态下CT值

图3 7个竹龄毛竹气干状态下CT值
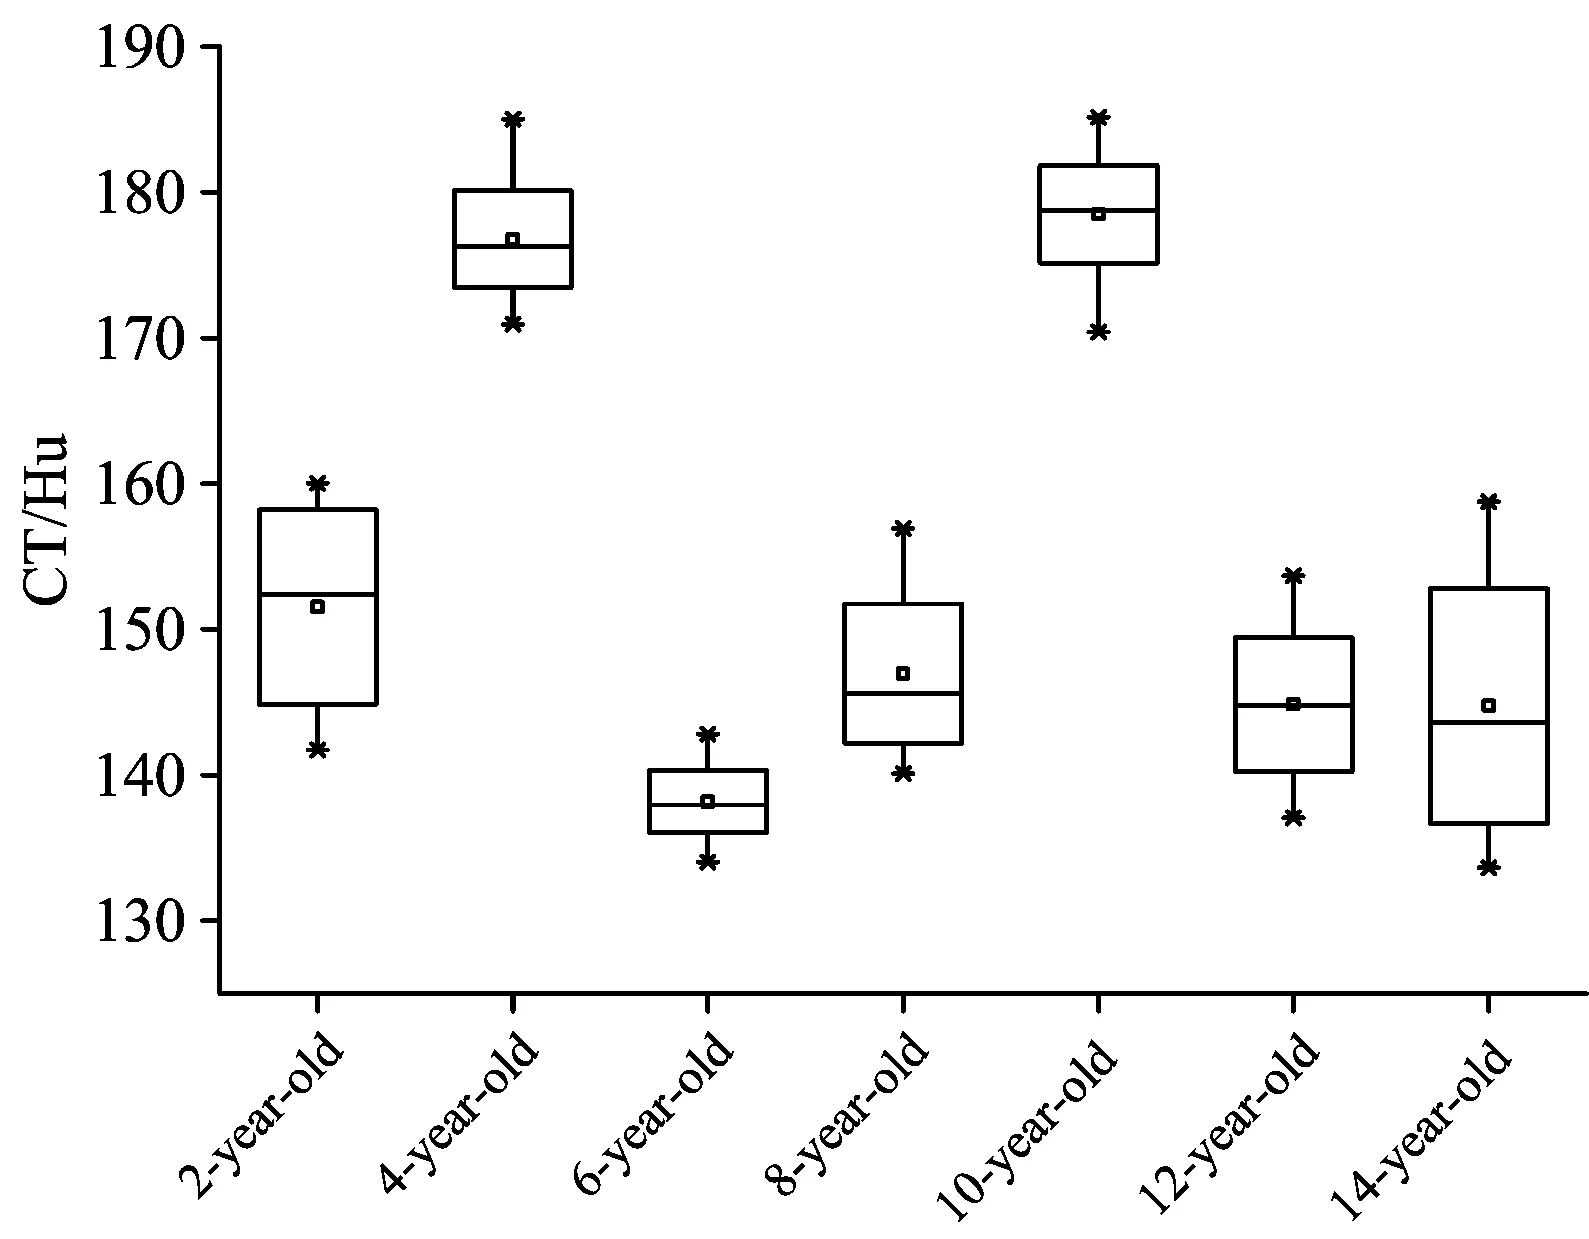
图4 7个竹龄毛竹饱水状态下CT值
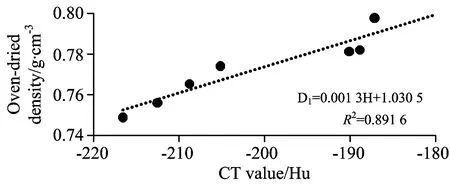
图5 7个竹龄毛竹全干密度与CT值拟合模型
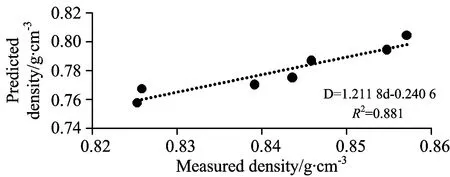
图6 7个竹龄毛竹全干密度与CT值验证模型
不同竹龄毛竹气干密度与CT值之间也存在线性关系,回归方程为:D2=0.001 1H+1.050 4,R2=0.982 1(D2为气干密度,H为CT值),对拟合模型进行验证(图8),决定系数为R2=0.773 2。这与单海斌等对梁山慈竹气干密度分析结论相类似[5]。

图7 7个竹龄毛竹气干密度与CT值拟合模型

图8 7个竹龄毛竹气干密度与CT值验证模型
不同竹龄毛竹饱水密度与CT椎之间同样存在线性关系,回归方程为:D3=0.001 9H+0.862 4,R2=0.854 7(D3为饱水密度,H为CT值),对拟合模型进行验证(图10),决定系数为R2=0.863 3。

图9 7个竹龄毛竹饱水状态下密度与CT值拟合模型

图10 7个竹龄毛竹饱和状态下密度与CT值验证模型
2.3 不同竹龄毛竹不同含水率梯度下密度与CT值模型
由于全干、气干、饱水密度与CT值均呈线性相关,且斜率相近(图5、图7、图9),因此建立不同年龄毛竹在不同含水率梯度下密度与CT值拟合模型(图11),不同竹龄毛竹在不同含水率梯度下密度与CT值之间存在线性关系,回归方程为:D=0.001H+1.0032,R2=0.968 3(D为密度,H为CT值),对拟合模型进行验证(图12),决定系数R2=0.974 3在0.97以上。不同含水率梯度状态下密度与CT值的回归方程斜率与全干、气干、饱水密度和CT值的回归方程斜率相近,这说明: CT值与毛竹密度关系受水分影响较小,这与瑞典学者Lindgren对木材密度研究得出的结论相类似,即“CT值与木材密度有很好的线性关系……这一关系几乎不受木材水分的影响[7]”。
同木材相类似,可以利用不同竹龄毛竹在不同含水率梯度下密度与CT值回归方程直接预测不同竹龄毛竹不同含水率状态时的密度。
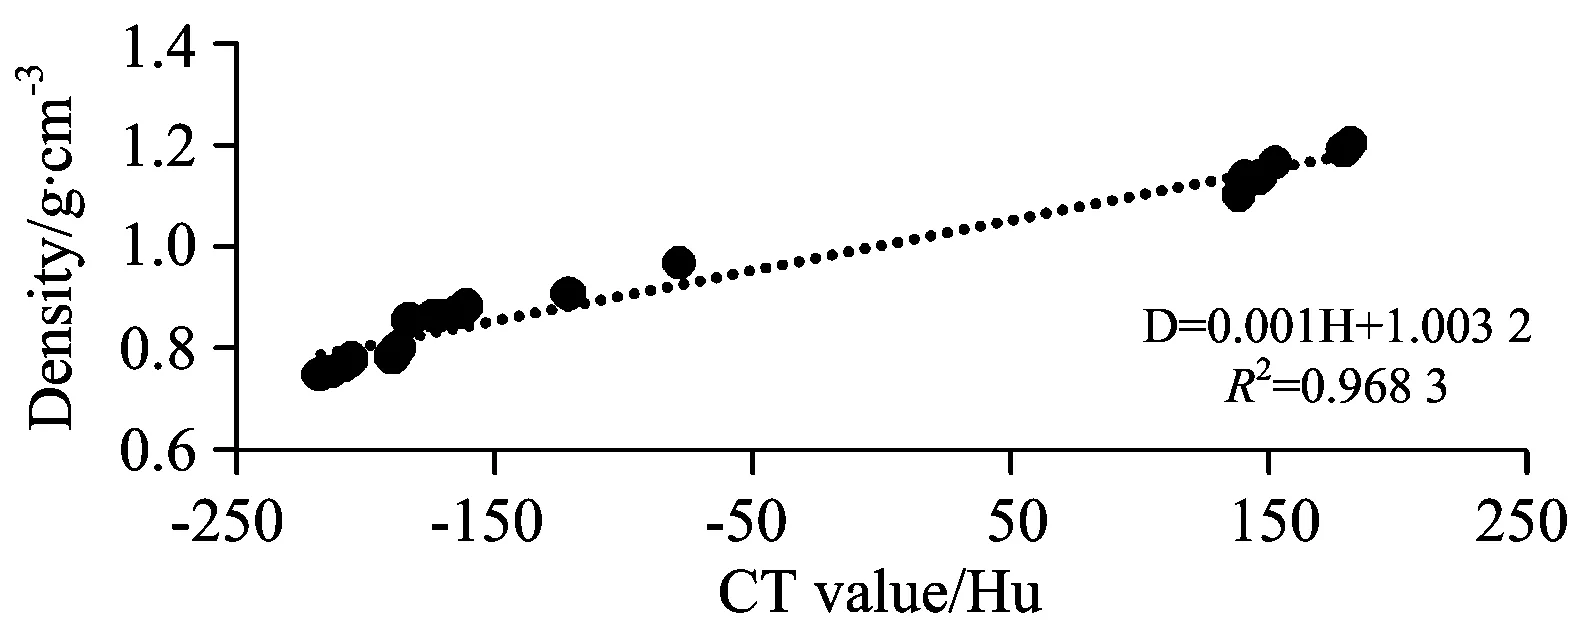
图11 7个竹龄毛竹不同含水率梯度下密度与 CT值拟合模型
Fig.11 Fitting model between density and CT valueof 7 different aged Moso bamboo under different moisture gradientsw

图12 7个竹龄毛竹不同含水率梯度下密度与 CT值验证模型
Fig.12 Correcting model between density and CT valueof 7 different aged Moso bamboo under different moisture gradientsw
2.4 不同竹龄毛竹密度差异分析
不同竹龄毛竹密度随竹龄增加呈增大趋势,且竹龄对密度差异的影响显著[4, 8],但竹材生长在自然环境中会受到如地域差异、立地条件、人工施肥、病虫害侵袭[9-13]等客观因素的影响,使得不同竹龄毛竹密度出现差异(图2、图3、图4),其主要原因在于全干木质成分含量存在差异。
利用X-CT技术对不同竹龄毛竹全干状态下径向相对竹青位置密度进行分析(图13、图14)可知,不同竹龄毛竹竹青、竹黄处密度差异较小,密度差异主要出现在竹肉处,且密度变化明显,这与王朝晖等对毛竹径向密度研究结果相类似[14],竹黄处仅4年生密度差异较大。由此可推断,毛竹因竹龄不同造成密度差异的原因是竹肉处密度差异较大。

图13 7个竹龄毛竹全干状态下径向相对竹青位置CT值
Fig.13 CT value of the radial position relativeto the outer of 7 different aged Moso bamboo under oven-dried condition
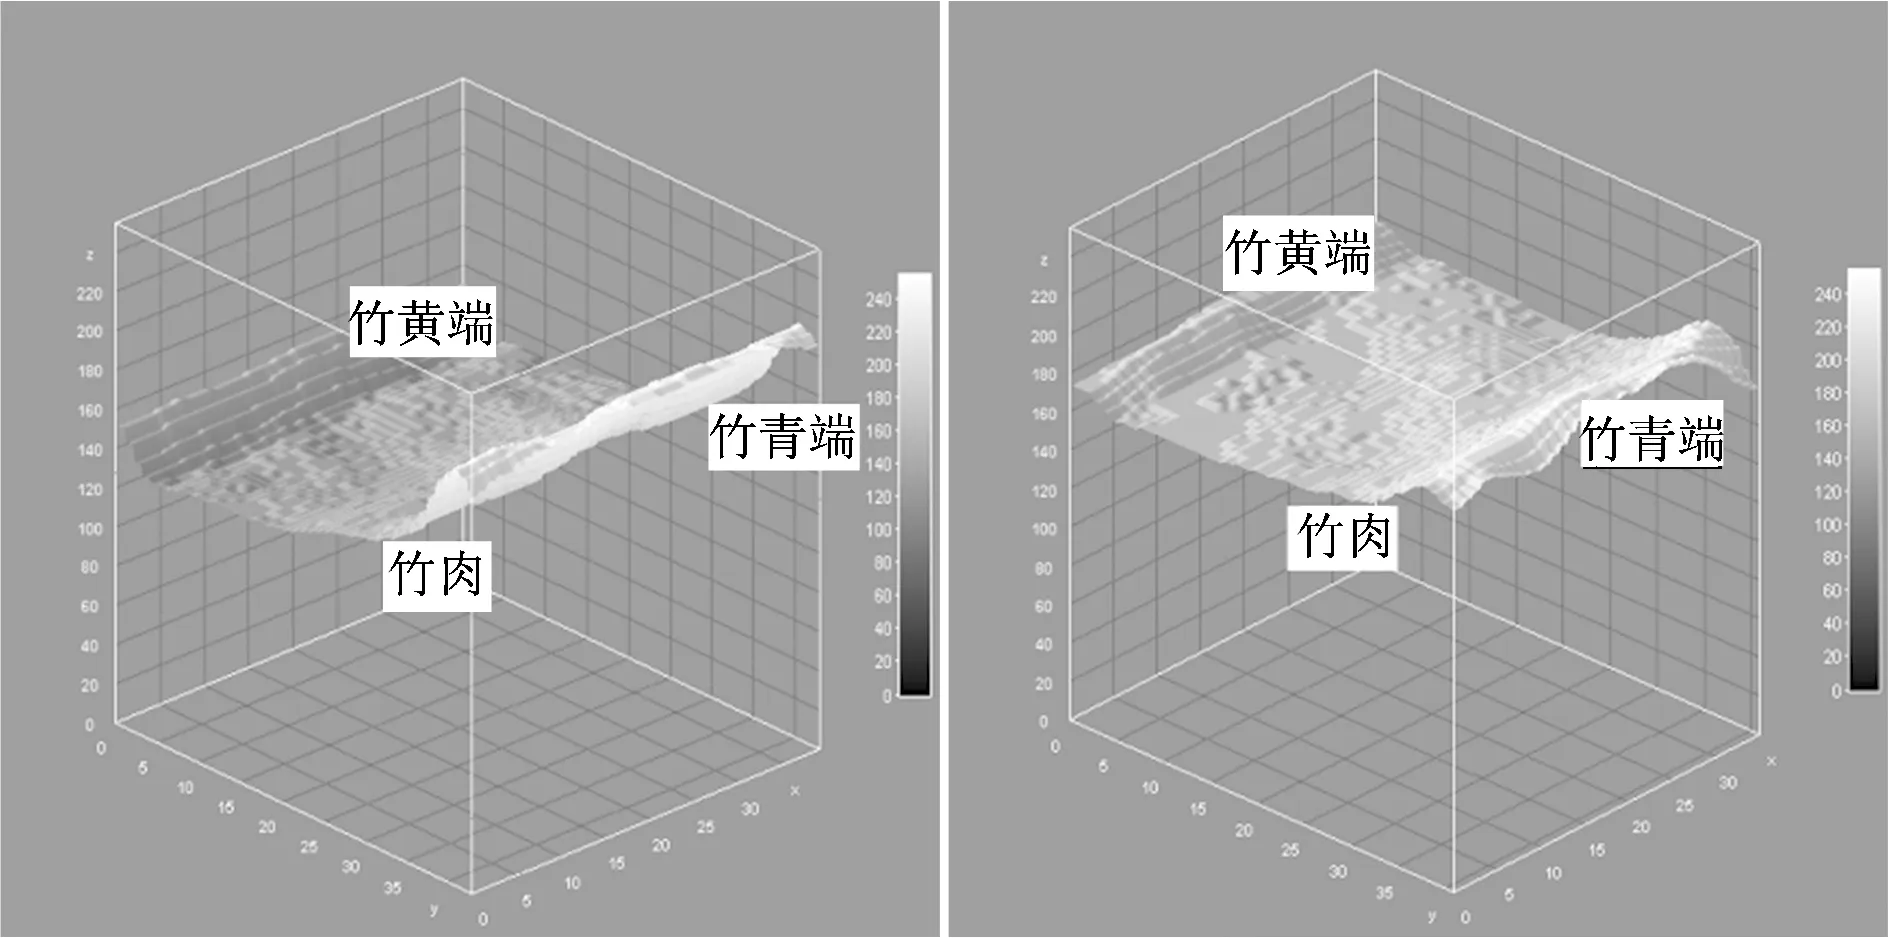
图14 12年生与4年生毛竹径向CT值3D图
3 结 论
(1)不同竹龄毛竹全干、气干、饱水状态下密度与CT值之间均存在线性关系,且拟合斜率相近,回归方程分别为:D1=0.001 3H+1.030 5,R2=0.891 6(D1为全干密度,H为CT值);D2=0.001 1H+1.050 4,R2=0.982 1(D2为气干密度,H为CT值);D3=0.001 9H+0.862 4,R2=0.854 7(D3为饱水密度,H为CT值)。
(2)不同竹龄毛竹不同含水率梯度下密度与CT值之间存在线性关系,且CT值与毛竹密度关系受水分影响较小,回归方程为:D=0.001H+1.003 2,R2=0.968 3(D为密度,H为CT值),验证模型决定系数R2=0.974 3。
(3)不同竹龄毛竹竹青、竹黄处密度差异较小,密度差异主要出现在竹肉处,且密度变化明显。
[1] YIN Si-ci(尹思慈). Wood Science(木材学). Beijing: China Forestry Publishing House(北京: 中国林业出版社), 1996.
[2] Lindgren L O. Wood Science and Technology, 1991, 25(5): 341.
[3] Lindgren L O. Wood Science and Technology, 1991, 25(6): 425.
[4] Huang P, Chang W S, Ansell M P, et al. Construction and Building Materials, 2015, 93: 197.
[5] SHAN Hai-bin, LIU Xing-e, YANG Shu-min, et al(单海斌, 刘杏娥, 杨淑敏, 等). Spectroscopy and Spectral Analysis(光谱学与光谱分析), 2014, 34(12): 3380.
[6] He X, Qi D. European Journal of Wood and Wood Products, 2013, 71(5): 647.
[7] Lindgren L O. Holzals Rohund Werkstoff, 1992, 50(7/8): 295.
[8] Wang X Q, Li X Z, Ren H Q. Journal of Tropical Forest Science, 2010, 22(1): 88.
[9] Kobayashi T, Shimano K, Muraoka H. Plant Species Biology, 2004, 19(1): 33.
[10] YANG Qing-ping, CHEN Shuang-lin, GUO Zi-wu,et al(杨清平, 陈双林, 郭子武, 等). Forest Research(林业科学研究), 2012, 25(6): 784.
[11] Kleinhenz V, Milne J, Walsh K B, et al. Journal of Bamboo and Rattan, 2003, 2(3): 281.
[12] Zhang Q, Shamsi I H, Wang J, et al. Environmental Science and Pollution Research, 2013, 20(7): 4681.
[13] Zhang Y, Saito Y, Lin J, et al. Experimental &Applied Acarology, 2003, 31(1-2): 59.
[14] WANG Zhao-hui, JIANG Ze-hui, RUAN Xi-gen(王朝晖, 江泽慧, 阮锡根). Scientia Silvae Sinicae(林业科学), 2004, 40(3): 111.
(Received May 20, 2015; accepted Sep. 24, 2015)
*Corresponding author
Rapidly Detection for Moso Bamboo Density under Different Moisture ConditionBased on X-CT Technology
WANG Qing-ping1, 2, LIU Xing-e2, ZHANG Gui-lan1, YANG Shu-min2*, TIAN Gen-lin2, SHANG Li-li2, MA Jian-feng2
1. College of Material Science and Art Design, Inner Mongolia Agricultural University, Huhhot 010018, China 2. International Center for Bamboo and Rattan, Bamboo and Rattan Science and Technology Laboratory, Beijing 100102,China
Density, which is closely relate with many physical and mechanical properties of bamboo, is one of the important indicators of bamboo material properties. Moreover, because of existing different moisture gradients in bamboo, the measured results of the density are different. Based on X-ray computed tomography (X-CT) technology, the divergent degree of the CT values of 7 different aged Moso bamboo was compared under oven-dried, air-dried and water-saturated conditions. Except for the 4-year-old and 10-year-old Moso bamboo, the CT values of other aged bamboos have minor differences with each other; the models for the measured CT values and the corresponding densities of Moso bamboo were respectively fitted under oven-dried, air-dried and water-saturated conditions. Meanwhile, the model was also fitted under different moisture gradients, which was composed by the measured CT values and the corresponding densities of Moso bamboo. Then the relations between the CT values andthe densitiesof 7 different aged Moso bamboo were systematically analyzed under single moisture content and three moisture gradients;the CT values were fitted under oven-dried condition, of which the radial positions are relative to the outer of Moso bamboo. According to the relation between the CT value and the density, the fitting curves explain the reasons for the radial density variations of 7 different aged Moso bamboo. Results show that the relations, which are fitted by the measured densities and the corresponding CT values of 7 different aged Moso bamboo under oven-dried, air-dried and water-saturated conditions, are good linear and the slopes of those models are approximate; the relation of the densities with the CT values for Moso bamboo is linear under different moisture gradients, moreover, which is rarely affected by moisture. The regression equation is:D=0.001H+1.003 2,R2=0.968 3(Dis the density,His the CT value) and the determination coefficient of the validation model is:R2=0.974 3; there is no obvious variation between the densities of the inner and the outer, but not in middle part to 7 different aged Moso bamboo under oven-dried condition. To realize rapid detection on the densities of Moso bamboo under different moisture content, these results provide technical support and data reference. At the same time, X-ray computed tomography (X-CT) technology also puts forward a new feasible way for the further studies of bamboo material properties and structure.
X-ray computed tomography (X-CT) technology; Density detection; Moso bamboo; Moisture content
2015-05-20,
2015-09-24
林业公益性行业科研专项项目(201304513)资助
王卿平,1989年生, 内蒙古农业大学硕士研究生 e-mail: wongchingping@outlook.com *通讯联系人 e-mail: shangke620@hotmail.com
S781.9
A
10.3964/j.issn.1000-0593(2016)06-1899-05
猜你喜欢
数学物理学报(2022年1期)2022-03-16
数学物理学报(2021年6期)2021-12-21
科学与财富(2021年36期)2021-05-10
中学生数理化·高一版(2021年2期)2021-03-19
中学生数理化·高一版(2021年2期)2021-03-19
意林·少年版(2020年13期)2020-08-02
应用数学(2020年2期)2020-06-24
汉语世界(2020年3期)2020-06-19
东坡赤壁诗词(2020年2期)2020-06-04
华东师范大学学报(自然科学版)(2019年3期)2019-06-24
- 光谱学与光谱分析的其它文章
- 基于光声光谱联合主成分回归法的血糖浓度无损检测研究
- Structural, Morphological and Optical Properties of Well-Ordered CdO Nanostructures Synthesized by Easy-Economical Chemical Bath Deposition Technique
- Sensitivity Enhancement in Uranium Determination by UV-Visible Spectroscopy Using Ion Imprinted Polymer
- 采用小波分析方法降低可调谐半导体激光吸收光谱技术测量下限的实验研究
- 钠钾替代条件下不同基因型棉花叶片的FTIR光谱研究
- 近红外高光谱成像技术用于转基因大豆快速无损鉴别研究