近红外透射光谱的动物全血鉴别
万 雄,王 建,刘鹏希,章婷婷
1. 中国科学院空间主动光电技术重点实验室,上海 200083 2. 上海市动物疫病预防控制中心,上海 201103
近红外透射光谱的动物全血鉴别
万 雄1,王 建2*,刘鹏希1,章婷婷1
1. 中国科学院空间主动光电技术重点实验室,上海 200083 2. 上海市动物疫病预防控制中心,上海 201103
在进出口检测检疫部门,血液制品的检验与分类是件重要且复杂的事情。对于全血样品,开放式的采集可能带来污染,且血样中的致病因子可能会对检测人员造成危害。因此急需非接触式的全血分类鉴别方法。常用流式细胞术中的光谱方法由于需要对血细胞进行采样,所以无法在非接触全血分类鉴定中采用。红外吸收光谱学是一种可用来分析样品分子结构和化学键的技术,可以在不直接接触样品的情况下对样品进行探测。为寻找一种可实现非接触式血液样品种属差异性状探测的可行光谱方法,采用近红外谱段(4 497.669~7 506.4 cm-1)对犬猫鸡三类常见动物全血样品进行了透射光谱测量。结果发现所测样品均在5 184~5 215 cm-1之间有个明显的吸收峰,在7 000 cm-1附近有个较平缓的吸收峰,且同种动物个体之间的透射光谱分布相似,只在整体透射率上有些差别。采用相关系数比较三类动物全血样品近红外透射光谱的区别,计算得出同种动物不同个体光谱曲线的相关系数均大于0.99,而不同种动物光谱曲线的相关系数在0.509 48~0.916 13之间。其中鸡与猫光谱曲线的相关系数在0.857 23~0.912 44之间;鸡与犬光谱曲线的相关系数在0.509 48~0.664 82之间;猫与犬光谱曲线的相关系数在0.872 75~0.916 13之间。犬猫同属哺乳纲,两者全血的近红外透射光谱相关系数比犬鸡或猫鸡非同纲动物的大,即光谱曲线的相似度更高。研究结果表明近红外透射光谱是一种非接触式动物全血鉴别的可行方法。
透射光谱;近红外;相关系数;动物全血
引 言
全血样品的进出口检测检疫是件非常重要的事情。一方面,需要禁止国内特有动物的全血制品出口,因为其出口会造成国家物种资源信息的流失;另一方面,全血制品的进口必须加以检验及控制,以避免不明外来物种的入侵,造成生态环境的破坏。在进出口检验检疫部门,对于全血制品这种特殊检测对象,常规基于流式细胞术的开放式检测方法有两个弊端,即接触式采样带来的全血样品污染以及全血制品可能携带的致病因子引起的人员感染风险。因此,急需非接触式的全血分类检测与鉴别方法。
光谱技术在血液分析中得到广泛应用,例如在流式细胞术中,常用激光激发荧光[1-2]及激光散射[3-4]等光学技术进行细胞的分类鉴别。但是这些流式细胞术中的光谱方法无法在非接触全血分类鉴定中采用。红外吸收光谱学是一种可用来分析样品分子结构和化学键的技术,因为每种分子都有由其组成和结构决定的独有的红外吸收光谱。该技术可以在不直接接触样品的情况下对样品进行探测,可能实现非接触式的血液样品种属差异性状的探测。
早在1916年, Lewis等[8]就测量了人血清的紫外吸收光谱。1997年,许少峰等[9]发现人和猴、犬、羊、兔、鼠、鸡全血在可见光谱段的吸收光谱非常相似,其吸收峰的位置也比较接近。此外,他们还发现人血和兔血在红外部分吸收峰有所区别[10]。1999年,Friebel等[11]对人全血在400~2500 nm谱段的光学特性(包括吸收)进行了分析。在2011年,Almulla等[12]比较了贫血病人和正常人血液可见光及近红外吸收光谱的区别。以上研究,为近红外吸收(或透射)光谱的动物全血鉴别分类的应用打下了一定的基础。我们在近红外谱段对犬猫鸡三类常见动物全血样品进行了透射光谱测量,发现三类动物全血样品近红外透射光谱的特性差异可供鉴别分类。
1 实验部分
实验系统采用ABB公司MB3000傅里叶变换红外光谱仪,其最高光谱分辨率为0.7 cm-1且到64 cm-1的范围之间调节,光谱范围为485~8 500 cm-1。该型号光谱仪采用迈克尔逊干涉仪光路结构,通过样品后含有样品信息的干涉光到达探测器,通过傅里叶变换获得光谱数据,从而得到透过率或吸收率随波数变化的光谱图。

Fig.1 Experimental steps of whole bloods
实验步骤如图1所示,实验全血样品为鸡、犬、猫三种动物EDTA抗凝血(采集24 h内测定),每种动物各取二个个体供分析,共六个全血样。测试时将六个全血样装入统一的PET塑料试管,全血试管装血量约为二分之一,采用倒置试管放置样品,测量上部挂壁血液部分的透射光谱,以避免整个试管全血吸收过强造成的信号微弱。测试过程中选用光谱分辨率5 cm-1,光谱范围4 497.669~7 506.4 cm-1,取五次的平均光谱数据。PET塑料试管透射光谱曲线如图2所示,做为参考光谱,全血光谱以此为基准进行透过率测量。

Fig.2 Reference spectrogram of PET cuvette
2 结果与讨论
2.1 三种动物全血的近红外透射光谱
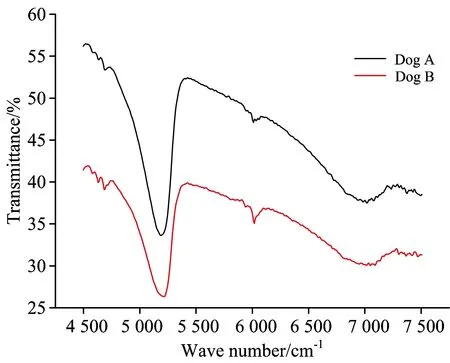
鸡、犬、猫六个全血样分别标注为Chicken A, Chicken B, Dog A, Dog B, Cat A, Cat B。所测得的三种动物六个个体的全血近红外透射光谱如图3—图5所示。
2.2 透射光谱分析
从图3—图5可见,所有六个全血样品均在5 184~5 215 cm-1之间有个明显的吸收峰,同时在7 000 cm-1附近有个较平缓的吸收峰。同种动物个体之间的透射光谱分布相似,只在整体透射率上有些差别。

Fig.3 Near IR transmission spectrograms of chicken’s whole bloods

Fig.4 Near IR transmission spectrograms of dog’s whole bloods

Fig.5 Near IR transmission spectrograms of cat’s whole bloods
可采用相关系数评估光谱曲线的相似性,其定义见下式
(1)
r的取值范围为0~1,大小反映了两条光谱曲线的相似程度,当r为1时,表示两条曲线形状完全一致。六个全血样品4 497.669~7 506.4 cm-1间透射光谱曲线之间的相关系数r如表1所示。结果表明,同种动物不同个体光谱曲线的相关系数均大于0.99,说明相似度非常高。而不同种动物光谱曲线的相关系数在0.509 48~0.916 13之间,说明有一定的相似度,但比同种动物相似度有一定的差距。另外,鸡与猫光谱曲线的相关系数在0.857 23~0.912 44之间;鸡与犬光谱曲线的相关系数在0.509 48~0.664 82之间;猫与犬光谱曲线的相关系数在0.872 75~0.916 13之间。说明,犬猫同属哺乳纲,两者全血的近红外透射光谱曲线差异比犬鸡或猫鸡非同纲动物的小。

Table 1 Correlation coefficients r among whole blood samples
3 结 论
采用近红外谱段(4 497.669~7 506.4 cm-1)对犬猫鸡三类常见动物全血样品进行了透射光谱测量,计算了光谱曲线的相关系数。研究表明,不同物种动物全血的近红外透射光谱存在一定差异,这种差异可用相关系数进行衡量。相关系数的差异可用来进行物种全血鉴定判别。需要指出的是,光谱是用挂瓶血液进行测量的结果,原因在于光源的强度不高且试管本身吸收很强,如再加上试管内径长度的全血吸收,会导致吸收过多信号过弱。用挂瓶血液测量,厚度不均、重复性不好,从而会引起不同次测量整体光谱曲线的上移或下移。但相关系数的大小只与两条光谱曲线的形状的相似度有关,光谱曲线的整体上移或下移并不会影响两条光谱曲线的相关系数。为了改善实验的重复性,可采用高强度超连续谱激光光源对试管部分整个全血的吸收进行测量。在本研究基础上,通过光源的改进,近红外谱段的吸收光谱分析可成为一种非接触式动物全血鉴别的可行方法。
[1] Wallner G, Amann R, Beisker W. Cytometry, 1993, 14(2): 136.
[2] Herzenberg L A, Parks D, Sahaf B, et al. Clinical Chemistry, 2002, 48(10): 1819.
[3] De Grooth B G, Terstappen L, Pupples G J, et al. Cytometry, 1987, 8(6): 539.
[4] Ion R M, Planner A, Wiktorowicz K, et al. Acta Biochimica Polonica English Edition, 1998, 45: 833.
[5] Chappell J S, Bloch A N, Bryden W A, et al. Journal of the American Chemical Society, 1981, 103(9): 2442.
[6] Kreuzer L B. Journal of Applied Physics, 1971, 42(7): 2934.
[7] Xu M, Gao Y, Moreno E M, et al. Physical Review Letters, 2011, 106(13): 138302.
[8] Lewis S J. Proceedings of the Royal Society of London. Series B, Containing Papers of a Biological Character, 1916, 89(617): 327.
[9] XU Shao-feng,LIN Shao-zhong, CHEN Rong(许少峰, 林少忠,陈 荣). Applied Laser(应用激光),1997. 6.
[10] CHEN Rong, XU Shao-feng(陈 荣, 许少峰). Chinese Laser Medical Magzine(中国激光医学杂志), 1997, 6(3): 142.
[11] Friebel M, Do K, Hahn A, et al. Journal of Biomedical Optics, 1999, 4(1): 36.
[12] Almulla A M F, Agab A W, Almannai L S, et al. Royal College of Surgeons in Ireland Student Medical Journal, 2011, 4(1): 82.
*Corresponding author
Identification of Animal Whole Blood Based on Near Infrared Transmission Spectroscopy
WAN Xiong1,WANG Jian2*,LIU Peng-xi1,ZHANG Ting-ting1
1. Key Laboratory of Space Active Opto-Electronics Technology, Shanghai Institute of Technical Physics of the Chinese Academy of Sciences, Shanghai 200083, China
2. Shanghai Municipal Animal Diseases Control Center, Shanghai 201103, China
The inspection and classification for blood products are important but complicated in import-export ports or inspection and quarantine departments. For the inspection of whole blood products, open sampling can cause pollution and virulence factors in bloods samples may even endanger inspectors. Thus non-contact classification and identification methods for whole bloods of animals are needed. Spectroscopic techniques adopted in the flowcytometry need sampling blood cells during the detection; therefore they can not meet the demand of non-contact identification and classification for whole bloods of animals. Infrared absorption spectroscopy is a technique that can be used to analyze the molecular structure and chemical bonds of detected samples under the condition of non-contact. To find a feasible spectroscopic approach of non-contact detection for the species variation in whole blood samples, a near infrared transmitted spectra (NITS, 4 497.669~7 506.4 cm-1) experiment of whole blood samples of three common animals including chickens, dogs and cats has been conducted. During the experiment, the spectroscopic resolution is 5 cm-1, and each spectrogram is an average of 5 measured spectral data. Experimental results show that all samples have a sharp absorption peak between 5 184 and 5 215 cm-1, and a gentle absorption peak near 7 000 cm-1. Besides, the NITS curves of different samples of same animals are similar, and only have slight differences in the whole transmittance. A correlation coefficient (CC) is induced to distinguish the differences of the three animals’ whole bloods in NITS curves, and the computed CCs between NITS curves of different samples of the same animals, are greater than 0.99, whereas CCs between NITS curves of the whole bloods of different animals are from 0.509 48 to 0.916 13. Among which CCs between NITS curves of the whole bloods of chickens and cats are from 0.857 23 to 0.912 44, CCs between NITS curves of the whole bloods of chickens and dogs are from 0.509 48 to 0.664 82, and CCs between NITS curves of the whole bloods of cats and dogs are from 0.872 75 to 0.916 13. The cat and the dog belong to the class of mammal, and the CCs between their whole bloods NITS curves are greater than those between chickens and cats, or chickens and dogs, which are hetero-class animals. Namely, the whole bloods NITS curves of the cat and the dog have higher similarity. These results of NITS provide a feasible method of non-contact identification of animal whole bloods.
Transmitted spectrum;Near infrared; Correlation coefficient; Animals’ whole blood
Sep. 8, 2014; accepted Dec. 20, 2014)
2014-09-08,
2014-12-20
国家自然科学基金项目(81260225), 国家高技术研究发展计划(863)项目(2015AA021103)和中国科学院“百人计划”择优项目资助
万 雄,1969年生,中国科学院上海技术物理所研究员 e-mail: wangxiong@mail.sitp.ac.cn; wanxiong1@126.com *通讯联系人 e-mail:jianwhlj@163.com
O675.3
A
10.3964/j.issn.1000-0593(2016)01-0080-04
—— 世界观测-3卫星
- 光谱学与光谱分析的其它文章
- Determination of Component Contents of Blend Oil Based on Characteristics Peak Value Integration
- Identification of Haploid Maize Kernel Using NIR Spectroscopy in Reflectance and Transmittance Modes: A Comparative Study
- 基于光谱吸收法和荧光法的甲烷和二氧化硫检测系统的研究
- 基于TDLAS-WMS的痕量甲烷气体检测仪
- 推扫误差对计算光谱成像数据重构的影响分析
- ICP-MS用于云南南部四种特色蜂蜜的植物源鉴别分析

