An Engineering Method to Predict Fatigue Crack Propagation Life for Marine Structures
,,
(1 China Ship Develop and Design Center,Wuhan 430064,China;2 State Key Lab of Ocean Engineering,Shanghai Jiao Tong University,Shanghai 200240,China;3 Hadal Science and Technology Research Center,Shanghai Ocean University,Shanghai 201306,China)
An Engineering Method to Predict Fatigue Crack Propagation Life for Marine Structures
YAN Xiao-shun1,2,HUANG Xiao-ping2,CUI Wei-cheng3
(1 China Ship Develop and Design Center,Wuhan 430064,China;2 State Key Lab of Ocean Engineering,Shanghai Jiao Tong University,Shanghai 200240,China;3 Hadal Science and Technology Research Center,Shanghai Ocean University,Shanghai 201306,China)
Accurate prediction of fatigue life is important for the safety of marine structures.Comparing with traditional methods based on Cumulative Fatigue Damage(CFD)theory,life prediction based on Fatigue Crack Propagation(FCP)can take the key factors,like load sequence and initial defects,into consideration.This makes the major classification societies strongly promote the application of FCP theory in ocean engineering.This paper investigated the engineering method of fatigue life prediction based on FCP from three aspects,namely crack propagation law,calculation of Stress Intensity Factor(SIF)and generation of fatigue load spectrum.The aim was to find an accurate,rational and relatively simple method.By using the unique curve model,the technology of sub-model to calculate SIF and the method to generate fatigue load spectrum based on spectral analysis,the crack propagation life of a typical fatigue hot spot of a semi-submersible platform was predicted and then the effect of initial crack size was discussed.The results showed the discussed hot spot met the requirement of design life.And initial crack size of the surface crack affected the fatigue life a lot. The method proposed in this paper may provide a reference for accurate prediction of fatigue life of marine structures.
fatigue crack propagation;unique curve model;spectral analysis; stress intensity factor;semi-submersible platform
0 Introduction
With the exploration of oil and gas resources under deep water and the development of economic globalization,offshore platforms and other marine structures are increasing as well as maritime accidents.Meanwhile,in order to obtain higher profits,offshore oil companies or ship owners are trying to extend the life of marine structures,which makes accurate prediction of life for marine structures has important engineering significance.Time-varying environment loads,such as wind,wave and current,will cause alternating stresses in components of marine structures.Since fatigue damage caused by these alternating stresses is one of the main failuremodes,fatigue assessment for marine structures is an important part of design and maintenance phases.To accurately predict fatigue lives of hot spots is vital for safety of offshore structures.
The traditional methods to predict fatigue life are based on Cumulative Fatigue Damage (CFD)theory,including simplified fatigue analysis method and spectral fatigue analysis method. The simplified fatigue analysis method is straightforward but varied from people to people because of the empirical formulas in fatigue load calculation.In comparison,the fatigue load calculation of spectral fatigue analysis method is based on spectral analysis,which considers the impact of the ship type,wave condition,location of target hot spot.It makes this method seems more rational.However,CFD theory does not take important factors such as the initial defect and load sequence into consideration.It makes the life prediction results for the same hot spot of a ship by using traditional methods showed a large dispersion[1].
Fortunately,the theory of Fatigue Crack Propagation(FCP)can overcome these difficulties.Besides,the clear definition of fatigue damage in FCP theory makes it easy to detect damage and predict the residual lives of offshore structures.Thus,in recent years,research and application on fatigue life prediction based on FCP are increasing dramatically.Doerk and Rörup[2]predicted the fatigue crack propagation life of a thick deck plate,made by high strength steel, of a large container ship,by using Paris law.Doshi and Vhanmane[3]combined Paris law and Monte Carlo simulation to predict fatigue reliability of several details of a double bottom tanker.Sumi[4]applied the storm model to generate fatigue loads and predicted the fatigue crack growth life of a deck structure with an embed crack.And then the impacts of the storm sequence on fatigue life were discussed.Huang et al[5]studied the simulation of fatigue load spectrum and proposed a method to generate the wave-induced fatigue loads for the service time of marine structures based on spectral analysis and stress distribution in the short term. Li and Cui[6-7]investigated the idea of Standard Load History(SLH)and combined the unified fatigue life prediction model of FCP to predict fatigue lives of details of a ship and an offshore platform.ABS,DNV,CCS and other classification societies have preliminary had the life prediction based on FCP written into the relevant specifications[8-10].
This paper aimed at the engineering application of FCP and mainly investigated the selection of FCP law,calculation of Stress Intensity Factor(SIF),generation of fatigue load spectrum.Then the FCP life of a typical fatigue hot spot of a semi-submersible platform was predicted and the influence of initial crack size was discussed.
1 Crack propagation law
The crack propagation law is the core of FCP theory and consequently more research has been done on it.The most representative formula is Paris law,which has been widely studied and used due to its simplicity,and the formula constants C and m in Paris law have been frequently tested for different materials.Since the Paris formula ignores the effects of stress ratio and load sequence,in many subsequent studies the original formula was modified and new onesproposed[11-16].However,most of the new formulas added more parameters,or changed the original parameters of Paris’s law,with the result that the large body of experiment C and m data being wasted or cannot be directly used.In addition,studies have shown that the parameters such as the crack propagation constant C and the threshold SIF range ΔKthalways change with stress ratio R.
In order to apply FCP theory into marine structures subjected to complex variable amplitude loading,Huang and Moan[14]proposed an improved FCP model considering stress ratio and validated the model by a large number of experimental data.The model only requires the material constants under stress ratio R=0 and is able to predict crack propagation under complex variable amplitude loading.Subsequently,Huang et al[15-16]proposed a unique curve model consisted of a unique crack growth rate curve and the corresponding equivalent SIF range. This model not only takes the effects of stress ratio and load sequence into consideration,but also combines the simplicity and practicability,showing broad engineering applications.The basic expression of the unique curve model is:
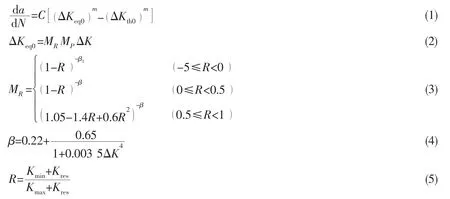
where a is the crack length;N is the number of applied cycles;C,m are the Paris parameters; ΔKeq0,ΔKth0respectively are the equivalent SIF range and threshold of SIF range corresponding to the stress ratio R=0;MRis the correction factor for stress ratio;β,β1depend on the material and the environment.Kresis the SIF caused by residual stress;MPis the correction factor for load sequence and can be calculated by:


2 Calculation of SIF
SIF is a fundamental parameter of fracture mechanics and many attempts have been made to calculate it accurately.In the current fatigue life prediction based on FCP,the commonly used method of SIF calculation depends on empirical formulas[17].However,this simplified approach is likely to underestimate the value of the SIF,leading to dangerous prediction[18]. For example,the T-welded joint showed in Fig.1 is one of the common joints used in marine structures,and the SIF of the surface crack is always calculated by empirical formulas recommended by BS7910[19]which was obtained by Finite Element Method(FEM)and with Boundary E,Boundary B,and Boundary D free[20].But the boundary conditions are almost unachievable in actual T-welded joint of ocean engineering.When complex loads are applied on the Boundary E,Boundary B,and Boundary D,the empirical formulas to calculate SIF must be different.Therefore,the poor applicability of the empirical formulas limits the wide application of fatigue assessment based on crack propagation.
Yan et al[18]proposed a method of SIF calculation based on the idea of sub-model,which considers complex boundary condition of welded joints and is more suitable for the SIF calculation under wave load calculations.Moreover,the method combines the PATRAN model of structural analysis commonly used in ocean engineering and the advantage of ANSYS in SIF calculation,and is suitable for engineering application.Take the typical fatigue hot spot of semi-submersible platforms shown in Fig.2 for example.In order to calculate SIF of an assumed semi-elliptical surface crack at the weld toe,the shell elements in vicinity of the discussed hot spot need to be refined and then are swept into solid elements with MPCs being created to connect shell elements and solid elements,as shown in Fig.3 and Fig.4.If the wave loads are loaded on the platform,the 3-D displacement field in vicinity of the hot spot can be obtained after static analysis.Then corresponding model with a surface crack is created in ANSYS,shown as Fig.5.The boundary conditions are obtained by interpolations from 3-D displacement field of PATRAN.Finally,the SIF of the surface crack under wave load is obtained.
Fig.6 is the comparison between the results of SIF under a wave load and the results obtained by conventional BS7910 empirical formulas[21].It is not difficult to find that the results obtained from empirical formulas seriously underestimated the value of the actual SIF.When predicting crack propagation life of marine structure,the SIF is calculated by using the em-pirical formula is inappropriate and it is more reasonable to apply the sub-model techniques of FEM.
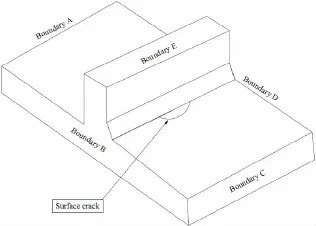
Fig.1 A common T-welded joint in marine structures
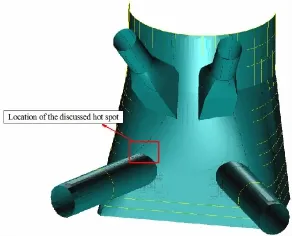
Fig.2 A typical fatigue hot spot in offshore platforms

Fig.3 Refinement process of shell elements in vicinity of the discussed hot spot

Fig.4 Finite element model with the solid and shell elements
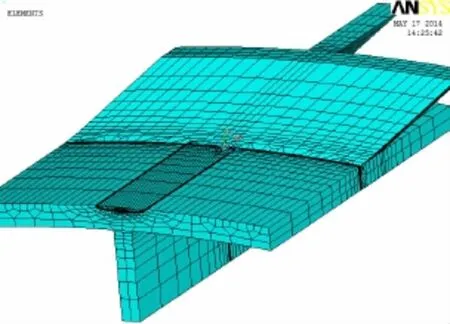
Fig.5 Corresponding finite element model with surface crack

Fig.6 Comparison between proposed FEM and empirical formula recommended by BS7910
3 Fatigue load generation based on spectral analysis
To generate real fatigue load spectrum is a prerequisite for accurate life prediction.Thefatigue loads of marine structures are mainly alternating stresses caused by wave loads,so the fatigue load spectrum can be considered as the wave-induced stresses in structures.
Generally,long-term distribution of the wave-induced stress ranges obeys the two-parameter Weibull distribution.In practice,the shape parameter and scale parameter of the Weibull distribution are derived by empirical formulas and the random stress ranges during the service time are equivalent to a constant stress by the following formula:

where m is the exponent of FCP law,q is the scale parameter of Weibull distribution.
However,when the random stress ranges are transformed into an equivalent constant stress range,the effects of the load sequence are ignored.In addition,the assumption of two-parameter Weibull distribution implies the stationary random process for wave-induced stress ranges in long-term.Stochastic process theory tells us that if the statistical properties do not vary with time,the random process can be called stationary random process.The waves in ocean vary with weather and seasons,so the wave-induced stresses do not have the long-term stability[22],and it is more rational to assume that wave-induced stresses in short term are stationary random process.
For the reasons above,Tomita[23]proposed storm model to simulate the effect of loading sequence.He derived the storm model from onboard wave history acquired by Japanese Marine Self Defense Force in North Pacific Ocean.He categorized sea conditions into two conditions:calm condition and storm condition.Tomita’s model can simulate a wave-induced load history of rough sea conditions.Later several researchers[4,24-26]improved the storm model and applied it into FCP-based life prediction.But the storm model is still not a mature approach and the methods of generating fatigue load spectrum vary from people to people,which makes the storm model difficult to be widely used.Li and Cui[6-7]proposed a method to generate fatigue load spectrum based on extrapolation of short-term tested data and the extreme value theory.Because of the expensive tested data and uncertainty of measured data of short term,this method is difficult to be applied into practice temporarily.
Huang et al[5]investigated the theory of spectral analysis and proposed a method for fatigue load spectrum generation based on the spectral analysis and stationary of wave-induced stresses in short term.The basic steps of the method are as follows:
Step 1:Calculate the transfer functioni.e.,get the nominal stresses of the discussed hot spot under unit wave height and different wave frequencies and directions.
Step 2:Determine the Power Spectral Density(PSD)function of wave-induced stresses G

Step 3:Calculate the moments of PSD.n-order moment of PSD is:

Step 4:Get the distribution of wave-induce stress in short term,which is assumed as Rayleigh distribution.The probability density function can be written as:

where Δσ represents the stress range and it is equal to twice the amplitude of the stress.
Step 5:Suppose that each short-sea condition lasts two hours[23]and determine the number of cycles in two hours based on the average zero-crossing rate.Generate load block for each short-sea condition which consists of a number of random stress ranges that following the Rayleigh distribution shown as Eq.(13).
Step 6:Determine the probability of occurrence for each load block based on the wave scatter diagram.The total number of cycles is determined by the average zero-crossing rate. Various short-sea conditions appear randomly in accordance with a certain probability constitute the long-term fatigue load spectrum.
Obviously,the first four steps of this method are the same as the traditional fatigue spectral analysis method.Since the traditional method is theoretically rigorous and has been widely accepted and written into relevant norms,this method of fatigue load spectrum generation is easy to be adopted by engineers and nice to be used in engineering practice.
4 Application for a typical hot spot of platforms
A semi-submersible drilling platform mainly works in the South China Sea and its design life is 30 years.The target location discussed in this study was a connection between the column and brace of an offshore platform,which was a typical fatigue hot spot,shown as Fig. 2.The wall thickness of the column is 22 mm,the thickness of the brace is 30 mm,the thickness of the stiffener on the column is 24 mm,and the thickness of the stiffener on the brace is 18 mm.The yield strength of the material is 245 MPa.
4.1 Fatigue load spectrum
The software AQWA WAVE was used to compute the hydrodynamic wave pressure on the panels for the selected waves.Parameters of hydrodynamic analysis were as follows:
Wave frequency:0.2~1.8 rad/s,step=0.1 rad/s(total 17 frequencies);
Wave heading:-180°~150°,step=30°(total 12 directions);
For each wave with determined wave heading and period,unit wave amplitude was used to generate the real and imaginary hydrodynamic wave pressures on the panels,so 408 different hydrodynamic analyses(17×12×2)were carried out.The hydrodynamic wave pressure was then mapped to the PATRAN structural elements.After loading and static analysis,the stressresponses of the target structure under different wave frequencies and directions were obtained.Fig.7 shows the equivalent stress contours(unit wave height,wave direction was 90°, frequency was 0.8 rad/s,real part of hydrodynamic pressure)in vicinity of the discussed fatigue hot spot.The transfer function is shown in Fig.8.

Fig.7 Equivalent stress contour of the discussed hot spot under wave load(shell elements)

Fig.8 Transfer function of the discussed hot spot
According to the method of fatigue load generation described in Chapter 3,the fatigue load spectrum the target hot spot subjected could be obtained,as well as the average period(7.27 sec)of stress cycles and the total number(1.3×10⁸)of cycles in 30 years.A piece(5 000 cycles)of wave-induced stress ranges is shown as Fig.9.
4.2 SIF calculation of unit stress
According to the method of SIF calculation described in Chapter 2,the shell elements were refined and then swept to solid elements.After loading the wave loads and static analysis,the 3-D displacement field in vicinity of the hot spot was obtained.Fig.10 shows the equivalent stress contour(unit wave height,wave direction was-120°,wave frequency was 0.8 rad/s,real part of hydrodynamic pressure)in vicinity of the discussed hot spot.Obviously, shell elements and solid elements were connected very well.
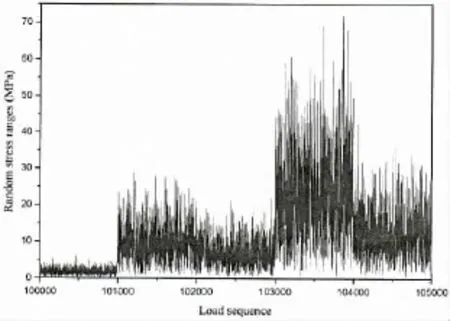
Fig.9 Fatigue load spectrum(piece) (shell and solid elements)
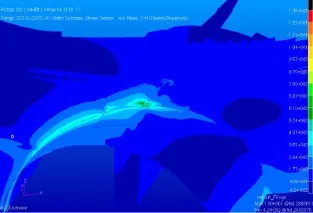
Fig.10 Equivalent stress contour of the discussed hot spot
Then the corresponding model with surface crack was created in ANSYS.After interpolation,loading and static analysis,SIF of the surface crack was obtained.As the load was divid-ed into real and imaginary parts,the response of SIF was also divided into real and imaginary parts.The results of SIF were transferred into equivalent SIF according to Eq.(14).The SIFs of different crack sizes are shown in Fig.11.

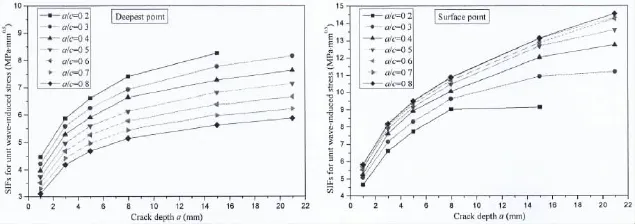
Fig.11 SIF under unit stress(left:deepest point;right:surface point)
4.3 Crack growth prediction
In crack growth prediction,the unique curve model was applied and the Paris constants in this model were referred to the recommendation of International Institute of Welding(IIW[27]), namelyThe parameters in correction factor calculation were set as β=0.3,β1=0.5,n=0.155 and residual stress was taken as 0.3 times of the yield strength of the material[16].SIF for different crack sizes were obtained by interpolation.
Referring to DNV recommendation[9],the initial depth a0of the surface crack was set as 0.5 mm,and the initial length 2c0was set as 5 mm.Suppose that the component was failure when the surface crack penetrates the thickness of the target plate.
Fatigue crack growth calculation was based on cycle-by-cycle approach.The calculated crack growth curves are shown in Fig.12.It was not difficult to find that the crack did not reach the critical state in 30 years,and the fatigue strength of the discussed hot spot met the requirement of design life.In addition,if the platform continued to be used without repair,the safety of the platform would not be ensured,because the fatigue crack propagation life of the discussed spot was about 32 years.
4.4 Discussion of the influence of the initial crack size
For surface cracks starting from transition between weld/base material,a crack depth of 0.5 mm may be assumed if no other documented information about crack depth is available[9]. BS7608 recommended that initial crack depth should be in the range from 0.1 mm to 0.25 mm unless a large size is known to be relevant.ABS[8]held that it would be realistic to assume that the initial flaw is a semi-elliptical in shape with
Fig.13 shows the fatigue lives of different initial crack sizes.Obviously,the initial crack size had vital influence on fatigue life,and the greater initial crack size,the shorter fatigue life. Therefore,effective control of the initial defect was important for the safety of marine structures.In addition,if no measured data was available,the initial crack size of the surface crack could be assumed as:a0=0.5 mm,2c0=5 mm.
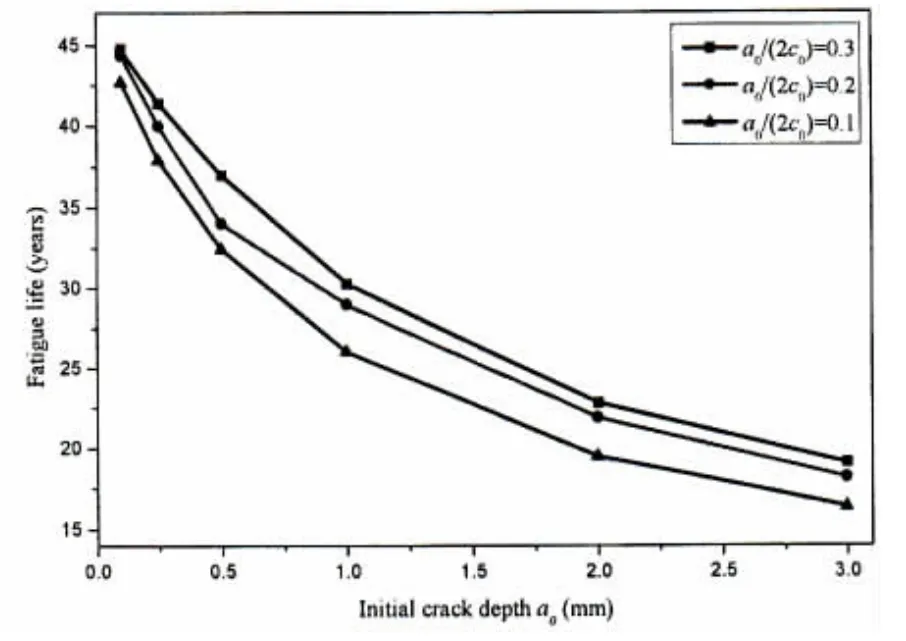
Fig.13 Fatigue life of different initial crack sizes
5 Conclusions
This paper focuses on the engineering application of crack propagation-based fatigue life prediction from three aspects,namely,selection of crack propagation law,calculation of stress intensity factor and generation of fatigue load spectrum.The main conclusions are as follows:
(1)The unique curve model takes the effects of load sequence and stress ratio into consideration and is able to predict crack propagation of welded joints under variable amplitude fatigue loads.The definition of crack propagation rate makes the parameters of the model easy to be determined and convenient to be used for marine structures.
(2)The complex boundary condition of welded joints of marine structures makes the traditional empirical formulas unsuitable.Some joints are too complicated to summarize empirical formulas.The proposed FEM using sub-model technology can calculate the SIF of surface crack at welded toe subjected to wave loads,which considers the realistic characteristics of the stress field in vicinity of the fatigue hot spot.
(3)Since the theory of spectral analysis is written into relevant norms and widely used in marine structure,the fatigue load spectrum generated based on spectral analysis can be easily adopted and applied by engineers.Constructing the wave-induced stress ranges based on shortterm distribution is more theoretically rational.
(4)The result of fatigue life prediction for a typical fatigue hot spot of a semi-submersible platform based on crack propagation showed the fatigue strength met the requirement of design life.The conclusion of comparing the fatigue lives of different initial crack sizes is that the effective control of the initial defect size was important to ensure the safety of marine structures.
Acknowledgements
The research reported in this paper is supported by the National Natural Science Foundation of China,project no.51279102.The support is gratefully acknowledged.
[1]Fricke W,Cui W,Kierkegaard H,et al.Comparative fatigue strength assessment of a structural detail in a containership using various approaches of classification societies[J].Marine Structures,2002,15(1):1-13.
[2]Doerk O,Rörup J.Development of toughness and quality requirements for yp47 steel welds based on fracture mechanics [C]//Proc.of the 19th Intl.Offshore and Polar Engineering Conference.ISOPE,2009:386-391.
[3]Doshi K,Vhanmane S.Probabilistic fracture mechanics based fatigue evaluation of ship structural details[J].Ocean Engineering,2013,61:26-38.
[4]Sumi Y.Fatigue crack propagation in marine structures under seaway loading[J].International Journal of Fatigue,2014, 58:218-224.
[5]Huang X,Yan X,Wang K.Discussion of fatigue loading spectrum on crack propagation in a ship detail[C].ASME 2014 33rd International Conference on Ocean,Offshore and Arctic Engineering.American Society of Mechanical Engineers, 2014.
[6]Li S,Cui W.Generation and application of a standardised load-time history to critical ship structural details[J].Ships and Offshore Structures,2013(ahead-of-print):1-15.
[7]Li S,Cui W.Generation and application of a standardised load-time history to tubular T-joints in offshore platforms[J]. China Ocean Engineering,2014.
[8]ABS.Guide for the fatigue assessment of offshore structures[S].New York:American Bureau of Shipping,2003.
[9]DNV.Fatigue design of offshore steel structures[K].DNV Recommended Practice DNV-RP-C203,2010.
[10]CCS.Guidelines for fatigue strength assessment of offshore engineering structures[M].China Classification Society,2013.
[11]McEvily A J,Ishihara S.On the dependence of the rate of fatigue crack growth on theparameter[J].International Journal of Fatigue,2001,23(2):115-120.
[12]Wang Y,Cui W,Wu X,et al.The extended McEvily model for fatigue crack growth analysis of metal structures[J].International Journal of Fatigue,2008,30(10):1851-1860.
[13]Cui W,Wang F,Huang X.A unified fatigue life prediction method for marine structures[J].Marine Structures,2011,24 (2):153-181.
[14]Huang X,Moan T.Improved modeling of the effect of R-ratio on crack growth rate[J].International Journal of Fatigue, 2007,29(4):591-602.
[15]Huang X,Torgeir M,Cui W.An engineering model of fatigue crack growth under variable amplitude loading[J].International Journal of Fatigue,2008,30(1):2-10.
[16]Huang X,Moan T,Cui W.A unique crack growth rate curve method for fatigue life prediction of steel structures[J].Ships and Offshore Structures,2009,4(2):165-173.
[17]Fricke W.Fatigue analysis of welded joints:State of development[J].Marine structures,2003,16(3):185-200.
[18]Yan X,Huang X,Liang Y,et al.Stress intensity factor for surface crack at weld toe of ocean engineering under wave loads[J].Journal of Shanghai Jiao Tong University,2014.(in Chinese)
[19]BS7910.Guide to methods for assessing the acceptability of flaws in metallic structures[M].British Standards Institution, 2005.
[20]Bowness D,Lee M M K.Prediction of weld toe magnification factors for semi-elliptical cracks in T-butt joints[J].International Journal of Fatigue,2000,22(5):369-387.
[21]Yan X,Huang X.A method to predict stress intensity factor of surface crack at weld toe of offshore structures under wave loads[J].Advanced Materials Research,2014.
[22]Hu Yuren,Chen Bozhen.Fatigue reliability analysis for structures in ship and ocean engineering[M]Beijing:China Communication Press,2010.(in Chinese)
[23]Tomita Y,Matobat M,Kawabel H.Fatigue crack growth behavior under random loading model simulating real encountered wave condition[J].Marine Structures,1995,8(4):407-422.
[24]Prasetyo F A,Osawa N,Tsutumi S,et al.Study on a load history generation method based on‘Storm Model’for fatigue assessment of ship structural members[C].The Twentieth International Offshore and Polar Engineering Conference.International Society of Offshore and Polar Engineers,2010.
[25]Moon C H,Hashimoto K,Song Y,et al.Experimental study on fatigue strength of welded joints under storm loading[C]. ASME 2011 30th International Conference on Ocean,Offshore and Arctic Engineering.American Society of Mechanical Engineers,2011:487-495.
[26]Mao W,Prasetyo F A,Ringsberg J W,et al.A comparison of two wave models and their influence on fatigue damage in ship structures[C].ASME 2013 32nd International Conference on Ocean,Offshore and Arctic Engineering.American Society of Mechanical Engineers,2013.
[27]IIW.Recommendations for fatigue design of welded joints and components[M].International Institute of Welding,2004.
海洋结构物疲劳裂纹扩展寿命的一种工程预报方法
闫小顺1,2,黄小平2,崔维成3
(1中国舰船研究设计中心,武汉430064;2上海交通大学 海洋工程国家重点实验室,上海200030;3上海海洋大学 深渊科学技术研究中心,上海201306)
海洋结构物疲劳寿命的准确预报对海洋结构安全具有重要意义。基于裂纹扩展的寿命预报相比于常规的基于累积损伤理论的寿命预报方法,能够考虑载荷次序、初始缺陷等重要因素的影响,各大船级社极力推进裂纹扩展理论在海洋工程中的应用。文章从裂纹扩展法则、应力强度因子求解、疲劳载荷谱模拟上对裂纹扩展理论的工程应用进行研究,试图找出准确、合理且相对简单的方法。结合裂纹扩展的单一曲线模型、基于有限元子模型技术的应力强度因子求法以及基于谱分析的疲劳载荷谱产生方法,对某半潜式钻井平台典型焊接节点进行基于裂纹扩展疲劳寿命预报,并讨论了初始裂纹尺寸对疲劳寿命的影响。结果表明,该半潜平台焊接结构符合设计寿命的要求,初始裂纹尺寸对疲劳寿命影响很大,可为海洋结构物基于裂纹扩展的疲劳寿命预报提供参考。
疲劳裂纹扩展;单一曲线模型;谱分析;应力强度因子;半潜平台
U661.4
:A
闫小顺(1990-),男,中国舰船研究设计中心工程师;
U661.4
A
10.3969/j.issn.1007-7294.2016.03.009
1007-7294(2016)03-0323-12
黄小平(1963-),男,上海交通大学船舶海洋与建筑工程学院副教授,通讯作者;
崔维成(1963-),男,上海海洋大学深渊科学技术研究中心教授,博士生导师。
Received date:2015-12-30
Foundation item:Supported by National Natural Science Foundation of China(Project No.51279102)
Biography:YAN Xiao-shun(1990-),male,engineer of China Ship Develop and Design Center;
HUANG Xiao-ping(1963-),male,Ph.D.,associate professor of Shanghai Jiao Tong University,E-mail: xphuang@sjtu.edu.cn;
CUI Wei-cheng(1963-),male,Ph.D.,professor/tutor of Shanghai Ocean University.
- 船舶力学的其它文章
- Load-Compression Relationships of Bonded Rubber Ring
- Three Dimension Electromagnetic-Thermal-Mechanical Coupling Finite Element Model for High Frequency Induction Mobile Heating Formation of Steel Plate
- Fatigue Reliability Analysis for the Manned Cabin of Deep Manned Submersibles Based on the Unified Fatigue Life Prediction Method
- Experimental Studies of Failure Behavior and Strength of H Beams with Stiffened Web Openings under Compression and Bending Loads
- A Combination Mooring System and Mooring Characteristics Study
- Numerical Prediction and Experimental Measurement on Truss Spar Motion and Mooring Tension in Regular Waves

