ARTICLE Facet Dependence of Photochemistry of Methanol on Single Crystalline Rutile Titania†
Qun-qing Ho,Zhi-qing Wng,Xin-chun Mo,Chun-yo Zhou∗,Dong-xu Di,Xue-ming Yng∗.Stte Key Lortory of Moleculr Rection Dynmics,Dlin Institute of Chemicl Physics,ChineseAcdemy of Science,Dlin 116023,Chin.Center of Interfce Dynmics for Sustinility,Institute of Mterils,Chin Acdemy of EngineeringPhysics,Chengdu 610200,Chin(Dted:Received on Jnury 11,2016;Accepted on Ferury 6,2016)
ARTICLE Facet Dependence of Photochemistry of Methanol on Single Crystalline Rutile Titania†
Qun-qing Haoa,Zhi-qiang Wanga,Xin-chun Maob,Chuan-yao Zhoua∗,Dong-xu Daia,Xue-ming Yanga∗a.State Key Laboratory of Molecular Reaction Dynamics,Dalian Institute of Chemical Physics,Chinese
Academy of Science,Dalian 116023,China
b.Center of Interface Dynamics for Sustainability,Institute of Materials,China Academy of Engineering
Physics,Chengdu 610200,China
(Dated:Received on January 11,2016;Accepted on February 6,2016)
The crystal phase,morphology and facet signi fi cantly in fl uence the catalytic and photocatalytic activity of TiO2.In view of optimizing the performance of catalysts,extensive e ff orts have been devoted to designing new sophisticate TiO2structures with desired facet exposure, necessitating the understanding of chemical properties of individual surface.In this work,we have examined the photooxidation of methanol on TiO2(011)-(2×1)and TiO2(110)-(1×1) by two-photon photoemission spectroscopy(2PPE).An excited state at 2.5 eV above the Fermi level(EF)on methanol covered(011)and(110)interface has been detected.The excited state is an indicator of reduction of TiO2interface.Irradiation dependence of the excited resonance signal during the photochemistry of methanol on TiO2(011)-(2×1)and TiO2(110)-(1×1)is ascribed to the interface reduction by producing surface hydroxyls.The reaction rate of photooxidation of methanol on TiO2(110)-(1×1)is about 11.4 times faster than that on TiO2(011)-(2×1),which is tentatively explained by the di ff erence in the surface atomic con fi guration.This work not only provides a detailed characterization of the electronic structure of methanol/TiO2interface by 2PPE,but also shows the importance of the surface structure in the photoreactivity on TiO2.
Key words:TiO2,Excited state,Two-photon photoemission spectroscopy,Reaction rate of photooxidation
†Part of the special issue for“the Chinese Chemical Society’s 14th National Chemical Dynamics Symposium”.
∗Authors to whom correspondence should be addressed.E-mail: chuanyaozhou@dicp.ac.cn,xmyang@dicp.ac.cn,Tel.:+86-411-84695174,FAX:+86-411-84675584
I.INTRODUCTION
Titanium dioxide(TiO2)is a versatile material in both scienti fi c and technological fi elds,ranging from surface science,catalysis and photocatalysis to paint, gas sensor and lithium batteries[1−3].The interaction between adsorbates(molecules or ions)and TiO2substrate is the core of the above mentioned scienti fi c issues and functional applications.To a large extent, such adsorbate-substrate interaction is determined by the electronic structure as well as the atomic structure of TiO2.Therefore,great e ff ort has been devoted to the investigation of the surface dependence of reactivity of TiO2[4−6].The anisotropic chemical reactivity of TiO2surfaces has stimulated the fabrication of di ff erent TiO2nanostructures with speci fi c facets to optimize the performance in the past few years[7,8].In surface science and catalysis,there is a conventional criterion for the reactivity,which says that surfaces with higher percentage of undercoordinated surface atoms are regarded more reactive.
Rutile,the most stable and abundant structure of titania,has attracted tremendous attention in the past decades in surface science and catalysis fi elds.Rutile (110)surface(Fig.1(b)),one of the most extensively studied metal oxides,has become a prototype for surface chemistry and photochemistry research.The structure of TiO2(110)-(1×1)has been well understood[2]. On the surface, fi vefold coordinated Ti ions(Ti5c)and twofold coordinated bridge O ions(Ob)run alternatively along the[001]azimuth.Reduction leads to the creation of surface oxygen vacancies(Ov)and subsurface Ti interstitials(Tiint)which contribute to the band gap states[9,10].In addition to TiO2(110)-(1×1),the structure of TiO2(011)surface has also been investigated,though less extensively[11−15].The most stable phase of TiO2(011)is reconstructured by(2×1).The atomic structure of TiO2(011)-(2×1)as suggested by surface X-ray di ff raction(SXRD)and density functional theory(DFT)calculations[12,14]is shown in Fig.1(a). Di ff erent from TiO2(110)-(1×1),inequivalent types of undercoordinated Ti and O atoms exist,namely the valley Ti5c,ridge Ti5c,top Oband bridge Ob.The topObatoms display in a zig-zag style,which shade the ridge Ti5csites severely.Missing of the top Obatoms creates Ov.All of the Ti sites on TiO2(011)-(2×1)surface are undercoordinated,while on TiO2(110)-(1×1), only half of them are unsaturated.According to the conventional criterion,the former should be more reactive than the latter.

FIG.1StructureofrutileTiO2(011)-(2×1)(a)and TiO2(110)-(1×1)(b)surfaces.Oxygen and Ti atoms are represented as red and gray spheres,respectively.Surface oxygen vacancies are created by removing the bridge bonded oxygen atoms labeled by dashed circles.Adsorption of methanol on Ti5csites of these two surfaces are also shown.
The surface dependence of the photoreactivity of rutile has been extensively investigated,especially the low Miller index surfaces such as(110)and(011)[16−24]. Ohno and coworkers reported the selectively photoassisted deposition of nanoparticles on di ff erent surfaces of TiO2[20].Under ultraviolet(UV)irradiation,photooxidation of Pb2+into PbO2took place on(011)surface,while photoreduction of Pt2+into Pt occurred on(110)surface.Such a result suggests the rutile(011)surface is more reactive towards photocatalyzed oxidation reaction.Takahashi et al.also found(011)is about two times more e ffi cient than (110)in the photocatalyzed oxidation of methylene blue [23].From the percentage of undercoordinated surface metal ions point of view,these examples seem consistent with the conventional criterion.In fact,researchers have tried to explain the enhanced photocatalytic activity of rutile(011)based on the electronic structures[25].In this work,Tao and coworkers compared the valence electronic structure of TiO2(011)-(2×1)and TiO2(110)-(1×1)using ultraviolet photoelectron spectroscopy(UPS).Finding the binding energy of the band gap state on the(011)surface is 0.34 eV higher than that on(110),they expect the electron trapping and therefore the electro-hole separation of the former surface is more e ffi cient than the latter.
Most recently,we have reassessed the photoactivity of TiO2(011)-(2×1)and TiO2(110)-(1×1)making use of the photocatalyzed oxidation of methanol[26].Temperature programmed desorption measurements showed the photocatalytic chemical reactions on these two surfaces are the same under identical experimental condition.Methanol molecules adsorbed on Ti5csites are converted into formaldehyde under ultraviolet(UV) irradiation;released hydroxyl and methyl hydrogen atoms,which transfer to the neighboring Obsites,generating bridging hydroxyls which experience recombinative desorption as water by abstracting lattice oxygen above 400 K;cross coupling of methoxy and formaldehyde produces methyl formate.Despite the same photocatalyzed oxidation reaction of methanol on TiO2(011)-(2×1)and TiO2(110)-(1×1),the reaction rate of the latter is 2.4 times of that of the former.The result suggests the reactivity of TiO2(011)-(2×1)is lower than TiO2(110)-(1×1)towards photoxidation reaction, in contrast with previous studies[20,23].The controdiction likely comes from the structure of the TiO2surface.In Refs.[20,23],the reactions took place in aqueous,while in our study,the measurements were carried out in ultrahigh vacuum(UHV)environment.
As an extension of our previous study[26],we have studied the photochemistry of methanol on both TiO2(011)-(2×1)and TiO2(110)-(1×1)using twophoton photoemission spectroscopy(2PPE).An excited state at 2.5 eV above the Fermi level(EF)of clean and methanol/TiO2interfaces,which serves as an indicator of surface reduction,has been detected.The properties of this state,for example,the energy level, angular distribution,lifetime and transition dipole moment,have been characterized.The excited resonance signal on both methanol/TiO2interfaces increase with UV light exposure,which corresponds to the reduction of the TiO2interface by depositing hydrogen atoms onto the surface during the photooxidation of methanol. Though the photocatalyzed reactions of methanol on both TiO2(011)-(2×1)and TiO2(110)-(1×1)are the same,the reaction rate on the latter surface is 11.4 times of that on the former.This work implies the role of surface structure in the photoreactivity of photocatalysts.
II.EXPERIMENTS
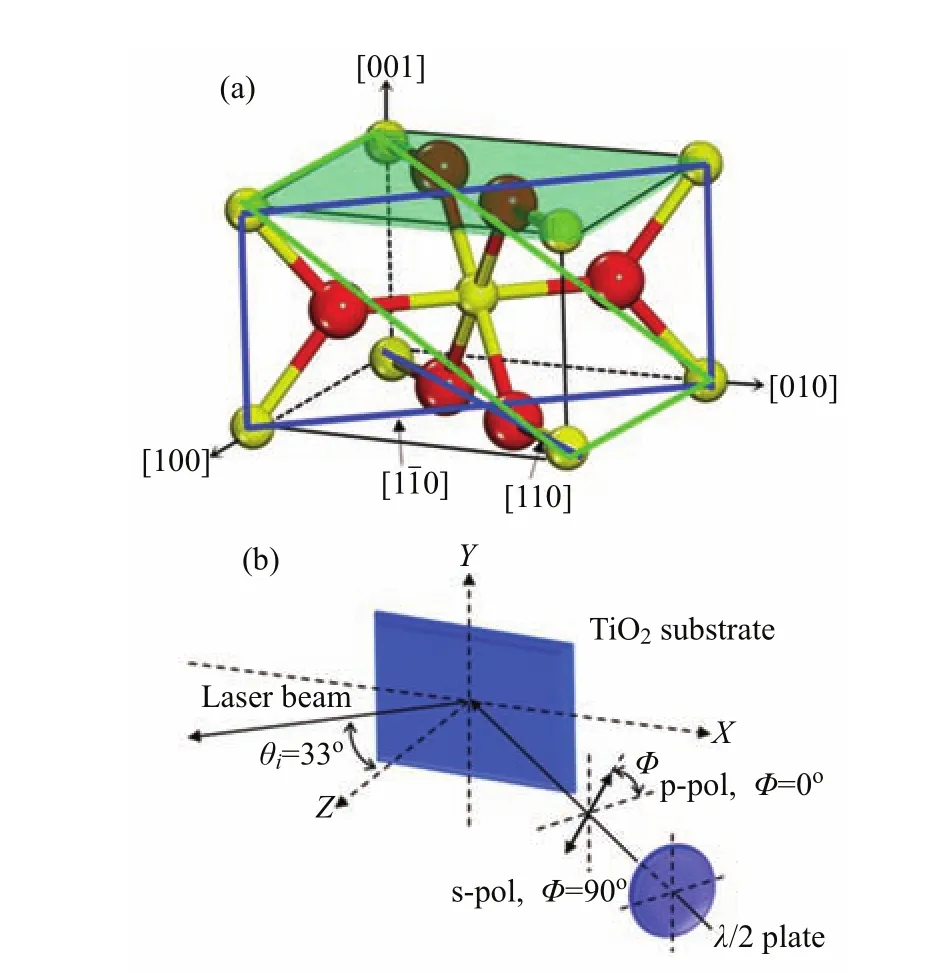
All experiments were conducted in a UHV chamber(base pressure better than 5×10⁻¹¹mbar),which has been described in detail previously[27].Brie fl y,a preparation and characterization together with an electron spectroscopy measurement chamber are included in the UHV system.Ar+ion source,home-made resistive heater,low energy electron di ff raction(LEED)and X-ray photoelectron spectroscopy(XPS)detectors are equipped for sample preparation and characterization respectively.The whole probing chamber is shieldedfrom the earth magnetism byµ-metal.The key element of this apparatus is the hemispherical electron energy analyzer(PHOIBOS 100,SPECS)for photoelectron detection.The energy and angular distribution of photoelectrons are recorded by a two-dimension(2D) CCD camera which facilitates the measurement of the whole photoelectrons within the energy range of interest simultaneously.Therefore,study of the kinetics of the surface reaction becomes feasible.The fundamental output of a tunable oscillator(MaiTai eHP,Spectra-Physics)is adjusted at about 800 nm with a pulse width of about 70 fs.It is converted to the second harmonic (around 400 nm,FWHM=4 nm)and then focused onto the sample(diameter≈100µm).The pulse width and average power of the 400 nm laser beam at the sample surface is about 90 fs and 150 mW,respectively.Polarization of the excitation light is rotated through a λ/2 plate before the lens.The experimental geometry is shown in Fig.2.For p-polarization(s-polarization),the electric fi eld of the laser lies in the horizontal(vertical) plane.In the case of the two-photon(ca.400 nm)excitation from the TiO2interface[28],the fi rst photon excites an electron from below the EFto above it,and the second photon excites the electron to the vacuum.The energy and angular distribution of the photoelectrons give rise to the 2PPE spectra.Both time-resolved 2PPE (TR-2PPE)and time-dependent 2PPE(TD-2PPE)experiments can be carried out on this instrument.In the TR-2PPE experiment,one can study the ultrafast dynamics of excited electronic states,while TD-2PPE can measure the photochemical kinetics of molecularly adsorbed surfaces.

FIG.2(a)Unit cell of rutile TiO2.The(110)and(011) surfaces are outlined by the blue and green rectangles,respectively.(b)Schematic overview of the experimental geometry.The electric fi eld of the laser can be varied by a half waveplate.For p-polarization(s-polarization),the electric fi eld of the laser lies in the XZ(Y Z)plane.

FIG.3 LEED pattern of rutile TiO2(011)-(2×1)(top)and TiO2(110)-(1×1)(bottom)surfaces.Azimuth directions are labeled by arrows.In the 2PPE measurements,the incident planes are the horizontal planes along the[01¯1]and[1¯10]for TiO2(011)-(2×1)and TiO2(110)-(1×1),respectively.
TiO2samples(PrincetonScienti fi cCorp., 10 mm×10 mm×1 mm)are mounted on a manipulator with four freedoms(translation along X,Y, Z axes and rotation around the polar axis)and are heated through resistive heating method and cooled by liquid nitrogen.K type thermocouples are glued directly to the TiO2surfaces using a ceramic adhesive (Ceramabond 503,Aremco Products,INC)to provide accurate temperature reading.The as received TiO2samples are polished on both sides to ensure maximum thermal contact.The samples were cleaned by cycles of Ar+sputtering(1 keV,15 min)and UHV annealing at 850 K(30 min).After this preparation procedure, no contamination could be detected in XPS,and sharp (2×1)and(1×1)LEED patterns were observed for (011)and(110)surface respectively(Fig.3).The preparation history of these two surface studied in the present work was similar.
Methanol(Sigma-Aldridge)was puri fi ed by freezepump-thaw cycles and introduced onto the TiO2surfaces through a home-built,calibrated e ff usive molecular beam doser at 120 K.A mass spectrometer (SRS,RGA 200)which was shielded by a glass enclosure and di ff erentially pumped was chosen to measure the relative coverage of methanol via TPD method [29].Temperature was ramped at 2 K/s during all the TPD experiments.Methanol coverage was measured with respect to the corresponding density of Ti5csites.Here,monolayer(ML)corresponds to 5.2×10¹⁴molecules/cm2on(110)-(1×1)while,this value is 4.0×10¹⁴molecules/cm2on(011)-(2×1)[30].
III.RESULTS AND DISCUSSION
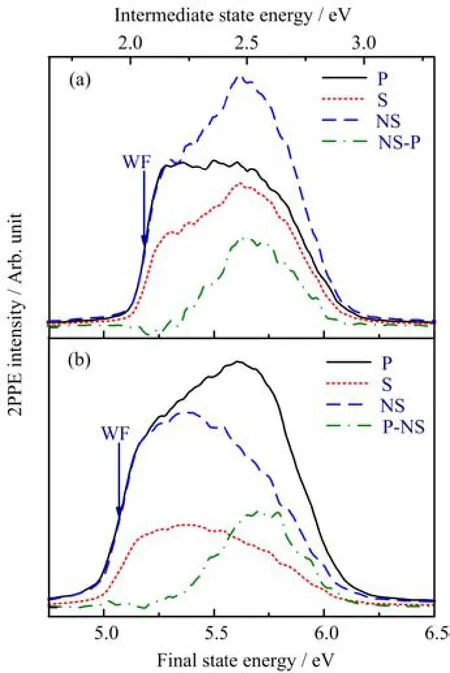
Beforetheadsorptionofmethanol,theelectronic structures of both clean TiO2(011)-(2×1)and TiO2(110)-(1×1)are characterized and compared by 2PPE(Fig.4).In the present work,the incident planes are the horizontal planes along the[01¯1]and[1¯10]for TiO2(011)-(2×1)and(110)-(1×1),respectively(Fig.2 and Fig.3).In accord with our previous studies[31], the work function(de fi ned as the half intensity point of the secondary electron edge)of the clean TiO2(110)-(1×1)is 5.1 eV,and an excited state at 2.5 eV above the EFis detected by the 2PPE spectra acquired by p-polarized(p-2PPE)rather than s-polarized light(s-2PPE).The net excited state signal was obtained by subtracting the normalized s-2PPE from the p-2PPE (P-NS in Fig.4(b)).Whereas the 2PPE measurements on TiO2(011)-(2×1)show some di ff erences compared with(110)-(1×1).First of all,the work function is about 0.1 eV higher,although the preparation history of these two surfaces is similar.As the work function re fl ect the reduction of the surfaces,this result indicates the(110)is easier to reduce than(011),which is consistent with the stronger band gap state signal on the former surface measured by UPS[25].The most prominent di ff erence comes from the polarization dependence of the excited state.For TiO2(110)-(1×1), when the incident plane is along[1¯10]azimuth,the excited state can only be detected by p-polarized,while the s-polarized light is totally“blind”to this state. However,on TiO2(011)-(2×1)(Fig.4(a)),when the incident plane is along[01¯1]azimuth,s-2PPE is much more pronounced at 5.6 eV( fi nal state energy)than p-2PPE.We have proven the resonance at 5.6 eV is from an excited state in both s-2PPE and p-2PPE.The varied polarization dependence of the excited state on TiO2(011)-(2×1)and TiO2(110)-(1×1)suggests di ff erent transition dipole moment relative to the distinct surface.The excited states on both surfaces show little angular dependence,suggesting the localized character. In addition,the lifetime of the excited states are too short to measure according to the TR-2PPE using 90 fs width pulse.
The photochemistry of alcohol on TiO2(110)-(1×1) investigated by 2PPE has been reported by our group in the last several years[28,32−35].Figure 5 shows the 2PPE measurements of the 0.5 ML methanol covered TiO2(011)-(2×1)(a)and TiO2(110)-(1×1)(b),after the methanol/TiO2interfaces have been exposed to the 2PPE probe light for more than 200 and 2000 s in the case of(011)and(110)surface respectively.Compared with the bare surfaces,the 2PPE spectra on both methanol covered TiO2interfaces showed similar angular distribution,lifetime,decrease of work function and increase of the overall intensity[36].The excited states become much more pronounced,and moreover, no change in the light polarization dependence of the 2PPE has been detected.

FIG.4 Typical 2PPE spectra for the clean(a)TiO2(011)-(2×1)and(b)TiO2(110)-(1×1)surfaces respectively.The spectra were measured with both p-polarized(P)and spolarized(S)light with a photon energy of 3.10 eV.For comparison,S was normalized to P at the secondary electron signal edge.NS-P or P-NS denotes the di ff erence spectra.The signal was integrated from−5◦to+5◦.Energies are measured with respect to EF;those in the bottom axis represent fi nal state,after absorption of two photons,while those in the top X-axis refer to the intermediate state,before absorption of the second photon.Work function(WF)is labeled by the arrow at the middle of the secondary electron edge.The incident planes are the horizontal planes along the [01¯1]and[1¯10]for TiO2(011)-(2×1)and TiO2(110)-(1×1), respectively.
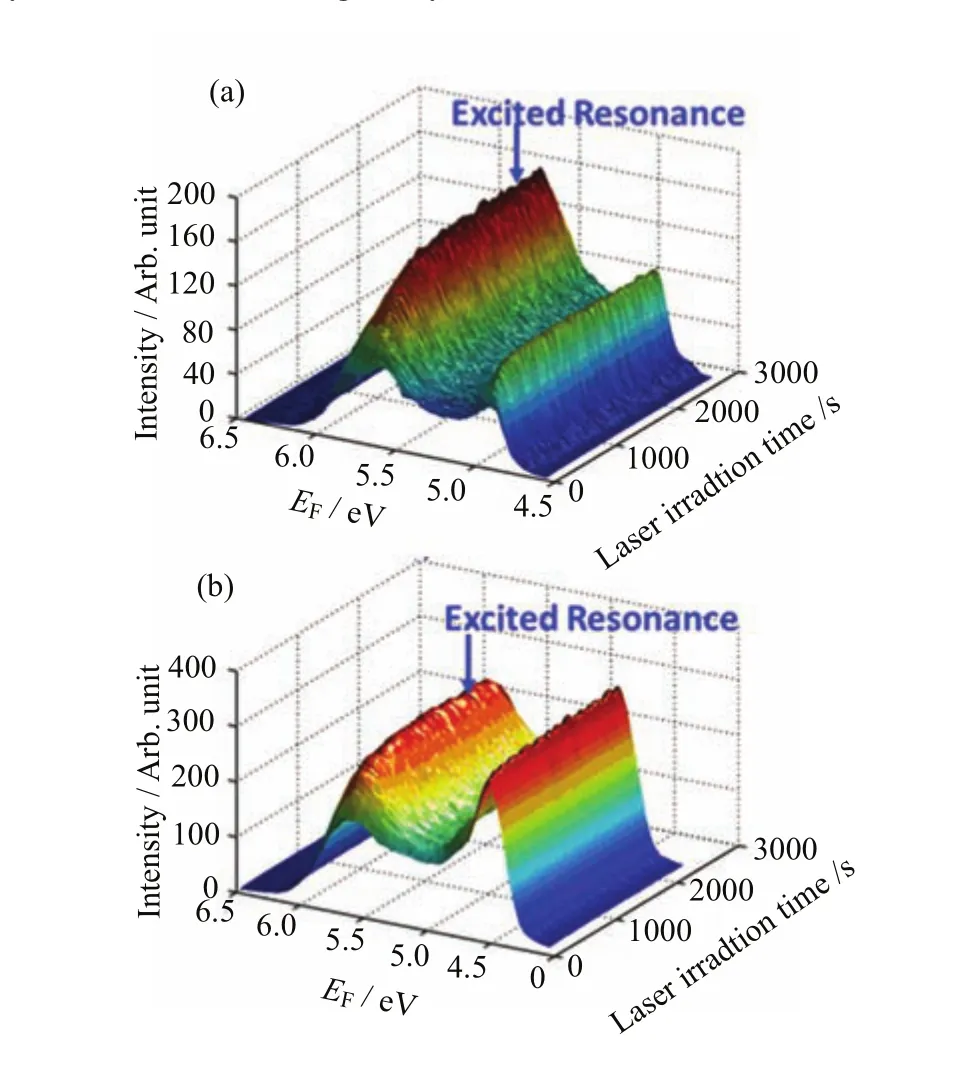
TD-2PPEshowedtheevolutionoftheelectronicstructureasafunctionoflightirradiation on both methanol covered TiO2(011)-(2×1)and TiO2TiO2(110)-(1×1)(Fig.6).During the TD-2PPE measurements,the probe light was directed to the methanol/TiO2interface without any interruption,and the 2PPE spectra were collected every second.The irradiation dependence of the excited resonance signal suggests the occurrence of photoinduced chemistry on the methanol/TiO2interfaces.The excited resonance signal on methanol/TiO2(110)-(1×1)(Fig.6(b))increased by 68%when the light exposure time was increased from zero to 200 s.While on methanol/TiO2(011)-(2×1) (Fig.6(a)),this signal was doubled when the irradiation time reached 2000 s.It should be noted in Fig.6, the 2PPE spectra were acquired by p-polarized and s-polarized light on TiO2(110)-(1×1)and TiO2(011)-(2×1)interface respectively to maximize the excited resonance signal.

FIG.5 Typical 2PPE spectra for the 0.5 ML methanol covered(a)TiO2(011)-(2×1)and(b)TiO2(110)-(1×1)surfaces respectively.The signal was integrated from−5◦to +5◦.Energies are measured with respect to EF.Before the acquisition of these spectra,the TiO2(011)-(2×1)and TiO2(110)-(1×1)interfaces has been exposed to the 2PPE light for more than 2000 and 200 s respectively.
Since the energy level,angular distribution,lifetime and the light polarization dependence of the excited state are similar,it is natural for one to think the origins of the excited states on both clean and adsorbated covered TiO2are the same.In our most recently combined 2PPE and density functions theory(DFT)calculations study[31],we have demonstrated the band gap state and the excited state at about 2.5 eV above the EFof TiO2(110)-(1×1)result from the splitting of the d orbitals of Ti3+in the distorted octahedral fi eld.This means both the band gap state and the excited state we discuss here are indicators for reduction of TiO2surface.And on TiO2(011)-(2×1),we have proven this conclusion is still correct(data are not shown).The irradiation dependence of the electronic structure on methanol/TiO2interfaces is consistent with our interpretation to the excited state on clean TiO2surfaces.As revealed by TPD studies,methanol on both TiO2(011)-(2×1)and TiO2(110)-(1×1)experienced photocatalyzed oxidation under UV exposure, releasing hydrogen atoms onto the surface bridge oxygen atoms to produce hydroxyls.Similar to the creation of surface Ovand subsurface Ti interstitials,hydroxylation is another way to reduce the TiO2surface[29].Therefore,as methanol molecules are split by UV light,more and more hydrogen atoms are deposited onto the TiO2interface where more and more Ti3+ions are generated.Consequently,the density of states(DOS)of both the band gap state and the excited state become intensi fi ed.As demonstrated,the 2PPE measured excited resonance signal scales linearly with the coverage of surface hydroxyls on clean TiO2surface [31].Furthermore,on adsorbate(methanol or water) covered TiO2,the excited resonance signal is also proportional to the density of coadsorbed hydroxyls(data not shown).Therefore,the increase of the excited resonance signal during the photochemistry of methanol in fact re fl ects the accumulation of surface hydroxyls on TiO2interface.

FIG.6 2PPE spectra for the 0.5 ML methanol covered (a)TiO2(011)-(2×1)and(b)TiO2(110)-(1×1)as a function of the probe laser irradiation time.Most of the laser parameters(center wavelength,band width and power)in the two experimental measurements were exactly the same except the polarization.On TiO2(110)-(1×1)and TiO2(011)-(2×1) interfaces,2PPE spectra were acquired by p-polarized and s-polarized light respectively to maximize the excited resonance signal.The signal in these spectra was integrated from−5◦to+5◦.The energies were measured with respect to the Fermi level.
Since the 2PPE measured excited resonance signal is an indicator of the density of hydroxyls on TiO2interface,it provides a fi ngerprint to trace the kinetics of the photocatalyzed oxidation of methanol on TiO2. Figure 7 displays the time-dependent excited resonance together with the fi tting by a fractal-like model[28, 32,33].On TiO2(011)-(2×1),the signal was integrated between 5.25 and 6.20 eV from s-2PPE(Fig.6(a)), whereas on TiO2(110)-(1×1),the excited resonance was accumulated in a span of 5.00−6.25 eV from p-2PPE(Fig.6(b)).Although the photocatalytic chemical reactions of methanol on both TiO2(011)-(2×1)and TiO2(110)-(1×1)are similar,the reaction rate,however,di ff ers dramatically from each other.From Fig.7,one can see that it takes 61.3 s for the excited resonance signal on TiO2(110)-(1×1)to rise to 90%of the maximum signal level,while on TiO2(011)-(2×1),it costs 698.3 s,showing a 11.4 times di ff erence from the reaction rate.The photocatalyzed oxidation of methanol on TiO2(011)-(2×1)is less e ffi cient than on TiO2(110)-(1×1),in accord with our previous TPD investigation [26].In the same work,our DFT calculations provided some interpretation to the di ff erence of the photocatalyzed oxidation of methanol on these two TiO2surfaces.Methanol molecules are converted into methoxy before further photoxidation to formaldehyde,and the cleavage of C−H bond on both TiO2(011)-(2×1)and TiO2(110)-(1×1)are the rate determining step during the photoxidation of methanol.Nevertheless,due to the corrugated structure,the distance between the nearest surface oxygen atoms and the methyl hydrogen of methoxy intermediate on TiO2(011)-(2×1)is 0.3˚A larger than that on TiO2(110)-(1×1),leading to the 0.2 eV higher reaction barrier of break of the C−H bond.Anisotropic bulk charge transportation along different directions might also be a factor which a ff ects the surface dependence of photochemistry[24].

TABLE I Comparison of the light source parameters in the 2PPE and TPD studies.

FIG.7 Normalized time dependent signal of the excited resonance feature of 0.5 ML methanol covered TiO2(011)-(2×1)(blue circle)and TiO2(110)-(1×1)(olive circle)and the fractal-like kinetics model fi tting(red line). On TiO2(011)-(2×1),the signal was integrated between 5.25 and 6.20 eV from s-2PPE(Fig.6(a)),whereas on TiO2(110)-(1×1),the excited resonance was accumulated in a span of 5.00−6.25 eV from p-2PPE(Fig.6(b)).
Thoughbothour2PPEandTPD[26]measurements suggest TiO2(011)-(2×1)is less e ffi cient than TiO2(110)-(1×1)towards the photooxidation of methanol,the relative photoreactivity obtained in these two studies are di ff erent.In the present 2PPE work,the reaction rate on TiO2(110)-(1×1)is 11.4 times faster, while the TPD results show a 2.4 times of di ff erence. The discrepancy possibly originates from the di ff erent light source chosen in these two studies(Table I).The fl ux(number of photons per unit area per second)in the TPD experiments is about 60 times of that in the 2PPE measurements.It is well known the light fl ux a ff ects the dynamics of the charge carriers signi fi cantly [37].It has also been proven the charge carrier transportation in TiO2is anisotropic[38].Therefore,it is possible the dependence of the charge carrier kinetics and dynamics on the light fl ux along[110]and[011] direction are di ff erent,which might lead to the discrepancy in the relative photoreactivity under di ff erent light irradiation condition.However,in both studies,we have found TiO2(011)-(2×1)is inferior to TiO2(110)-(1×1) towards the photooxidation of methanol.
Our previous[26]and present investigations of the photooxidation of methanol on TiO2(011)-(2×1)and TiO2(110)-(1×1)show inconsistency with others’work which suggest TiO2(011)is more e ffi cient towards photooxidation reactions than TiO2(110)[20,23].The discrepancy likely originates from the structure of the TiO2photocatalyst.It is worth noting the photoreactivity tested in Ref.[20,23]is in aqueous environment which often alters the surface structure dramatically,causing it di ffi cult to establish the correlation between activity and surface structure from an atomic level[39].To avoid such complexity,photocatalysis studied in UHV condition is necessary.Since the surface structure in vacuum can be well characterized,and submonolayer adsorbates usually change the surface structure slightly [40].
IV.CONCLUSION
We have investigated the electronic structure of clean and methanol covered TiO2(011)-(2×1)and TiO2(110)-(1×1).An excited state at 2.5 eV above the EFon all the four TiO2interfaces(clean and methanol covered (011)and(110))studied here has been detected.The energy level,angular distribution and lifetime of this excited state are similar on both(110)and(011)interfaces.However,the transition dipole moment shows di ff erent con fi guration relative to the interfaces.The excited state is an indicator of reduction of TiO2interface.Irradiation dependence of the excited resonance signal during the photochemistry of methanol on TiO2(011)-(2×1)and TiO2(110)-(1×1)is attributed to the reduction of the interfaces by depositing hydrogenatoms.The reaction rate of photooxidation of methanol on TiO2(110)-(1×1)is about 11.4 times faster than that on TiO2(011)-(2×1),which is tentatively explained by the di ff erence in the surface atomic con fi guration.
This work not only provides a detailed characterization of the electronic structure of methanol/TiO2interface by 2PPE,but also shows the importance of the surface structure in the photoreactivity on TiO2. Anisotropy of the surface properties are attracting more and more attention.For example,charge separation in photocatalysis has been successfully realized by constructing heterostructures with di ff erent facets[41]. Therefore,studying the properties of individual surface and the dependence on the surfaces are desirable.
V.ACKNOWLEDGMENTS
ThisworkwassupportedtheNaturalScience Foundation of Liaoning Province(No.2015020242), the National Natural Science Foundation of China (No.21203189 and No.21573225),and the State Key Laboratory of Molecular Reaction Dynamics(No.ZZ-2014-02).
[1]A.L.Linsebigler,G.Q.Lu,and J.T.Yates,Chem. Rev.95,735(1995).
[2]U.Diebold,Surf.Sci.Rep.48,53(2003).
[3]Q.Guo,C.Zhou,Z.Ma,Z.Ren,H.Fan,and X.Yang, Chem.Soc.Rev.DOI:10.1039/c5cs00448,(2015).
[4]C.Xu,W.Yang,Q.Guo,D.Dai,M.Chen,and X. Yang,J.Am.Chem.Soc.135,10206(2013).
[5]C.Xu,W.Yang,Q.Guo,D.Dai,M.Chen,and X. Yang,J.Am.Chem.Soc.136,602(2014).
[6]A.Vittadini,A.Selloni,F.P.Rotzinger,and M. Gratzel,Phys.Rev.Lett.81,2954(1998).
[7]H.G.Yang,C.H.Sun,S.Z.Qiao,J.Zou,G.Liu,S.C. Smith,H.M.Cheng,and G.Q.Lu,Nature 453,638 (2008).
[8]G.Liu,H.G.Yang,J.Pan,Y.Q.Yang,G.Q.Lu,and H.M.Cheng,Chem.Rev.114,9559(2014).
[9]V.E.Henrich,G.Dresselhaus,and H.J.Zeiger,Phys. Rev.Lett.36,1335(1976).
[10]S.Wendt,P.T.Sprunger,E.Lira,G.K.H.Madsen, Z.S.Li,J.O.Hansen,J.Matthiesen,A.Blekinge-Rasmussen,E.Laegsgaard,B.Hammer,and F.Besenbacher,Science 320,1755(2008).
[11]T.J.Beck,A.Klust,M.Batzill,U.Diebold,C.Di Valentin,and A.Selloni,Phys.Rev.Lett.93,036104 (2004).
[12]X.Torrelles,G.Cabailh,R.Lindsay,O.Bikondoa,J. Roy,J.Zegenhagen,G.Teobaldi,W.A.Hofer,and G. Thornton,Phys.Rev.Lett.101,185501(2008).
[13]S.E.Chamberlin,C.J.Hirschmugl,H.C.Poon,and D.K.Saldin,Surf.Sci.603,3367(2009).
[14]X.Q.Gong,N.Khorshidi,A.Stierle,V.Vonk,C. Ellinger,H.Dosch,H.Z.Cheng,A.Selloni,Y.B.He, O.Dulub,and U.Diebold,Surface Science 603,138 (2009).
[15]T.Woolcot,G.Teobaldi,C.L.Pang,N.S.Beglitis,A. J.Fisher,W.A.Hofer,and G.Thornton,Phys.Rev. Lett.109,156105(2012).
[16]P.A.M.Hotsenpiller,J.D.Bolt,W.E.Farneth,J.B. Lowekamp,and G.S.Rohrer,J.Phys.Chem.B 102, 3216(1998).
[17]J.B.Lowekamp,G.S.Rohrer,P.A.M.Hotsenpiller, J.D.Bolt,and W.E.Farneth,J.Phys.Chem.B 102, 7323(1998).
[18]T.Sugiura,S.Itoh,T.Ooi,T.Yoshida,K.Kuroda,and H.Minoura,J.Electroanal.Chem.473,204(1999).
[19]A.Tsujiko,T.Kisumi,Y.Magari,K.Murakoshi,and Y.Nakato,J Phys.Chem.B 104,4873(2000).
[20]T.Ohno,K.Sarukawa,and M.Matsumura,New J. Chem.26,1167(2002).
[21]A.Y.Ahmed,T.A.Kandiel,T.Oekermann,and D. Bahnemann,J.Phys.Chem.Lett.2,2461(2011).
[22]Y.Nakabayashi and Y.Nosaka,J.Phys.Chem.C 117, 23832(2013).
[23]H.Takahashi,R.Watanabe,Y.Miyauchi,and G.Mizutani,J.Chem.Phys.134,154704(2011).
[24]T.Luttrell,S.Halpegamage,J.Tao,A.Kramer,E. Sutter,and M.Batzill,Sci.Rep.4,4043(2014).
[25]J.G.Tao and M.Batzill,J.Phys.Chem.Lett.1,3200 (2010).
[26]X.Mao,Z.Wang,X.Lang,Q.Hao,B.Wen,D.Dai,C. Zhou,L.M.Liu,and X.Yang,J.Phys.Chem.C 119, 6121(2015).
[27]Z.F.Ren,C.Y.Zhou,Z.B.Ma,C.L.Xiao,X.C. Mao,D.X.Dai,J.LaRue,R.Cooper,A.M.Wodtke, and X.M.Yang,Chin.J.Chem.Phys.23,255(2010). [28]C.Zhou,Z.Ma,Z.Ren,A.M.Wodtke,and X.Yang, Energy Environ.Sci.5,6833(2012).
[29]X.C.Mao,X.F.Lang,Z.Q.Wang,Q.Q.Hao,B. Wen,Z.F.Ren,D.X.Dai,C.Y.Zhou,L.M.Liu,and X.M.Yang,J.Phys.Chem.Lett.4,3839(2013).
[30]J.Tao,Q.Cuan,X.Q.Gong,and M.Batzill,J.Phys. Chem.C 116,20438(2012).
[31]Z.Wang,B.Wen,Q.Hao,L.M.Liu,C.Zhou,X.Mao, X.Lang,W.J.Yin,D.Dai,A.Selloni,and X.Yang, J.Am.Chem.Soc.137,9146(2015).
[32]C.Y.Zhou,Z.F.Ren,S.J.Tan,Z.B.Ma,X.C.Mao, D.X.Dai,H.J.Fan,X.M.Yang,J.LaRue,R.Cooper, A.M.Wodtke,Z.Wang,Z.Y.Li,B.Wang,J.L.Yang, and J.G.Hou,Chem.Sci.1,575(2010).
[33]C.Zhou,Z.Ma,Z.Ren,X.Mao,D.Dai,and X.Yang, Chem.Sci.2,1980(2011).
[34]Z.Ma,Q.Guo,X.Mao,Z.Ren,X.Wang,C.Xu,W. Yang,D.Dai,C.Zhou,H.Fan,and X.Yang,J.Phys. Chem.C 117,10336(2013).
[35]Z.B.Ma,C.Y.Zhou,X.C.Mao,Z.F.Ren,D.X.Dai, and X.M.Yang,Chin.J.Chem.Phys.26,1(2013).
[36]Z.Wang,Q.Hao,X.Mao,C.Zhou,Z.Ma,Z.Ren,D. Dai,and X.Yang,Chin.J.Chem.Phys.28,123(2015). [37]Y.Tamaki,A.Furube,M.Murai,K.Hara,R.Katoh, and M.Tachiya,Phys.Chem.Chem.Phys.9,1453 (2007).
[38]L.Thulin and J.Guerra,Phys.Rev.B 77,195112 (2008).
[39]U.Aschauer and A.Selloni,Phys.Rev.Lett.106, 166102(2011).
[40]R.S.de Armas,J.Oviedo,M.A.San Miguel,and J. F.Sanz,J.Phys.Chem.C 111,10023(2007).
[41]R.Li,F.Zhang,D.Wang,J.Yang,M.Li,J.Zhu,X. Zhou,H.Han,and C.Li,Nat.Commun.4,1432(2013).
 CHINESE JOURNAL OF CHEMICAL PHYSICS2016年1期
- CHINESE JOURNAL OF CHEMICAL PHYSICS的其它文章
- ARTICLE E ffi cient Separation of Ar and Kr from Environmental Samples for Trace Radioactive Noble Gas Detection†
- ARTICLE Spectrum Correction in Study of Solvation Dynamics by Fluorescence Non-collinear Optical Parametric Ampli fi cation Spectroscopy†
- I.INTRODUCTION
- ARTICLE High-Resolution Experimental Study on Photodissocaition of N2O†
- ARTICLE In situ Detection of Amide A Bands of Proteins in Water by Raman Ratio Spectrum†
- ARTICLE Photoelectron Spectroscopy and Density Functional Calculations of TiGen−(n=7−12)Clusters†
