ARTICLE Structural Dynamics of Phenyl Azide in Light-Absorbing Excited States: Resonance Raman and Quantum Mechanical Calculation Study†
Rong-dan Yuan,Jia-dan Xue,Xu-ming Zheng∗Department of Chemistry,Zhejiang Sci-Tech University,Hangzhou 310018,China
ARTICLE Structural Dynamics of Phenyl Azide in Light-Absorbing Excited States: Resonance Raman and Quantum Mechanical Calculation Study†
Rong-dan Yuan,Jia-dan Xue,Xu-ming Zheng∗
Department of Chemistry,Zhejiang Sci-Tech University,Hangzhou 310018,China
(Dated:Received on October 15,2015;Accepted on December 8,2015)
The excited state structural dynamics of phenyl azide(PhN3)after excitation to the light absorbing S2(A′),S3(A′),and S6(A′)states were studied using the resonance Raman spectroscopy and complete active space self-consistent fi eld calculations.The vibrational spectra and the UV absorption bands were assigned on the basis of the Fourier transform(FT)-Raman,FT-infrared measurements,the density-functional theory computations and the normal mode analysis.The A-,B-,and C-bands resonance Raman spectra in cyclohexane,acetonitrile,and methanol solvents were,respectively,obtained at 273.9,252.7,245.9, 228.7,223.1,and 208.8 nm excitation wavelengths to probe the corresponding structural dynamics of PhN3.The results indicated that the structural dynamics in the S2(A′),S3(A′), and S6(A′)states were signi fi cantly di ff erent.The crossing points of the potential energy surfaces,S2S1(1)and S2S1(2),were predicted to play a key role in the low-lying excited state decay dynamics,in accordance with Kasha’s rule,and N7=N8 dissociation.Two decay channels initiated from the Franck-Condon region of the S2(A′)state were predicted:the radiative S2,min→S0radiative decay and the S2→S1internal conversion through the crossing points S2S1(1)/S2S1(2).
Key words:Phenyl azide,Structural dynamics,Decay dynamics,Resonance Raman spectroscopy,CASSCF calculation,Curve-crossing
†Part of the special issue for“the Chinese Chemical Society’s 14th National Chemical Dynamics Symposium”.
∗Author to whom correspondence should be addressed.E-mail: zxm@zstu.edu.cn,Tel.:+86-571-86843699
I.INTRODUCTION
Photolysis of the aromatic azides(PhN3)in UV light region has been known to produce the short-lived singlet phenylnitrene(PhN)intermediates and N2molecule[1–4].The quantum yields were determined to be close to unity and in the range of 0.1−0.7 for the photodissociation of naphthyl azides and simple phenyl azides respectively[5–7].The quantum chemical calculation revealed that the S2state of the azide was bound and there was a lower barrier toward arylnitrene formation in the S1state of the azide[7].This consisted with the experimental observations that simple phenyl,biphenylyl,and naphthyl azides did not have any observable fl uorescence.The early events of the photochemistry of three aryl azides(para-and orthobiphenylyl azides,1-naphthyl azide)were studied by ultrafast spectroscopy and quantum chemical calculations [8].The S2state lifetimes of aryl azides were measured to be hundreds of femtoseconds by using the transient absorption spectroscopy.The S2state of the azides decayed with the growth of the transient absorptions of the corresponding singlet nitrenes.Quantum chemical calculations predicted that the arylnitrenes were formed in the S1states of the azides with a lower reaction barrier if the azides were initially populated in the S2state,in accordance with Kasha’s rule[8].The photochemistry of 4-amino-3-nitrophenyl azide,a widely used photoa ffi nity labeling system,was studied by using the transient absorption spectroscopy(femtosecond to microsecond time scale)and employing a theoretical perspective.The results showed that nitrene generated from the S2surface of azide,in violation of Kasha’s rule[9].
Relative to the comprehensive studies of the nitrene chemistry,studies on the non-adiabatic decay dynamics and decomposition mechanism of aryl azides initiated from the light absorbing S2states were limited.It was not certain whether the singlet nitrene intermediate was formed from the light absorbing Sn(n≥2)states (in violation of Kasha’s rule)or in the subsequent dark S1state(in accordance with Kasha’s rule).Little has been known about the relationship between the quantum yields of the photodecomposition of the naphthyl azides and the decay channels of the formation of the corresponding niterenes.Therefore,in this work,the decay dynamics of phenyl azide initiated from the light absorbing S2state was studied by using the resonance Raman spectroscopy and quantum mechanical calculations.The resonance Raman spectra covering di ff erentexcited states were obtained to predict the underlying structural dynamics and the possible curve-crossings. CASSCF and TD-DFT calculations were carried out to reveal the excited state structures and help to determine the decay mechanism burried behind the resonance Raman intensity patterns.Both the radiative and nonradiative decay channels were found to occur in the S2state of the phenyl azide.The reaction mechanism of the nitrene formation were proposed.
II.EXPERIMENTS AND CALCULATIONS
The Fourier transform(FT)-Raman and FT-IR spectra were obtained with 2 cm−1resolution using FTRaman spectrometer at 1064 nm excitation(Thermo Nicolet 960,Thermo Fisher Nicolet,USA)and FTIR spectrometer(Thermo Nicolet avatar 370,Thermo Fisher Nicolet,USA).The UV absorption spectra were measured using UV/visible spectrometer(UV-2501PC, Shimadzu,Japan).
The resonance Raman experimental method and apparatus have been described previously[10],so only a short description will be provided here.The harmonics of a nanosecond Nd:YAG laser and their hydrogen Raman shifted laser lines were employed to generate the 266.0,273.9,282.4,299.1 and 309.1 nm excitation wavelengths utilized in the resonance Raman experiments. The excitation laser beam used a~100µJ pulse energy loosely focused to a 0.5−1.0 mm diameter spot size onto a fl owing liquid stream of sample.A backscattering geometry was employed for collection of the Raman scattered light by re fl ective optics that imaged the light through a polarizer and entrance slit of a 0.5 m spectrograph and the grating of the spectrograph dispersed the light onto a liquid nitrogen cooled CCD mounted on the exit of the spectrograph.The Raman shifts of the resonance Raman spectra were calibrated with the known vibrational frequencies of acetonitrile Raman bands.To fully subtract the solvent Raman bands from the resonance Raman spectra of the sample solutions and to accurately measure the absolute resonance Raman cross-sections,the sensitivity-correction[11–15]for the wavelength dependence of the e ffi ciency of the collecting system(including the optical,the monochromator,and the detector),and the reabsorption-correction for the sample’s absorbance in backscattering geometry [11,12,16]are taken into consideration,which uses our self-programming routine coded in Origin 6.0 software. The pure solvent Raman spectrum at certain excitation wavelength is scaled by a proper factor,which depends on the self absorption correction factor using angles of incidence which varies from 60◦to 40◦in our procedure, until the intensities of the scaled solvent Raman bands matches those of the corresponding bands in the sample resonance Raman spectrum at the same excitation wavelength.Sections of the resonance Raman spectra were fi t to a baseline plus a sum of Lorentzian bands to determine the integrated areas of the Raman bands of interest.The spectral resolution is about 3 cm−1for the resonance Raman spectra.

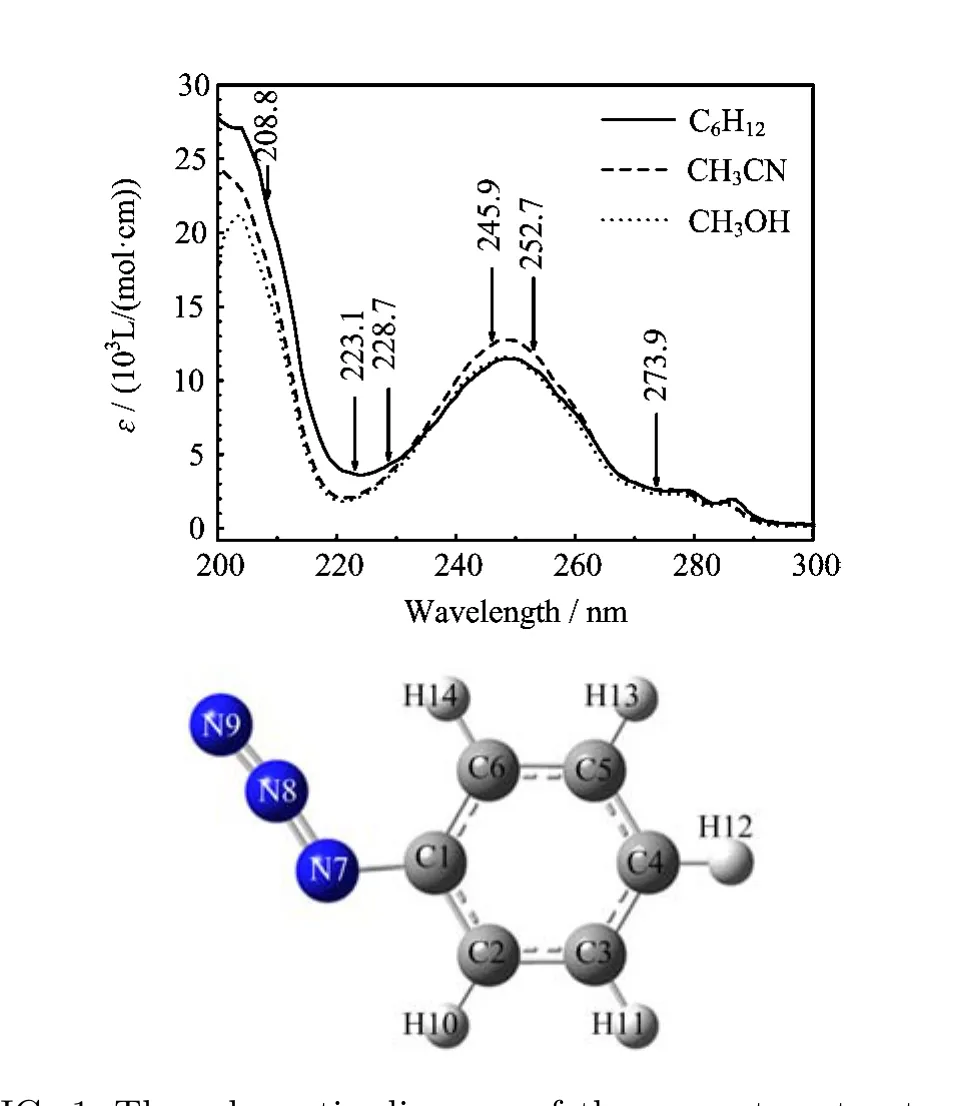
FIG.1 The schematic diagram of the geometry structure and UV absorption spectra of PhN3in cyclohexane,acetonitrile and methanol.
The geometric structure optimization and vibrational frequency computation were done using the B3LYP/6-31+G(d)level of theory.The S0→Snvertical transition energies were estimated at B3LYP-TD/6-31+G(d) levels of theory employing a self-consistent reaction fi eld(SCRF),polarized continuum overlapping spheres model(PCM).The complete active space self-consistent fi eld(CASSCF)theory was used to study the excited state structures and decay mechanism of PhN3.The curve-crossing points between electronic excited states were computed at CASSCF(8,7)/6-31G(d)level.An active space with 8 electrons in 7 orbitals is referred to as CASSCF(8,7)hereafter.All of the quantum mechanical calculations were done using the Gaussian 03 program[17].The normal mode analysis is done using the VEDA4 program coded by Jamr´oz[18].
III.RESULTS AND DISCUSSION
A.UV absorption spectra and electronic transitions
Figure 1 shows the schematic diagram of the geometry structure and the UV absorption spectra of PhN3in cyclohexane,acetonitrile and methanol with the laser excitation wavelengths indicated above the spectral curves.The experimental UV spectra in three solvents are in shape and in λmax(wavelength at the

TABLE I B3LYP-TD/6-31+G(d)computed electronic transition energies and oscillator strengths f of PhN3in acetonitrile using PCM solvent model.

aThe data in parentheses are orbital coe ffi cents. maximum absorption)very close to one another,and this suggests that the vertical electronic transition energies of PhN3depend little on the polarity and/or hydrogen bonding of solvents.Two broad experimental absorption bands are observed at λmax=279 nm(A-band) and 248 nm(B-band)in acetonitrile respectively in 220−300 nm spectral region with the oscillator strength for B-band absorption(f=0.2985)being much larger than that for the A-band absorption(f=0.0298).Table I lists the B3LYP-TD/6-31G(d)computed electronic transition energies,the molecular orbitals,and oscillator strengths of PhN3in acetonitrile using PCM solvent model.The calculated results display two transitionallowed absorption bands at 245 nm(f=0.3184)and 256 nm(f=0.0352),and this correlates well with the B-band(248 nm)and A-band(279 nm)absorptions respectively.
According to Table I,the orbitals 31 and 29 are the highest and third highest occupied π bonding orbitals(referred as πHand πH−2)respectively with thecorrespondingelectronicdensitiesdistributed among the whole molecular frame,while the orbital 30 is the second highest occupied π bonding orbital (πH−1)with the electronic density mostly partitioned in the benzene moiety.The orbital 33 is the second lowest unoccupied π∗anti-bonding orbital(π∗L+1)with the electronic density distributed among the whole molecular frame,while the orbital 34 is a π∗L+2orbital with the electronic density partitioned mostly in the benzene moiety.The orbital 32 is the lowest unoccupied π∗anti-bonding orbital(π∗L)formed via a Py-Py conjugation interaction of the N=N=N chromophore. Orbitals 35 and 36 are two di ff use orbitals,and they are designated as Ryd1and Ryd2.Therefore the A-, and B-band absorptions are assigned as a combined πH→π∗L+2(0.52)+πH→π∗L+1(0.34)+πH−1→π∗L+1(0.31)+ πH−1→π∗L+2(−0.10)transitions and a combined πH→π∗L+1(0.58)+πH→π∗L+2(−0.30)+πH−1→π∗L+1(−0.18)+ nH−3→π∗L(−0.15)transitions. B.Vibrational assignments of resonance Raman spectra
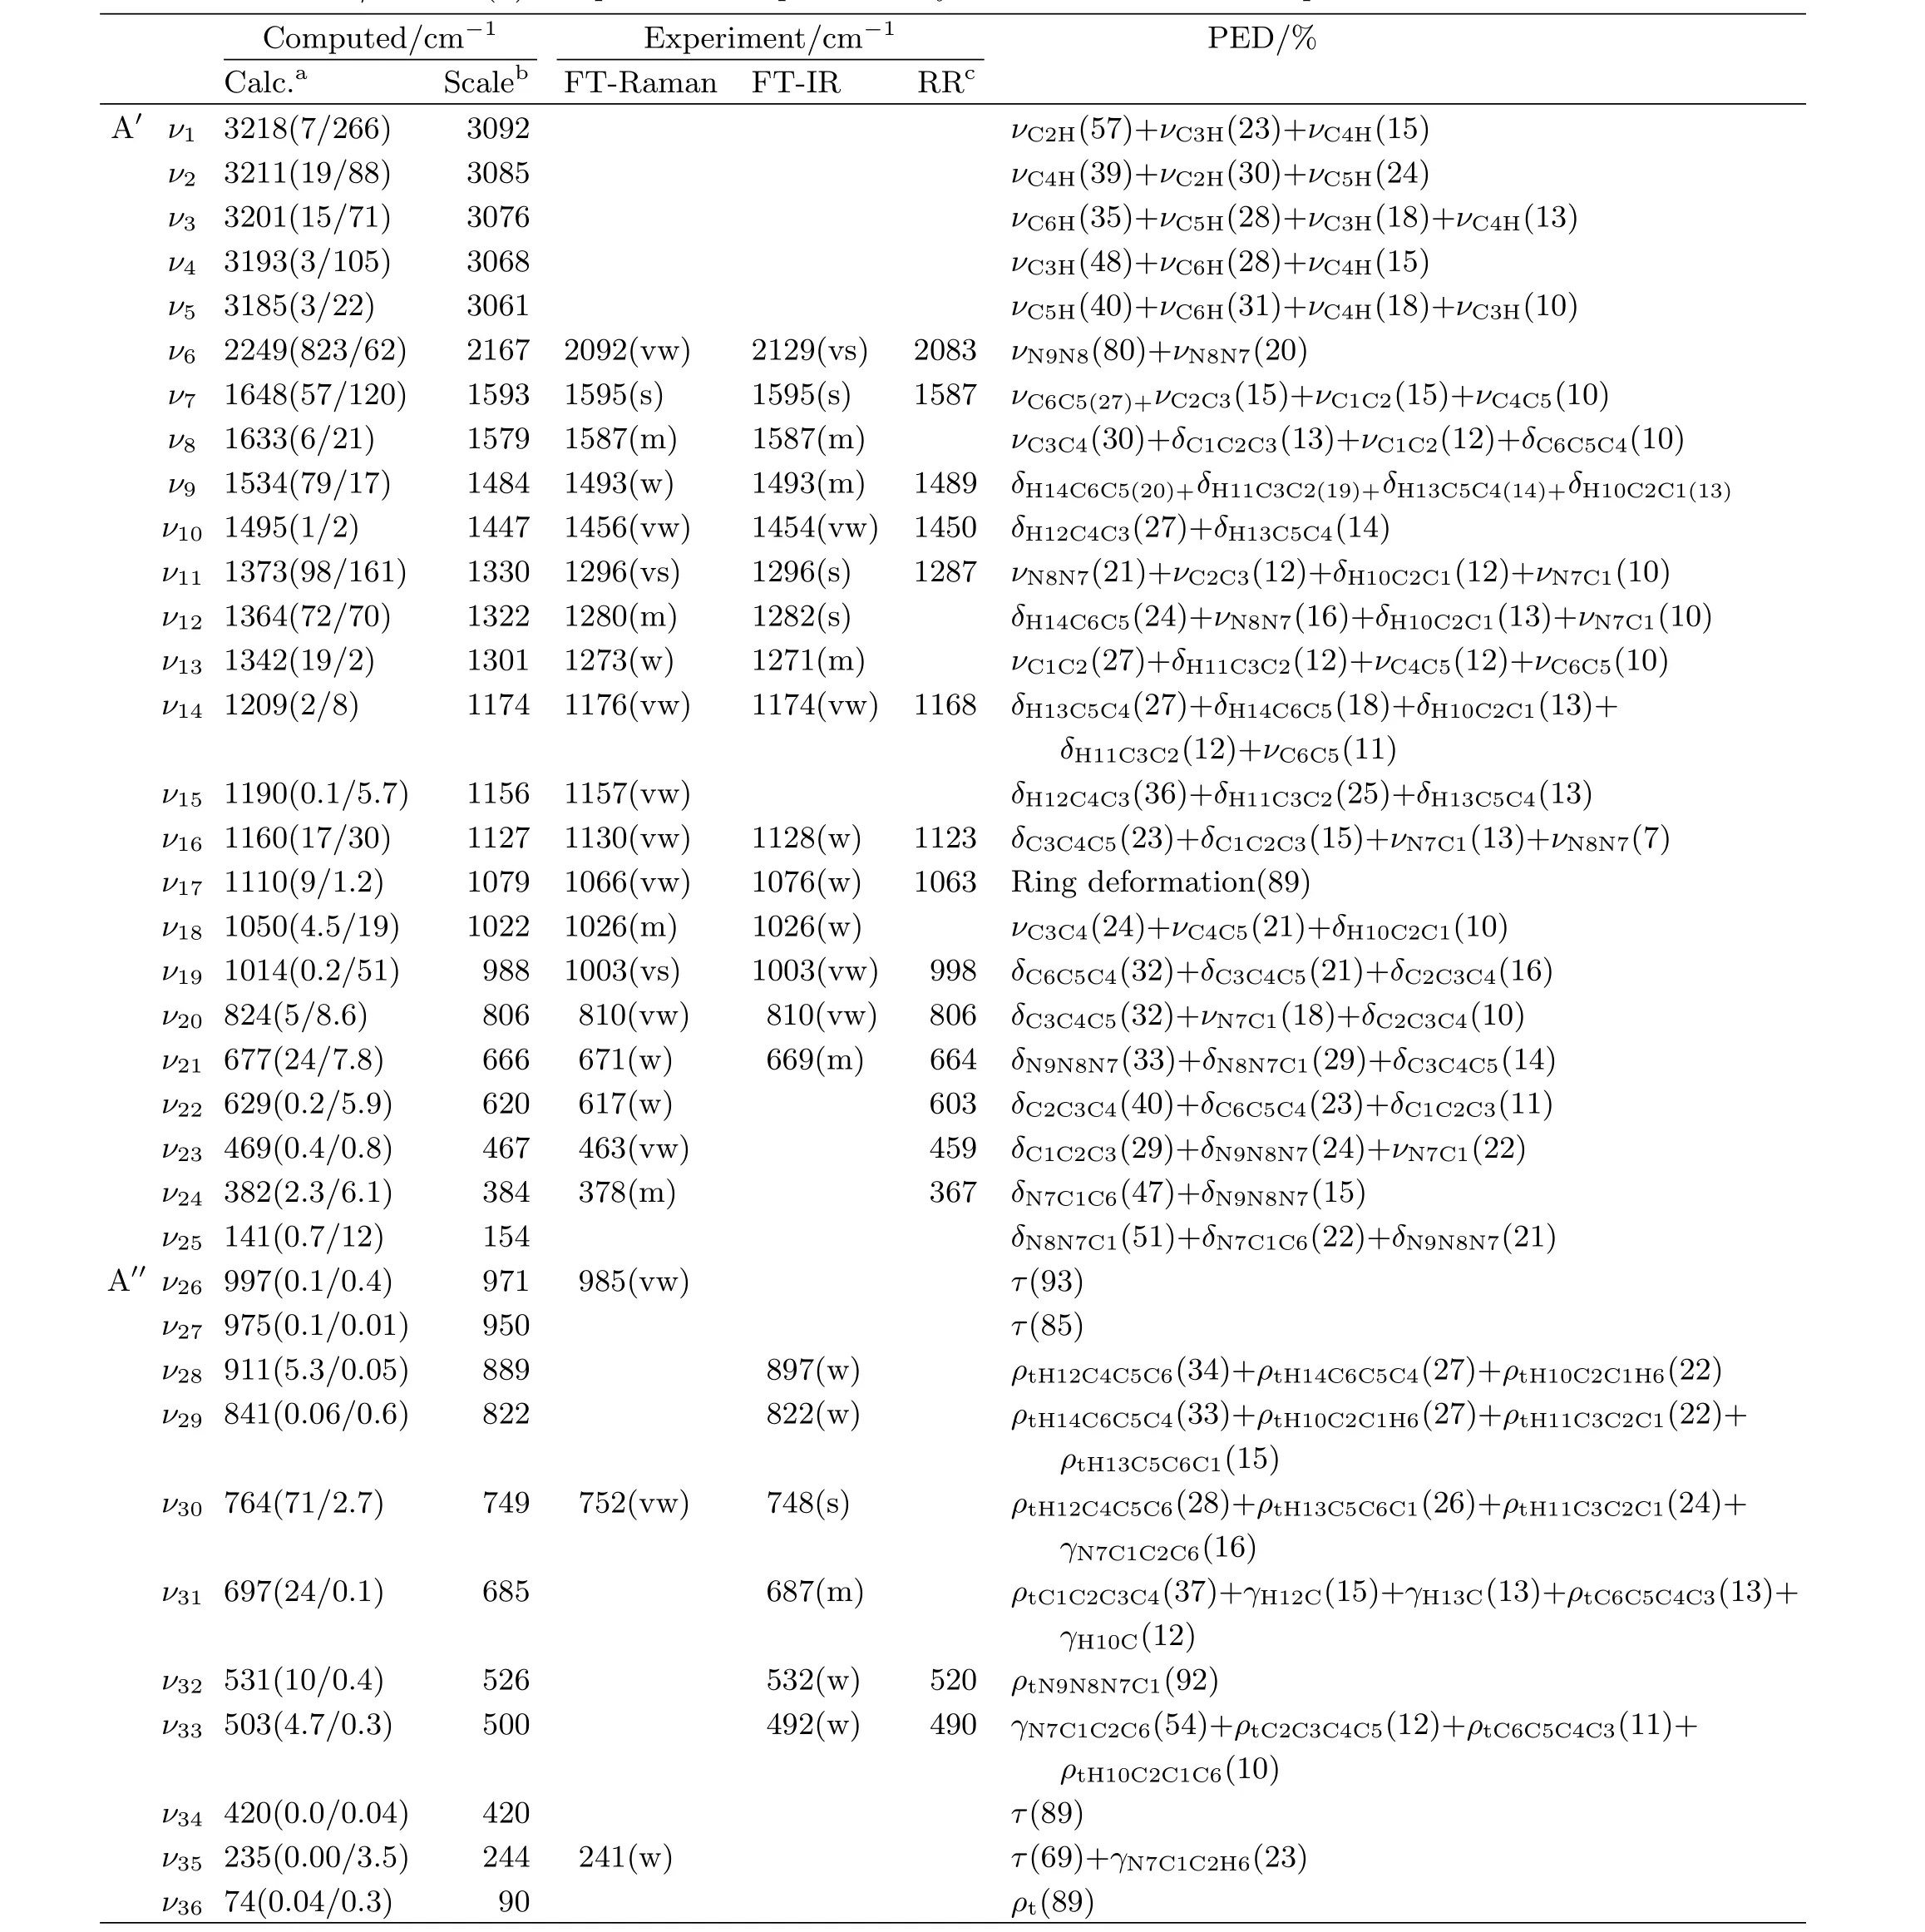
No report has been found on the vibrational assignments of PhN3.We have carried out the vibrational assignments for PhN3with the aids of the density functional theory calculations,the normal mode analysis and the vibrational spectroscopic measurements in order to help to assign the resonance Raman spectra. Figure 2 shows the experimental FT-Raman and FTIR spectra of PhN3in neat liquid and their correlation to the B3LYP/6-31+G(d)computed Raman spectrum.The normal mode analysis is also done to help the assignments.Table II lists the experimental and B3LYP/6-31+G(d)calculated vibrational frequencies as well as the vibrational assignments of PhN3.The calculated vibrational frequencies are spectroscopically scaled through the linear-regression of the B3LYP/6-31+G(d)calculated frequencies to the experimental observed ones.It appears that the correlation between the experimental frequencies and the spectroscopically scaled calculated ones are in good agreement.

FIG.2 Comparison of the FT-Raman and FT-IR spectra with the B3LYP/6-31+G(d)computed Raman spectrum of phenyl azide with the frequency value indicated.
Figure 3 displays overall views of the resonance Raman spectra of PhN3in acetonitrile,methanol and cyclohexane at six excitation wavelengths that cover across the A-,B-,and C-band absorptions.It shows that the intensity pattern of the resonance Raman spectra at a certain excitation wavelength in three di ff erent solvents is very similar to one another.This suggests that the polarity and/or the hydrogen bond of solvents have minor e ff ect on the slope of the interested excited state potential energy surfaces in the Franck-Condon region.Keep in mind that the experimental oscillator strength measured for the B-band absorption is about 10 times that for the A-band,and that the Raman intensity is proportion to the square of the oscillator strength(f2),we expect that 245.9 and 252.7 nm resonance Raman spectra shall mostly be in resonance with the S3(A′)state(B-band),while 208.8 nm resonance Raman spectrum shall be in resonance with the S6(A′)state(C-band).
Figure 4 shows the enlarged view of the resonance Raman spectra of PhN3in methanol.Most of the C-band resonance Raman spectra can be assigned as the fundamental modes ν7,ν11,ν19,ν9,and the overtones 2ν7, 2ν11,and combination bands ν11+ν19,2ν11+ν19,etc., while most of the B-band resonance Raman spectra can be assigned as the fundamental modes ν7,ν11,ν19, ν9,ν14,ν16,ν20,ν21,ν22,ν23,ν24,and the overtones 2ν11,3ν11,2ν7,3ν14,and combination bands ν11+ν24, ν11+ν23,ν11+ν19,ν11+ν16,ν11+ν14,2ν11+ν19,ν7+ν24, ν9+ν14,ν6+ν11,ν6+ν7,etc.The intensity patterns for the C-,and B-band resonance Raman spectra are signi fi cantly di ff erent since the relative band intensities vary signi fi cantly for the most intense fundamental modes(ν7,ν11,ν19,ν9),their overtones and combination bands as the excitations wavelengths go from 252.4 nm to 208.8 nm.This suggests that the normal mode displacements of the four most intense modes(ν7, ν11,ν19,ν9)that are along the S3(A′)excited state potential energy surfaces in the Franck-Condon region are considerably di ff erent from those that are along the S6(A′)excited state potential energy surfaces.Owing to the very intense fl uorescence interference,the 282.4 and 299.1 nm resonance Raman spectra are not obtained successfully.This retards us to extract the A-band short-time structural dynamics quantitatively.
The major di ff erence in the intensity patterns between the 228.7 nm(or 223.1 nm)resonance Raman spectra and the B-band,or C-band resonance Raman spectra is that the former has a moderate N9N8/N8N7 stretch mode ν6at 2086 cm−1,which is absent in the latter two spectra.Since the 228.7 and 223.1 nm excitation wavelengths fall in energy into the overlap region between the S3(A′)and S6(A′)states so that the corresponding resonance Raman spectra may contain important information on the state-coupling or curvecrossing among the higher-lying excited state.However,owing to the di ffi culties in the prediction of these curve-crossing points,we are unable to clarify the decay dynamics initiated from the S3(A′)and S6(A′)states.
Similarly,most of the 273.9 resonance Raman spectra can be assigned as approximately the thirteen fundamental modes(ν7,ν11,ν19,ν10,ν9,ν14,ν16,ν20, ν21,ν22,ν23,ν24,and ν6),the overtones(2ν11and 2ν7),and the combination bands(ν11+ν24,ν11+ν22, ν11+ν19,ν11+ν16,ν11+ν14,ν7+ν24,ν7+ν22,ν9+ν14, ν6+ν11,etc.).The intensity patterns for the 273.9 and 252.4 nm resonance Raman spectra are similar.We expect that the intensities of the four most intense modes (ν7,ν11,ν19,ν14)in the 273.9 nm resonance Raman spectrum come from the B-band absorption since the oscillator strength(f=0.2985)of the B-band absorption is 10 times that of the A-band absorption and since the resonance Raman intensities are proportion to f2. However,the major di ff erence between the 273.9 and 252.7 nm resonance Raman spectra are noted owing to the signi fi cant resonance enhancement of the ν20,ν21and ν22modes in the 273.9 nm spectrum.Since the 273.9 nm excitation wavelength falls in energy into the overlap region between the S2(A′)and S1(A′′)states,we expect that the corresponding resonance Raman spectra may contain important information on the statecoupling or curve-crossing among the higher-lying excited state.
C.Excited state structures and reaction dynamics
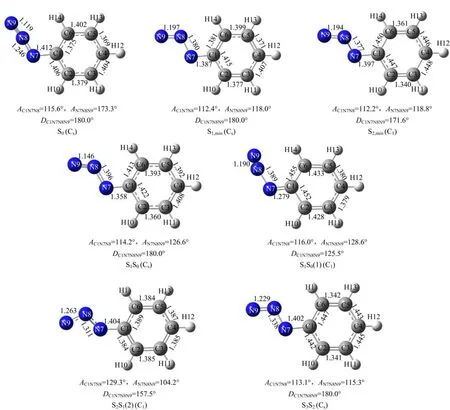
To explore the curve-crossings in the excited state decay processes and to understand the Franck-Condon region structural dynamics burried beneath the A-band resonance Raman intensity pattern,we have carried outthe CASSCF calculations.Table III lists the calculated vertical excitation energies and geometric structural parameters of the lower-lying singlet excited states and the corresponding curve-crossing points.Figure 5 displays the schematic diagram of the geometric structures for the above excited states and curve-crossing points.

TABLE II B3LYP/6-31+G(d)computed and experimentally observed vibrational frequencies.

FIG.3 Overview of the 273.9,252.7,245.9,228.7,223.1 and 208.8 nm resonance Raman spectra of phenyl azide in(a) acetonitrile,(b)methanol,and(c)cyclohexane.Asterisk(*)labels the solvent subtraction artifacts.

FIG.4 Enlarged view of the 273.9,252.7,228.7,and 208.8 nm resonance Raman spectra of PhN3in methanol.Asterisk(*) labels the solvent subtraction artifacts.Pound(#)marks the residual uncertain laser line.
The lowest light absorbing state is the S2(ππ∗,A′) state according to both CASSCF and TD-B3LYP calculations.It was previously known that simple phenyl, biphenylyl,and naphthyl azides did not have any observable fl uorescence,which was explainable by their large quantum yields for extrusion of molecular nitro-gen[7].Herein,the existence of the S2,minstructure is detected for the fi rst time by the experimentally observed fl uorescence spectra that accompany the 266.0, 273.9,and 282.4 nm resonance Raman scattering.This fl uorescence spectrum(centered at λmax=294 nm or 97 kcal/mol relative to S0)red-shifts about 14 nm relative to the A-band absorption in cyclohexane,and is close to the transition energy(112 kcal/mol)of S2,minstructure predicted by CASSCF calculation.The fl uorescence at 294 nm is surely not originated from S1,min→S0transition since it is estimated at~500 nm on the basis of our CASSCF calculations listed in Table III.The 294 nm concomitant fl uorescence spectra observed in our resonance Raman experiments consists apparently with the ultrafast transient absorption spectroscopic observation that the S2state of azides that have lifetimes of hundreds of femtoseconds[8].Therefore the 294 nm fl uorescence spectrum of phenyl azide, assigned as the S2,min→S0transition,serves as the e fficient radiative decay channel of PhN3in the populated S2state.The structureless band shape of the S2,min→S0 fl uorescence spectrum suggests that the band broadening is mostly due to the pure electronic dephasing or the very short lifetime of the S2state,but unlikely due to the solvent-induced inhomogeneous broadening.

TABLE III Vertical excitation energy∆E(in kcal/mol)and geometric structural parameters of the singlet excited states and conical intersection points with the bond length R in˚A,the bond angle A in(◦),and D of C−N=N=N in(◦).
The transition energies of the curve-crossing points S2S1(1)and S2S1(2)are determined to be 116 and 87.5 kcal/mol at CASSCF(8,7)level of theory.The transition energy of S2S1(1)is higher than S2,min(112 kcal/mol)by 4 kcal/mol,while that of S2S1(2)is higher than S1,min(57.7 kcal/mol)by 30 kcal/mol.This suggests that when PhN3is initially populated in the S2potential energy surface,it can cross to the dark S1state through both S2S1(1)and S2S1(2),with S2S1(1) being more close to the Franck-Condon region according to the geometry structures.
The lowest electronic state is the dark S1(πHπL∗,A′′). As Table I shows,the lowest unoccupied anti-bonding πL∗orbital is formed from the Py-Py conjugation interaction of the N=N=N chromophore.Thus one would expect that the-N7=N8=N9 chromophore undergoes large N7=N8 or N8=N9 bond length lengthening upon(0.69)transition.As expected,CASSCF calculations reveal that the N7−N8 and N8−N9 bond lengths of the S1,minstructure are 1.380 and 1.197˚A,longer than the corresponding 1.246 and 1.119˚A for S0by 0.134 and 0.078˚A respectively.This indicates that the N7−N8 and N8−N9 bonds become weakly bonded in S1,min.Moreover,the transition energy for S1,min is 57.7 kcal/mol,much lower than that for S2S1(2). Thus upon internal-converting to the dark S1state, ~30 kcal/mol available energy may make the initially populated S1state of PhN3highly vibrational excited so that the predicted N7−N8 bond dissociation may take place[7].
TheFranck-Condonregionstructuraldynamics of PhN3in the S2(A′)and S3(A′)state potential energy surfaces(A-,and B-band absorptions) is mostly along the vibration coordinates of ν11, ν7,ν9,ν14,ν19on the basis of the resonance Raman spectra in Fig.3 and Fig.4.The most intense fundamental bands andovertone progressions appearintheN8N7(21%)+C2C3(12%)+N7C1(10%) stretch+H10C2C1(12%)in plane bend mode ν11,the C6C5(27%)+C2C3(15%)+C1C2(15%)+C4C5(10%)
stretch mode ν7,2ν11and 2ν7.This suggests that the predominant structural dynamics occurs along ν11and ν7.The appearance of the intense ν7mode consists qualitatively with the major(−0.32 or 0.52) electronic transition for the S3or S2state,which changes the C2−C3,C6−C5,C4−C5 and C1−C2 bond orders,while the appearance of the ν11mode can partially be explained by the(0.58 or 0.34) transition since it weakens N8N7 bond but enhances N7C1 and C2C3 bonds.

FIG.5 Schematic diagram of the geometry structure of the lower-lying excited states and the corresponding curve-crossing points predicted at the CASSCF(8,7)level of theory.
As mentioned above,the major di ff erence between the A-and B-band resonance Raman spectra is that the A-band spectrum displays noticeable intensity increase in the fundamentals of the C3C4C5 in plane bend(32%)+N7C1(18%)stretch mode ν20, the N9N8N7(33%)+N8N7C1(29%)+C3C4C5(14%)in planebendmodeν21,andtheC2C3C4(40%)+ C6C5C4(23%)+C1C2C3(11%)in plane bend mode ν22. Their intensity enhancements are surely not due to the B-band absorption since they are much weaker in the 252.4 nm resonance Raman spectra.Thus these three Franck-Condon active modes are characteristic to the 273.9 nm resonance Raman spectrum.Keep in mind that the oscillator strength for the A-band absorption is only 10%that of the B-band absorption,we expect that PhN3undergoes substantial structural changes along the ν20,ν21,and ν22vibrational reaction coordinates in the S2potential energy surface in the Franck-Condon region.
Quantitative correlation of the A-band short-time structural dynamics of PhN3to the CASSCF calculated S2S1or S2,minstructure requires both the well separated A-,and B-band absorptions and the quantitative simulation of the A-band resonance Raman spectra using time-dependent wave-packet so as to obtain the fi nal short-time structural dynamics in terms of the easy-tovisualize internal coordinates.However the much intense B-band absorption retards our e ff ort to extract at the quantitative or semi-quantitative level the A-band short-time dynamics in terms of the easy-to-visualize internal coordinates owing to the severe pre-resonanceresonance interference of the B-band absorption.

FIG.6 3D rigid potential energy surface scans of the S1and S2states of PhN3with the RC1−N7and RN7−N8and the AC1−N7−N8being varied.At TD-B3LYP level of theory,the scan initiates at the Franck-Condon point of the ground state geometry(a),and then with the AC1−N7−N8being set to 124.4◦(b)and 119.4◦(c).In situation C,the S2potential energy becomes predissociative when the RN7−N8is longer than about 1.45˚A.The black arrow serves as a reference point where the energy fl uctuation for the S2potential surface is small at each scan.The blue arrow shows the curve-crossing point for each scan.
Qualitatively,the signi fi cant structural dynamics along the ν20,ν21,and ν22vibrational coordinates suggests that the major part of the initial wave-packets is along the S2(A′)potential energy surface since no vibrational mode in A′is noticeably observed in the 273.9 nm resonance spectrum,and this can correlate either to the S2,min or S2S1structure.As the fi rst step towards understanding the roles of the ν20,ν21, and ν22modes in the photodissociation dynamics of PhN3upon A-band absorption,we have carried out the 3D rigid potential energy surface scans for the S1and S2states using TD-B3LYP level of theory.For each scan,three variables are chosen among the internal coordinates of the RC1−N7,RN7−N8,and RN8−N9bonds and the AC1−N7−N8and AN7−N8−N9bond angles. Figure 6 depicts the potential energy surfaces scans using variables of RC1−N7,RN7−N8,and AC1−N7−N8. The result indicates that at AC1−N7−N8≈124◦the S2state internal-converts to the S1state,which is somewhat larger than AC1−N7−N8≈129◦for S2S1predicted by the CASSCF(8,7)calculation.Further decrease of the C1−N7−N8 bond angle makes PhN3in the S2state become dissociative along the N7−N8 bond coordinate. The potential energy surfaces scans using variables of other combinations without including the C1−N7−N8 bond angle were also carried out,and the results indicates that there is no curve-crossing taking place at each scan.Apparently the C1−N7−N8 bond angle motion controls the curve-crossing between S2and S1state and the fi nal nitrene formation through the N7−N8 bond dissociation of PhN3.
Further examination of Fig.5 shows that the most important structural di ff erences between S2S1(2)and S0for the CN7N8N9 moiety are the signi fi cant changes of the AC1−N7−N8(129.3◦)and AN7−N8−N9(104.2◦)bond angles for S2S1relative to those(115.6◦and 173.3◦respectively)for S0,which is contrast to the minor change of the AC1−N7−N8(112.2◦)for S2,minrelative to that (115.6◦)for S0.Thus the appearance of the mode ν21in the 273.9 nm resonance Raman spectrum but absent in the 252.4 nm resonance Raman spectrum suggests that the initial S2state structural dynamics revealed by the 273.9 nm resonance Raman spectrum is likely towards the S2S1(2)structure but does not correlate to the S2,minstructure,which indicates that the S2S1(2) curve-crossing takes place somewhere not far away from the Franck-Condon region.
IV.CONCLUSION
In this work,the excited state structures and decay dynamics of phenyl azide(PhN3)after excitation to the light absorbing S2(A′),S3(A′),and S6(A′)states are determined according to the CASSCF calculations and the resonance Raman spectroscopic measurements. The vibrational FT-Raman and FT-IR spectra are assigned on the basis of experimental spectroscopic measurements,the DFT calculations,and the normal mode analysis.At CASSCF(8,7)/6-31G(d)level of theory, the low-lying excited state structures of S1,min,S2,min, S1S0,S2S1(1),S2S1(2),S3S2are predicted.The 294 nm concomitant fl uorescence observed in our resonance Raman experiments is assigned as the S2,min→S0transition.Two decay channels initiated from the FCregion of the S2state are determined.One is the S2,FC→S2,min→S0radiative decay channel that makes PhN3return directly to the ground state.The other is the S2,FC→S2S1→S1nonradiative decay channel to form the dark S1state,where the further N7−N8 dissociation takes place to form phenyl nitrene and N2.
V.ACKNOWLEDGMENTS
This work is supported by the National Natural Science Foundation of China(No.21473163,No.21033002, No.21202032)and the National Basic Research Program of China(No.2013CB834604).
[1]W.Lwowski Ed.,Nitrenes,Wiley:New York,(1970).
[2]D.S.Breslow,Azides and Nitrenes,E.F.V.Scriven, ed.,Orlando,FL:Academic Press,491(1984).
[3]H.Bayley,Photogenerated Reagents in Biochemistry and Molecular Biology,New York:Elsevier Press, (1983).
[4]S.A.Fleming,Tetrahedron,51,12479(1995).
[5]M.F.Budyka,N.V.Biktimirova,T.N.Gavrishova, and O.D.Russ.Laukhina,J.Phys.Chem.79,1666 (2005).
[6]R.F.Jenkins,W.H.Waddell,and H.W.Richter,J. Am.Chem.Soc.109,1583(1987).
[7]M.W.Geiger,M.M.Elliot,V.D.Karacostas,T.J. Moricone,J.B.Salmon,V.L.Sideli,and M.A.St. Onge,Photochem.Photobiol.40,545(1984).
[8]G.Burdzinski,J.C.Hackett,J.Wang,T.L.Gustafson, C.M.Hadad,and M.S.Platz,J.Am.Chem.Soc.128, 13402(2006)
[9]V.Voskresenska,R.M.Wilson,M.Panov,A.N. Tarnovsky,J.A.Krause,S.Vyas,A.H.Winter,and C.M.Hadad,J.Am.Chem.Soc.131,11535(2009)
[10]X.Zheng,Y.L.Li,and D.L.Phillips,J.Phys.Chem. A.108,8032(2004).
[11]A.B.Myers,in Laser Techniques in Chemistry,A.B. Myers and T.R.Rizzo Eds.,New York:Wiley,325 (1995).
[12]A.B.Myers and R.A.Mathies,in Biological Applications of Raman Spectroscopy,T.G.Spiro Ed.,New York:Wiley,2(1987).
[13]R.Ouillon and S.Adam,J.Raman Spectrosc.12,281 (1982).
[14]F.J.Purcell,R.Kaminski,and E.Russavage,Appl. Spectrosc.34,323(1980).
[15]J.R.Scherer and S.Kint,Appl.Optics.9,1615(1970). [16]A.B.Myers,B.Li,and X.Ci,J.Chem.Phys.89,1876 (1988).
[17]M.J.Frisch,G.W.Trucks,H.B.Schlegel,G.E.Scuseria,M.A.Robb,J.R.Cheeseman,J.A.Montgomery Jr.,T.Vreven,K.N.Kudin,J.C.Burant,J.M.Millam,S.S.Iyengar,J.Tomasi,V.Barone,B.Mennucci, M.Cossi,G.Scalmani,N.Rega,G.A.Petersson,H. Nakatsuji,M.Hada,M.Ehara,K.Toyota,R.Fukuda, J.Hasegawa,M.Ishida,T.Nakajima,Y.Honda,O. Kitao,H.Nakai,M.Klene,X.Li,J.E.Knox,H.P. Hratchian,J.B.Cross,C.Adamo,J.Jaramillo,R. Gomperts,R.E.Stratmann,O.Yazyev,A.J.Austin, R.Cammi,C.Pomelli,J.W.Ochterski,P.Y.Ayala, K.Morokuma,G.A.Voth,P.Salvador,J.J.Dannenberg,V.G.Zakrzewski,S.Dapprich,A.D.Daniels,M. C.Strain,¨O.Farkas,D.K.Malick,A.D.Rabuck,K. Raghavachari,J.B.Foresman,J.V.Ortiz,Q.Cui,A. G.Baboul,S.Cli ff ord,J.Cioslowski,B.B.Stefanov,G. Lui,A.Liashenko,P.Piskorz,I.Komaromi,R.L.Martin,D.J.Fox,T.Keith,M.A.Al-Laham,C.Y.Peng, A.Nanayakkara,M.Challacombe,P.M.W.Gill,B. Johnson,W.Chen,M.W.Wong,C.Gonzalez,and J. A.Pople,Gaussian 03,Revision B.02,Pittsburgh,PA: Gaussian Inc.,(2003).
[18]M.H.Jamr´oz,Vibrational Energy Distribution Analysis:VEDA 4 Program,Warsaw,(2004).
 CHINESE JOURNAL OF CHEMICAL PHYSICS2016年1期
- CHINESE JOURNAL OF CHEMICAL PHYSICS的其它文章
- ARTICLE E ffi cient Separation of Ar and Kr from Environmental Samples for Trace Radioactive Noble Gas Detection†
- REVIEW Polarization Dependent Time-Resolved Infrared Spectroscopy and Its Applications†
- ARTICLE Reactions of Group V Metal Atoms with Hydrogen Sul fi de:Argon Matrix Infrared Spectra and Theoretical Calculations†
- ARTICLE Structural and Infrared Spectroscopic Study on Solvation of Acetylene by Protonated Water Molecules†
- ARTICLE Excited-State Proton Transfer and Decay in Hydrogen-Bonded Oxazole System:MS-CASPT2//CASSCF Study†
- ARTICLE Infrared Photodisssociation Spectroscopy of Boron Carbonyl Cation Complexes†
