陕南农村冬季PM2.5主要化学组分特征
朱崇抒,曹军骥,刘随心,屈 垚,张 婷
(1.中国科学院地球环境研究所 中国科学院气溶胶化学与物理重点实验室,西安710061;2.中国科学院地球环境研究所 黄土与第四纪地质国家重点实验室,西安710061)
陕南农村冬季PM2.5主要化学组分特征
朱崇抒1,2,曹军骥1,2,刘随心1,2,屈 垚1,2,张 婷1,2
(1.中国科学院地球环境研究所 中国科学院气溶胶化学与物理重点实验室,西安710061;2.中国科学院地球环境研究所 黄土与第四纪地质国家重点实验室,西安710061)
通过对陕南农村冬季PM2.5采样分析,获得PM2.5质量浓度及主要化学组分特征。PM2.5平均质量浓度为89.5 ± 42.0 μg · m-3,超过国家二级标准。观测期间PM2.5中OC、EC浓度平均值分别为16.0 ± 6.9 μg · m-3和5.7 ± 3.2 μg · m-3,OC/EC平均比值为3.0 ± 0.4。主要水溶性离子组分为、和。粒子数浓度与表面积浓度峰值主要集中在0.5 μm以下粒径段。PAHs、BeP和BaP平均质量浓度分别为48.9 ± 10.9 ng · m-3、3.0 ± 0.9 ng · m-3和1.2 ± 0.7 ng · m-3,PAHs污染较严重,强致癌物BaP浓度超过国家环境空气质量标准年平均浓度限值。当地农村以石煤为主的能源结构及采用的燃烧方式是导致污染的重要因素。
PM2.5;化学组分;农村;陕南
PM2.5是指悬浮在大气中空气动力学等效直径小于或等于2.5 μm的颗粒物(曹军骥,2014)。PM2.5自然源主要为火山喷发、海浪泡沫、沙尘暴、地面扬尘、生物质燃烧和植物排放等,人为源主要是工业及人类生产生活排放,包括化石燃料使用、生物质燃烧和工业生产过程排放等。PM2.5的主要化学组分包括含碳物质(有机碳、元素碳)、硫酸盐、硝酸盐、铵盐、地质尘等(曹军骥,2014)。PM2.5组分对环境质量、人体健康和气候变化均有重要的影响(Ye et al,2003;Zhang etal,2007;Zhang et al,2009;Cao et al,2012;高伟和毛晓琴,2016;李国辉和冯添,2016)。
陕南地处秦岭南部,属亚热带温湿气候, 年平均气温13 — 15℃,年平均降水量为1000 —1500 mm,年平均蒸发量与降水量基本相同。石煤在中国分布广泛,陕南则是石煤在陕西的唯一“聚集区”。该区境内石煤具有埋藏浅、蕴藏丰富、价格廉、易开采等特点,随着当地封山育林政策的实施,石煤是当地居民冬季取暖及烹饪的主要燃料。但石煤是一种含碳少、发热值低的劣质煤,其在燃烧过程中的排放易导致当地空气污染,危害居民健康。以前有关大气污染研究主要集中在城市区域及华北部分农村区域(Jacobson et al,2000;Cao et al,2004,2005;Shen et al,2007,2009),在该石煤使用区未见相关研究报道,故该工作对了解陕南农村大气PM2.5主要化学组分的污染特征及有针对性的开展区域大气污染治理有一定意义。
1 方法
1.1 采样地点与时间
采样点位于陕西省紫阳县东北部蒿坪镇,距县城20 km,周边无大的工业企业排放。采样点设在蒿坪镇农村一栋房顶,距地面大约10 m,冬季周围农户多以当地出产的石煤作为烹饪和取暖能源,能很好地代表该区域大气环境状况。采样时间为2015年1月18日至2015年2月3日。
1.2 样品采集与分析
采用微流量颗粒物采样仪(Mini-volume samplers,Airmetrics,USA)收集大气PM2.5样品,设定流速为5 L · min-1,每个样品连续采集24 h,共收集到15个PM2.5石英滤膜样品。通过微电子天平(MettleM3,Switzerland,灵敏度为1 μg)称重计算获得PM2.5质量浓度。采样期间采用一台OPS(Optical Particle Sizer,TSI公司3330型光学粒径谱仪,流速为1 L · min-1)观测不同粒径颗粒物数浓度值。采用DRI Model 2001热光碳分析仪(热光反射法)对PM2.5样品进行碳组分分析,通过IMPROVE-A(Interagency Monitoring of Protected Visual Environment-A)分析协议获得各碳组分含量(Chow et al,2007)。同时计算出OC和EC的8个组分含量(OC1、OC2、OC3、OC4、EC1、EC2、EC3、OP),IMPROVE-A协议将OC定义为OC1+OC2+OC3+OC4+OP,将EC定义为ECl+EC2+EC3 - OP,已有研究对碳分析过程质控进行报道(Chow et al,2011)。采用Dionex-600型离子色谱仪进行无机水溶性离子组分检测,用Chromeleon软件进行谱图分析,得到水溶性离子组分的质量浓度。采用进样口直接热解析-气相色谱/质谱法((Injection port thermal desorption)TDGC/MS)分析颗粒物中的多环芳烃浓度,该方法不需要任何外置的热解析装置,通过气相色谱自带的升温程序,在GC进样口将样品中的待测有机物热解析出来,使待测有机物浓缩于色谱柱固定相的柱头,目前TD-GC/MS方法可定量超过上百种有机物。
2 结果与讨论
2.1 PM2.5质量浓度、碳组分特征
研究期间陕南农村大气PM2.5平均质量浓度为89.5 ± 42.0 μg · m-3,变化范围是46.0 —188.0 μg · m-3,PM2.5日均浓度超过国家二级标准,表明研究区域冬季PM2.5污染较严重。在冬季因采暖燃煤量明显增高,导致空气中颗粒物浓度上升,加上冬季大气比较稳定容易形成逆温层,导致颗粒物不易扩散,使得颗粒累积量大,污染较严重(Cao et al,2005;Zhu et al,2012)。
观测期间OC浓度的平均值为16.0 ± 6.9 μg · m-3,其变化范围为8.1—33.3 μg · m-3,最高值是最低值的4倍。EC浓度平均值为5.7 ± 3.2 μg · m-3,其变化范围为2.4 — 13.7 μg · m-3,最高值是最低值的6倍。从图1中可以看出,PM2.5、OC和EC浓度变化序列表现出较好的同步趋势。
观测期间OC/EC比值的平均值为3.0 ± 0.4,其变化范围为2.4 — 3.5,OC/EC比值变化比较平缓(图1)。与前人的研究结果相比,OC/EC比值较低,说明观测点一次排放贡献较大。实地调查表明,与燃煤源相比,当地生物质燃烧和机动车尾气排放贡献较小。浓度较低的样品9、10和12为雨雪天气所采,表明降水对PM2.5、OC和EC的影响显著,样品10达到观测期内浓度最低值。由于EC比较稳定,在常温条件下,一般不发生大气化学反应,所以常被用作污染源一次排放的示踪物。而OC包括了直接排放的一次有机碳和由前体物在大气中经过复杂的化学反应(气-粒转化)而形成的二次有机碳。通过研究OC和EC浓度比值可一定程度反映出碳气溶胶的排放和转化特征(Turpin and Lim,2001)。

图1 陕南农村PM2.5、OC和EC质量浓度及OC/EC比值Fig.1 The concentrations of PM2.5, OC, EC, and the ratios of OC/EC in the rural of Shaannan
利用OC、EC的相关性可在一定程度上对大气碳气溶胶的来源进行定性分析。图2中PM2.5的OC与EC相关关系很好,R= 0.98,这表明OC、EC的来源相对单一,因当地封山育林,生物质燃烧很少,碳气溶胶可能主要为当地冬季石煤燃烧贡献。

图2 PM2.5的OC和EC相关关系Fig.2 Correlations of OC and EC for PM2.5
2.2 PAHs污染特征
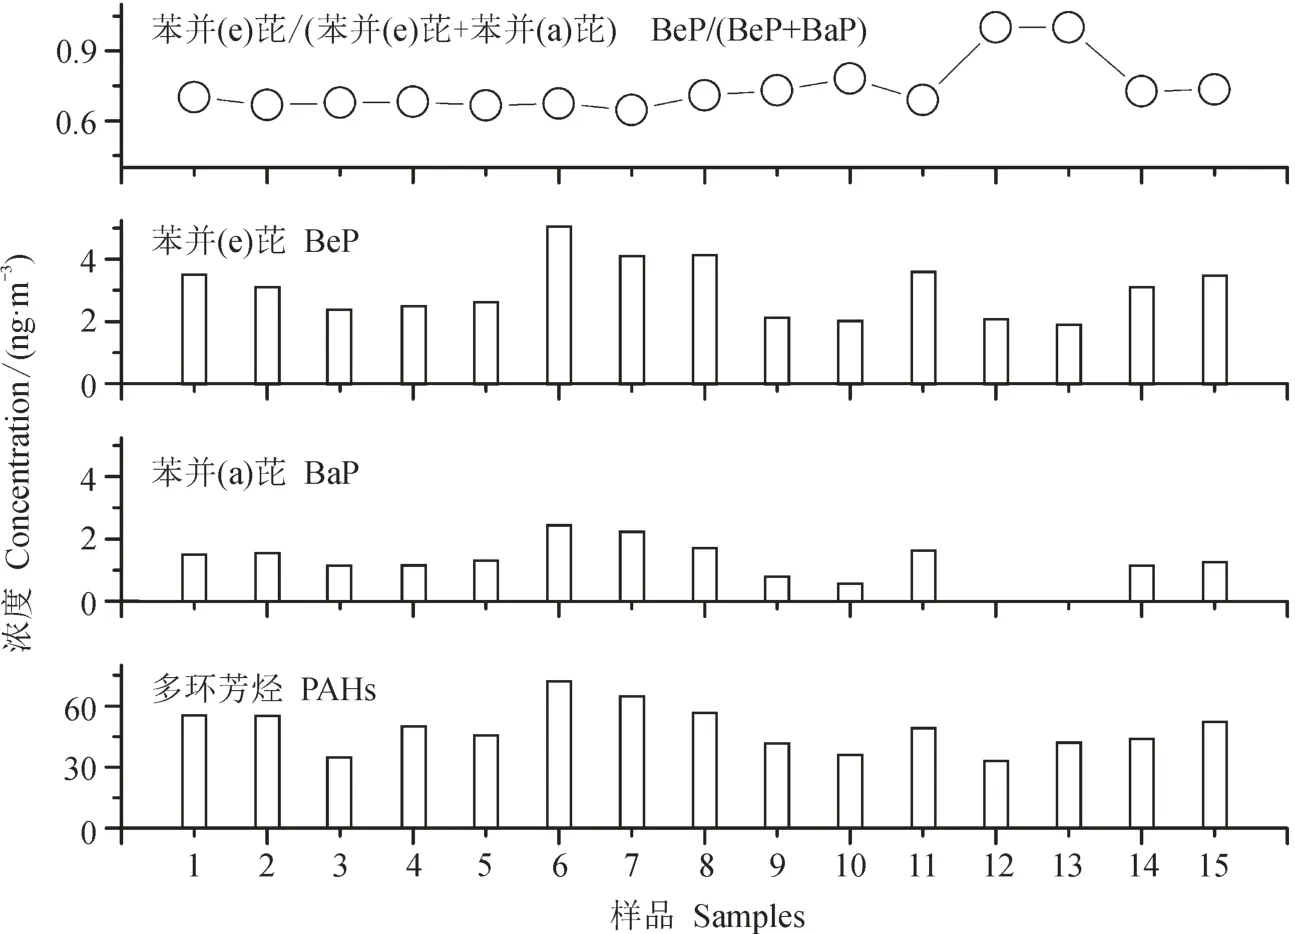
在本次研究期间PAHs、BeP和BaP平均质量浓度分别为48.9 ± 10.9 ng · m-3、3.0 ± 0.9 ng · m-3和1.2 ± 0.7 ng · m-3。BeP和BaP浓度水平都超过上海市研究结果,其浓度值分别为1.26 ng · m-3和0.45 ng · m-3(Cao et al,2013)。PAHs变化范围是33.1—72.1 ng · m-3,BeP变化范围为1.9 — 5.0 ng · m-3,BaP变化范围为0 — 2.4 ng · m-3,观测期间BeP/(BeP+BaP)比值较高,达到0.74 ± 0.11(图3)。
BaP是PAHs各单体中最具毒性和最常用以评价PAHs毒性总量的单体,BaP和二苯[ah]蒽(DahA)都是强致癌物。观测期间非降雪天BaP平均质量浓度为1.6 ng · m-3,BaP的环境空气质量标准(GB 3095—2012)为1.0 ng · m-3(年平均值),结果表明该农村站点BaP污染较严重,BaP浓度远超过环境空气质量标准,此外,该农村观测点BeP的含量占PAHs比重较大。
2.3 质量浓度、数浓度和表面积浓度粒径分布
各粒径段质量浓度百分比大体呈现中间低两边高的情况,其中0.72 — 0.89 μm、1.12 — 1.39 μm这两个粒径段质量浓度百分比最小。从图4可以看出粒子数浓度与表面积浓度主要集中在0.3 —0.58 μm粒径段。表面积浓度、质量浓度、数量浓度在粒径段0.9 — 1.1 μm上有一个峰,质量浓度最明显,表面积浓度次之,数量浓度不明显。质量浓度在粒径0.4 — 0.5 μm上有个峰,且为0.3—10 μm中最高点,而该粒径段正是硫酸盐和硝酸盐等成分聚集的粒径范围,与冬季颗粒物受到燃煤排放影响较大的结果一致(Seinfeld et al,1998)。同时质量浓度和表面积浓度在粒径段1.7 — 2.1 μm上也都有峰。数浓度和表面积浓度趋势较统一,由高至低到平缓,而质量浓度变化较为显著。

图3 PAHs、BaP和BeP质量浓度及比值Fig.3 The concentrations of PAHs, BaP, BeP and the ratio of BeP/(BeP+BaP)

图4 安康农村各粒径颗粒物质量浓度(dM)、个数浓度(dN)和表面积浓度(dS)百分比Fig.4 Mass concentrations (dM), particle numbers (dN), and surface concentrations (dS) during the sampling period in the rural of Ankang
2.4 水溶性无机离子浓度变化
在PM2.5中,总水溶性离子组分占PM2.5的份额平均为48%,范围是29% — 70%。阴离子中各个离子占PM2.5的份额依次为;阳离子为(图5)。研究期间PM2.5中水溶性离子组分、和分别占20.1%、10.4%和7.3%,对PM2.5中水溶性组分的贡献相对较大。、和的平均质量浓度分别为17.8 ± 9.1 μg · m-3、9.8 ± 7.0 μg · m-3和6.7 ± 4.0 μg · m-3。浓度与北京、青岛和兰州相近,高于香港和上海等国内城市(Wang et al,2005,2006;Hu et a1,2002)的观测值;浓度与北京、上海接近,高于香港、兰州和重庆等城市的观测值;浓度与上海、青岛接近,低于北京浓度水平(Wang et a1,2002;Ho et a1,2003)。表明该农村区域水溶性离子浓度并不比城市区域低。
水溶性离子组分中,Cl-、K+和Ca2+的平均质量浓度分别为1.5 ± 0.7 μg · m-3、1.2 ± 0.6 μg · m-3和1.8 ± 0.3 μg · m-3,而F-、和Mg2+在PM2.5中含量很少,平均质量浓度都小于1 μg · m-3。K+通常作为生物质燃烧来源的一个标志物,本研究获得的K+浓度远低于关中平原农村K+浓度水平(Zhu et al,2012),表明当地生物质燃烧源对PM2.5贡献较关中平原低。图中可以看出,降水对PM2.5中水溶性离子影响较大,降水期间PM2.5中水溶性离子平均浓度与非降水期间的比值为0.77。
一般认为,Ca2+主要来自于地表扬尘源(Nesbitt et al,1980),在观测点Ca2+的质量浓度与其他主要水溶性离子变化趋势类似,可能是受采样点附近地表扬尘和石煤燃烧排放影响。一般意义上,Na+和Cl-代表海洋源的气溶胶,但是采样点位居内陆,远离海洋,所以Na+和Cl-可能主要来源于局地土壤盐类及人为活动影响。本次研究发现陕南部分农村的大气污染状况不容乐观,故不能只把大气污染治理工作重心放在城市区域,农村的大气污染也应根据当地污染源情况采取有效治理措施,给予更多关注。
3 结论与展望
本文通过对陕南农村PM2.5污染特征进行分析,初步获得该区域冬季PM2.5质量浓度及其主要化学组分浓度特征;该农村站点PM2.5及BaP污染较重,浓度远超过环境空气质量标准,且BeP的含量占PAHs比重较大;鉴于该区域PM2.5及PAHs组分污染状况,应采取措施改善当地能源结构,尤其是对当地居民石煤使用方式进行优化。
曹军骥. 2014. PM2.5与环境[M]. 北京: 科学出版社: 1–17. [Cao J J. 2014. PM2.5and environment [M]. Beijing: Science Press: 1–17. ]
高 伟, 毛晓琴. 2016. 上海春季大气PM1分布特征[J].地球环境学报, 7(4): 405–411. [Gao W, Mao X Q. 2016. Distribution characteristics of atmospheric PM1in spring at Shanghai [J].Journal of Earth Environment, 7(4): 405–411.]
李国辉, 冯 添. 2016. 关中地区重污染期间PM2.5输送与来源的模拟研究[J].地球环境学报, 7(4): 412–424. [Li G H, Feng T. 2016. Simulating the transport and source of PM2.5during hazy days in the Guanzhong Basin, China [J].Journal of Earth Environment, 7(4): 412–424.]
Cao J J, Lee S C, Ho K F, et al. 2004. Spatial and seasonal variations of atmospheric organic carbon and elemental carbon in Pearl River Delta Region, China [J].Atmospheric Environment, 38: 4447–4456.
Cao J J, Wu F, Chow J C, et al. 2005. Characterization and source apportionment of atmospheric organic and elemental carbon during fall and winter of 2003 in Xi’an, China [J].Atmospheric Chemistry and Physics, 5: 3127–3137.
Cao J J, Xu H M, Xu Q, et al. 2012. Fine particulate matter constituents and cardiopulmonary mortality in a heavily polluted Chinese city [J].Environmental Health Perspectives, 120: 373–378.
Cao J J, Zhu C S, Tie X X, et al. 2013. Characteristics and sources of carbonaceous aerosols from Shanghai, China [J].Atmospheric Chemistry and Physics, 13: 803–817.
Chow J C, Yu J Z, Watson J G, et al. 2007. The application of thermal methods for determining chemical composition of carbonaceous aerosols: a review [J].Journal of Environmental Science and Health Part A, 42: 1521–1541.
Chow J C, Watson J G, Robles J, et al. 2011. Quality assurance and quality control for thermal/optical analysis of aerosol samples for organic and elemental carbon [J].Analytical and Bioanalytical Chemistry, 401: 3141–3152.
Ho K F, Lee S C, Chak K C, et a1. 2003. Characterization of chemical species in PM2.5and PM10aerosols in Hong Kong [J].Atmospheric Environment, 37: 31–39.
Hu M, He L Y, Zhang Y H, et al. 2002. Seasonal variation of ionic species in fine particles at Qingdao, China [J].Atmospheric Environment, 36: 5853–5859.
Jacobson M C, Hansson H C, Noone K J, et al. 2000. Organic atmospheric aerosols: review and state of the science [J].Reviews of Geophysics, 38: 267–294.
Nesbitt H W, Markovics G, Price R C, et al. 1980. Chemical processes affecting alkalis and alkaline earths during continental weathering [J].Geochimica et Cosmochimica Acta, 44: 1659–1666.
Russell A G, McRae G J, Cass G R. 1983. Mathematical modeling of the formation and transport of ammonium nitrate aerosol [J].Atmospheric Environment, 15: 2507–2518.
Seinfeld J H, Pandis S N, Noone K. 1998. Atmospheric chemistry and physics: from air pollution to climate change [J].Physics Today, 51(10): 79.
Shen Z X, Cao J J, Arimoto R, et al. 2007. Chemical composition and source characterization of spring aerosol over Horqin sand land in northeastern China [J].Journal of Geophysical Research, 112, D14315,doi:10.1029/2006JD007991.
Shen Z X, Cao J J, Tong Z, et al. 2009. Chemical characteristics of submicron particles in winter in Xi’an [J].Aerosol and Air Quality Research, 9: 80-93.
Turpin B J, Lim H J. 2001. Species contributions to PM2.5mass concentrations: revisiting common assumptions for estimating organic mass [J].Aerosol Science and Technology, 35: 602–610.
Wang G H, Huang L M, Gao S X, et al. 2002. Characterization of water-soluble species of PM10and PM2.5aerosols in urban area in Nanjing, China [J].Atmospheric Environment, 36(8): 1299–1307.
Wang Y, Zhuang G S, Tang A, et al. 2005. The ion chemistry and the source of PM2.5aerosol in Beijing [J].Atmospheric Environment, 39: 3771–3784.
Wang Y, Zhuang G S, Zhang X Y, et al. 2006. The ion chemistry, seasonal cycle, and sources of PM2.5and TSP aerosol in Shanghai [J].Atmospheric Environment, 40: 2935–2952.
Ye B M, Ji X L, Yang H Z, et al. 2003. Concentration and chemical composition of PM2.5in Shanghai for a 1-year period [J].Atmospheric Environment, 37: 499–510.
Zhang M G, Han Z W, Zhu LY. 2007. Simulation of atmospheric aerosols in East Asia using modeling system RAMSCMAQ: model evaluation [J].China Particuology, 5: 321–327.
Zhang R J, Ho K F, Cao J J, et al. 2009. Organic carbon and elemental carbon associated with PM10in Beijing during spring time [J].Journal of Hazardous Materials, 172: 970–977.
Zhu C S, Cao J J, Shen Z X, et al. 2012. Indoor and outdoor chemical components of PM2.5in the rural areas of Northwestern China [J].Aerosol and Air Quality Research, 12: 1157–1165.
The characteristics of chemical components for rural PM2.5in winter over Shaannan
ZHU Chongshu1,2, CAO Junji1,2, LIU Suixin1,2, QU Yao1,2, ZHANG Ting1,2
(1. Key Laboratory of Aerosol Chemistry & Physics, Institute of Earth Environment, Chinese Academy of Sciences, Xi’an 710061, China; 2. State Key Laboratory of Loess and Quaternary Geology, Institute of Earth Environment, Chinese Academy of Sciences, Xi’an 710061, China)
Background, aim, and scopeThe usage of biomass and coal for cooking and heating is common in rural area in China. In reality, the emission largely contributes to the chemical components of particulates. The study here presented the levels of rural carbonaceous fractions, ions and PAHs over Shaannan.Materials and methodsThe observation campaign was conducted in a rural site at Shaannan. Samples were collected by using mini-volume samplers (Airmetrics, USA) operating with a fl ow rate of 5 L · min-1for 24 hours. All samples were collected on 47 mm Whatman quartz micro fi bre fi lters (QM/A). The filters were pre-heated before sampling at 800℃ for 3 hours. After collection, the filters were stored in a refrigerator before chemical analysis. Before and after field sampling, quartz filters were equilibrated for 24 hours in the box at a constant temperature (20℃ to 23℃) and relative humidity (35% to 45%). The PM2.5mass was determined by weighing the fi lters before and after sampling on an electronic microbalance (1 μg sensitivity) (Sartorius, MC5, Germany). All the fi lters were analyzed for carbon fractions using a DRI Model 2001 Thermal/Optical Carbon Analyzer (Atmoslytic Inc., Calabasas, CA, USA). Carbon fractions were analyzed following the Interagency Monitoring of Protected Visual Environments (IMPROVE-A) thermal/optical reflectance (TOR) protocol. The method produced data for four OC fractions (OC1, OC2, OC3, and OC4 in a helium atmosphere at 140℃, 280℃, 480℃, and580°C, respectively), a pyrolyzed carbon fraction (OP, determined when re fl ected laser light attained its original intensity after oxygen was added to the combustion atmosphere), and three EC fractions (EC1, EC2, and EC3 in a 2% oxygen/98% helium atmosphere at 580℃, 740℃, and 840℃, respectively). The IMPROVE protocol defined OC as OC1+OC2+OC3+OC4+OP and EC as EC1+EC2+EC3-OP. The analyzer was calibrated with known quantities of CH4each day. Replicate analyses were performed once every ten samples. The blank fi lters were also analyzed for quality control and the sample results were corrected by the average of the blank concentrations, which were 0.96 μg · m-3and 0.23 μg · m-3for OC and EC, respectively. The concentrations of three anions (Cl-,and) and fi ve cations (Na+,, K+, Mg2+and Ca2+) were determined in aqueous extracts of the sample fi lters by using a Dionex-600 Ion Chromatograph (Dionex Inc., Sunnyvale, CA, USA). Standard solution and blank test were performed before sample analysis and the result of correlation coef fi cient of standard samples was more than 0.999. One in 10 extracts was reanalyzed and none of the differences between these replicates exceeded precision intervals. All the reported data of water solvable ions were corrected by the filter blanks. Minimum detection limits were as follows: 0.001 μg · mL-1for Na+,, K+, Mg2+and Ca2+; 0.008 μg · mL-1for Cl-; 0.025 μg · mL-1for; and 0.027 μg · mL-1for. Traditional method for determining PAHs involve solvent extraction (SE) followed by gas chromatography/mass spectrometry (GC/MS). For our study, we used an in-injection port thermal desorption GC/MS method because it involves a short sample preparation time (<1 min), the procedure minimizes contamination from solvent impurities, and detection limits as low as a few nanograms of the target analytes can be achieved.ResultsThe concentrations of rural PM2.5were measured in winter over Shaannan. Levels of carbon species as well as OC/EC ratios are also obtained. The average concentrations of PM2.5, OC and EC were 89.5 ± 42.0 μg · m-3, 16.0 ± 6.9 μg · m-3, and 5.7 ± 3.2 μg · m-3, respectively. The average OC/EC ratio of PM2.5was 3.0 ± 0.4. The result shows a high correlation between OC and EC for the rural environment in winter (R= 0.98).The major water soluble inorganic ions were,, and.contributions were the highest of the ionic species of PM2.5, followed by. The concentrations of PAHs, BeP, and BaP were 48.9 ± 10.9 ng · m-3, 3.0 ± 0.9 ng · m-3, and 1.2 ± 0.7 ng · m-3, respectively.DiscussionThe knowledge of the compositions of PM2.5is critical for understanding and then for ameliorating the atmospheric environments. According to our observations, the site experienced heavy smoke from coal burning for cooking and heating, which were the major contributors to fine particulate emissions in winter. Considering the patterns of local energy consumption, effective control measures were proposed to reduce the emissions of local coal combustion for residential heating and cooking.ConclusionsThe discussion presented in this work could give implications for the future strategies and implementation of rural air quality improvement. Owing to the large population living in rural areas, the coal and agricultural fuel burning-activity in rural areas could signi fi cantly contribute to emissions inventories.Recommendations and perspectivesClean energy resources, such as wind and solar energy, are currently underutilized. Strategies and technology for improving energy ef fi ciency and structure will be very important in reducing emissions in rural areas.
PM2.5; chemical components; rural area; Shaannan
ZHU Chongshu, E-mail: chongshu@ieecas.cn
10.7515/JEE201605006
2016-05-01;录用日期:2016-08-07
Received Date:2016-05-01;Accepted Date:2016-08-07
国家自然科学基金项目(41271481)
Foundation Item:National Natural Science Foundation of China (41271481)
朱崇抒,E-mail: chongshu@ieecas.cn

