Evaluation and Comparative Study of Industrial Competitiveness in the Beijing-Tianjin-Hebei Area
College of Economics and Management, Huazhong Agricultural University, Wuhan 430070, China
1 Introduction
Since the reform and opening up, the Yangtze River Delta and Pearl River Delta economic zones have developed by leaps and bounds. By contrast, the Beijing-Tianjin-Hebei area is far behind in terms of economic aggregate, degree of opening to the outside world, marketization process and regional integration. On March 5, 2014, Premier Li Keqiang pointed out in Government Work Report that there was an urgent need to strengthen the economic cooperation in the Bohai Rim region and the Beijing-Tianjin-Hebei area. On April 30, 2014, the CPC Central Committee Political Bureau approvedBeijing-Tianjin-HebeiJointDevelopmentPlan, putting Beijing-Tianjin-Hebei joint development as a major strategic decision of the Party Central Committee. The interprovincial industrial competitiveness is not only a hot issue of national development since the reform and opening up, but also a classic problem in economic geography and economics[1]. Scientific and rational evaluation of industrial competitiveness in the Beijing-Tianjin-Hebei area can help to further define the status of various industries and various places in the Beijing-Tianjin-Hebei area, and provide a basis for the regional industrial development, which is of great significance to exploring the industrial division of labor in the Beijing-Tianjin-Hebei area, and enhance the overall industrial competitiveness of the Beijing-Tianjin-Hebei area. Based on the statistics about the Beijing-Tianjin-Hebei area in 2013, this paper evaluates and compares the industrial competitiveness in the Beijing-Tianjin-Hebei area, in order to provide a reference for Beijing-Tianjin-Hebei joint development.
2 Literature review
At present, domestic scholars mainly use principal component analysis to evaluate the industrial competitiveness of different provinces. Li Zhanguoetal.[2](2007) use principal component analysis to analyze the industrial competitiveness of Xinjiang, and the results show that Xinjiang’s competitive industries are mainly labor-intensive industries and resource-intensive industries. Zhang Jinghua[3](2009) uses principal component analysis to evaluate the industrial competitiveness of the western provinces and autonomous regions from the dynamic and static perspective. Du Xiaowuetal.[4](2010) use principal component analysis to evaluate the industrial competitiveness of Xinjiang’s oil and gas, and confirm the competitive position of Xinjiang’s oil and gas in China’s oil and gas industry. Zhang Liangang[5](2011) uses factor analysis, principal component analysis, entropy value method, cluster analysis and analytic hierarchy process to evaluate and compare the circulation industry competitiveness of the eastern and western provinces. In the study of coal industry competitiveness, Sun Huietal.[6](2012) use principal component analysis to build the coal industry competitiveness index system from realistic competitiveness and potential competitiveness. Sun Dongqi[1](2013) uses principal component analysis, location quotient and unitary linearity regression to analyze the industrial competitiveness model structure in Jiangsu Province and Shandong Province. Wu Shanshanetal.[7](2014) establish the provincial marine industry competitiveness evaluation index system, use set pair analysis and principal component analysis to measure the marine industrial competitiveness, and make hierarchical division of coastal provinces according to the score. Wu Kefan[8](2014) uses PCA-TOPSIS method to conduct horizontal comparison of Guangdong and other coastal provinces, and get the ranking of Guangdong in terms of comprehensive marine industry competitiveness among the coastal provinces. It can be seen that the application of principal component analysis in the study of provincial industrial competitiveness has been very common, and the method is also mature. Domestic scholars have done a lot of studies on the industries in the Beijing-Tianjin-Hebei area. From the perspective of regional integration, Zhang Xiaoweietal.[9](2009) evaluate the high-tech industry competitiveness in the Beijing-Tianjin-Hebei area. Based on economic weight correction of Boarnet formula, Ren Chongqiangetal.[10](2012) use shift-share space model to calculate the factor change in primary, secondary and tertiary industries in the Beijing-Tianjin-Hebei area during 2002—2005, 2006—2009. From the perspective of industry cluster, Li Jiahui[11](2012) uses factor analysis to measure and evaluate the equipment manufacturing industry level in the Beijing-Tianjin-Hebei area. Chu Junling[12](2014) uses shift-share analysis to study the competitive industries in the Beijing-Tianjin-Hebei area. Li Junyan[13](2015) studies the joint industrial development in the Beijing-Tianjin-Hebei area. Fu Wang[14](2015) uses location entropy grey relational analysis and SSM model to measure and analyze the industrial competitiveness of major cities in the Beijing-Tianjin-Hebei area. Yin Zheng[15](2015) studies the industrial division of labor in the Beijing-Tianjin-Hebei area, and uses industry specialization index and location entropy grey relational analysis to measure the industrial division of labor and its evolution in the Beijing-Tianjin-Hebei area during 2004, 2008 and 2012. It can be seen that there is no comparative study on the industrial competitiveness in the Beijing-Tianjin-Hebei area, so this paper uses principal component analysis to evaluate and compare the industrial competitiveness in the Beijing-Tianjin-Hebei area, which is not only of important theoretical significance, but also of important practical significance.
3 Research methods and evaluation indicator system

3.2EstablishmentofBeijing-Tianjin-HebeiindustrialcompetitivenessindicatorsystemIn Chinese Provincial Economic Competitiveness Development Report, Professor Li Jianping establishes a relatively sound scientific overall provincial economic competitiveness evaluation indicator system, to evaluate the comprehensive economic competitiveness in mainland China’s 31 provincial-level regions[17]. Referring to Professor Li Jianping’s provincial economic competitiveness evaluation indicator system, it is believed that the industrial competitiveness in the Beijing-Tianjin-Hebei area includes five elements, namely industrial structure competitiveness, agricultural competitiveness, industrial competitiveness, service industry competitiveness, and high-tech industry competitiveness. The Beijing-Tianjin-Hebei industrial competitiveness indicator system is established, including 5 second-level indicators and 33 third-level indicators, as shown in Table 1.
4 Beijing-Tianjin-Hebei industrial competitiveness measurement and comparative analysis
4.1Measurement
4.1.1Calculating eigenvalue and contribution rate ofR. This paper selects the 2013 data about the Beijing-Tianjin-Hebei area as sample indicators, and the relevant data are fromChinaStatisticalYearbook,BeijingStatisticalYearbook,TianjinStatisticalYearbook,HebeiStatisticalYearbook, andChinaStatisticalYearbookonScienceandTechnology. To facilitate the calculation and comparison, we first normalize the relevant indicator value, and then use factor analysis to analyze data by SPSS.20, to get eigenvalue and contribution rate ofR. Results show that the variable correlation matrix has two characteristic roots (22.14, 10.86), the contribution rate is 67.08% and 32.92%, respectively, and the cumulative contribution rate is exactly 100%, so the two principal factors provide the main information that can be expressed by original data, as shown in Table 2.
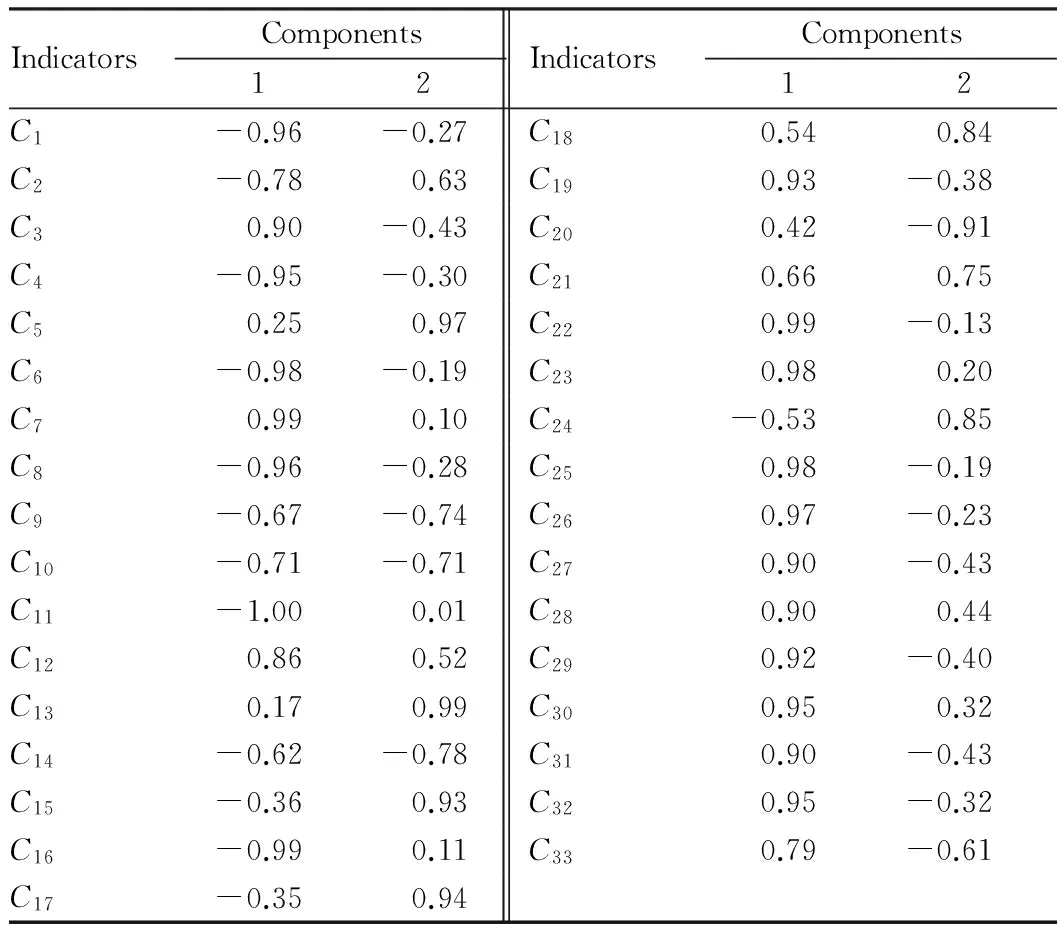
4.1.2Establishing factor loading matrix. Factor loading matrix is established for the extracted principal factorsF1andF2, as shown in Table 3. According to Table 2 and Table 3, the rate of contribution of the first principal factorF1to Beijing-Tianjin-Hebei industrial competitiveness is 67.08%, accounting for the major proportion. Rural residents’ per capita disposable incomeC7, per capita service industry added valueC22, profit-tax rate of the retail enterprises above designated sizeC23, profit-tax rate of the food and beverage enterprises above designated sizeC25, and tourism foreign exchange incomeC26, have a great load interpretation ability. Per capita service industry added valueC22, profit-tax rate of the retail enterprises above designated sizeC23, profit-tax rate of the food and beverage enterprises above designated sizeC25, and tourism foreign exchange incomeC26, primarily reflect the competitiveness of the service industry. Rural residents’ per capita disposable incomeC7reflects agricultural competitiveness. Clearly, the service industry competitiveness is an important basis of Beijing-Tianjin-Hebei industrial competitiveness, and agricultural competitiveness plays an important role in evaluating Beijing-Tianjin-Hebei industrial competitiveness. The rate of contribution of the second principal factorF2to Beijing-Tianjin-Hebei industrial competitiveness is 32.92%, occupying a minor share. Growth rate of agricultural added valueC5, per capita industrial added valueC13, contribution rate of total assets of the industrial enterprises above designated sizeC15, and asset-liability ratio of the industrial enterprises above designated sizeC17, have a great load interpretation ability. Per capita industrial added valueC13, contribution rate of total assets of the industrial enterprises above designated sizeC15, asset-liability ratio of the industrial enterprises above designated sizeC17, mainly reflect the industrial competitiveness. Growth rate of agricultural added valueC5mainly reflects agricultural competitiveness. Obviously, industrial competitiveness and agricultural competitiveness also play an important role in evaluating the Beijing-Tianjin-Hebei industrial competitiveness.
Table1Beijing-Tianjin-Hebeiindustrialcompetitivenessindicatorsystem

Second-levelindicatorsThird-levelindicatorsIndustrialstructurecom-petitivenessProportionofprimaryindustryC1∥%ProportionofsecondaryindustryC2∥%ProportionoftertiaryindustryC3∥%Agriculturalcompetitive-nessAgriculturaladdedvalueC4∥108yuanGrowthrateofagriculturaladdedvalueC5∥%PercapitaagriculturaladdedvalueC6∥yuanRuralresidentspercapitadisposableincomeC7∥yuanTotalagriculturalmachinerypowerC8∥104kWRuralpercapitaelectricityconsumptionC9∥104kWhLocalfiscalspendingonfarming,forestryandwaterconservancyC10∥108yuanIndustrialcompetitive-nessIndustrialaddedvalueC11∥108yuanGrowthrateofindustrialaddedvalueC12∥%PercapitaindustrialaddedvalueC13∥yuanTotalindustrialassetsoftheindustrialenterprisesabovedesignatedsizeC14∥108yuanContributionrateoftotalassetsoftheindustrialenterprisesabovedesignatedsizeC15∥%WorkingcapitalturnoverrateoftheindustrialenterprisesabovedesignatedsizeC16Asset-liabilityratiooftheindustrialenterprisesabovedesignatedsizeC17∥%IndustrialcostratiooftheindustrialenterprisesabovedesignatedsizeC18∥%IndustrialproductsalerateoftheindustrialenterprisesabovedesignatedsizeC19∥%Serviceindustrycompeti-tivenessServiceindustryaddedvalueC20∥108yuanGrowthrateofserviceindustryaddedvalueC21∥%PercapitaserviceindustryaddedvalueC22∥yuanProfit-taxrateoftheretailenterprisesabovedesignatedsizeC23∥%Profit-taxrateofthewholesaleenterprisesabovedesignatedsizeC24∥%Profit-taxrateofthefoodandbeverageenterprisesabovedesignatedsizeC25∥%TourismforeignexchangeincomeC26∥108yuanHigh-techindustrycom-petitivenessNumberofhigh-techindustrialenterprisesC27High-techindustrysmainbusinessincomeC28∥108yuanNumberofvalidinventionpatentsabouthigh-techindustryC29Totalimportsandexportsofhigh-techproductsC30∥$106R&DpersonnelC31∥person·yearShareofR&DexpenditureinGDPC32∥%TechnologymarketturnoverC33∥108yuan
Table2EigenvaluesandcontributionrateofR

FactorsEigenvaluesContributionrate∥%Cumulativecontributionrate∥%F122.1467.0867.08F210.8632.92100.00
Table3Principalfactorloadingmatrix

IndicatorsComponents12IndicatorsComponents12C1-0.96-0.27C180.540.84C2-0.780.63C190.93-0.38C30.90-0.43C200.42-0.91C4-0.95-0.30C210.660.75C50.250.97C220.99-0.13C6-0.98-0.19C230.980.20C70.990.10C24-0.530.85C8-0.96-0.28C250.98-0.19C9-0.67-0.74C260.97-0.23C10-0.71-0.71C270.90-0.43C11-1.000.01C280.900.44C120.860.52C290.92-0.40C130.170.99C300.950.32C14-0.62-0.78C310.90-0.43C15-0.360.93C320.95-0.32C16-0.990.11C330.79-0.61C17-0.350.94
4.1.3Calculation of Beijing-Tianjin-Hebei industrial competitiveness score. Firstly, the total factor score isF=67.08%F1+32.92%F2; secondly, the weight of each factor (CI) is calculated; finally, the normalized value is multiplied by the weight to get the score of Beijing-Tianjin-Hebei industrial structure competitiveness, agricultural competitiveness, industrial competitiveness, service industry competitiveness, and high-tech industry competitiveness. It is calculated as follows:
Findustrial structure competitiveness=3.75C1-0.43C2+1.45C3;
Fagricultural competitiveness=-3.81C4+3.7C5-3.56C6+3.33C7-3.77C8-4.28C9-4.29C10;
Findustrial competitiveness=-3.01C11+4.16C12+3.5C13-4.26C14+1.75C15-2.69C16+1.77C11+4.19+1.67C19;
Fservice industry competitiveness=-1.46C20+4.28C21+2.63C22+3.58C23+0.95C24+2.41C25+2.24C26;
Fhigh-tech industry competitiveness=1.44C27+4.05C28+1.58C29+3.84C30+1.43C31+1.89C32+0.57C33.
The results are shown in Table 4.
Table4Beijing-Tianjin-Hebeiindustrialcompetitivenessscore

RegionsFindustrialstructurecompetitivenessFagriculturalcompetitivenessFindustrialcompetitivenessFserviceindustrycompetitivenessFhigh-techindustrycompetitivenessBeijing4.417.921.526.9411.54Tianjin1.4019.6820.318.323.41Hebei-5.81-27.60-21.83-15.26-14.95
4.2ComparativeanalysisofBeijing-Tianjin-Hebeiindustrialcompetitiveness
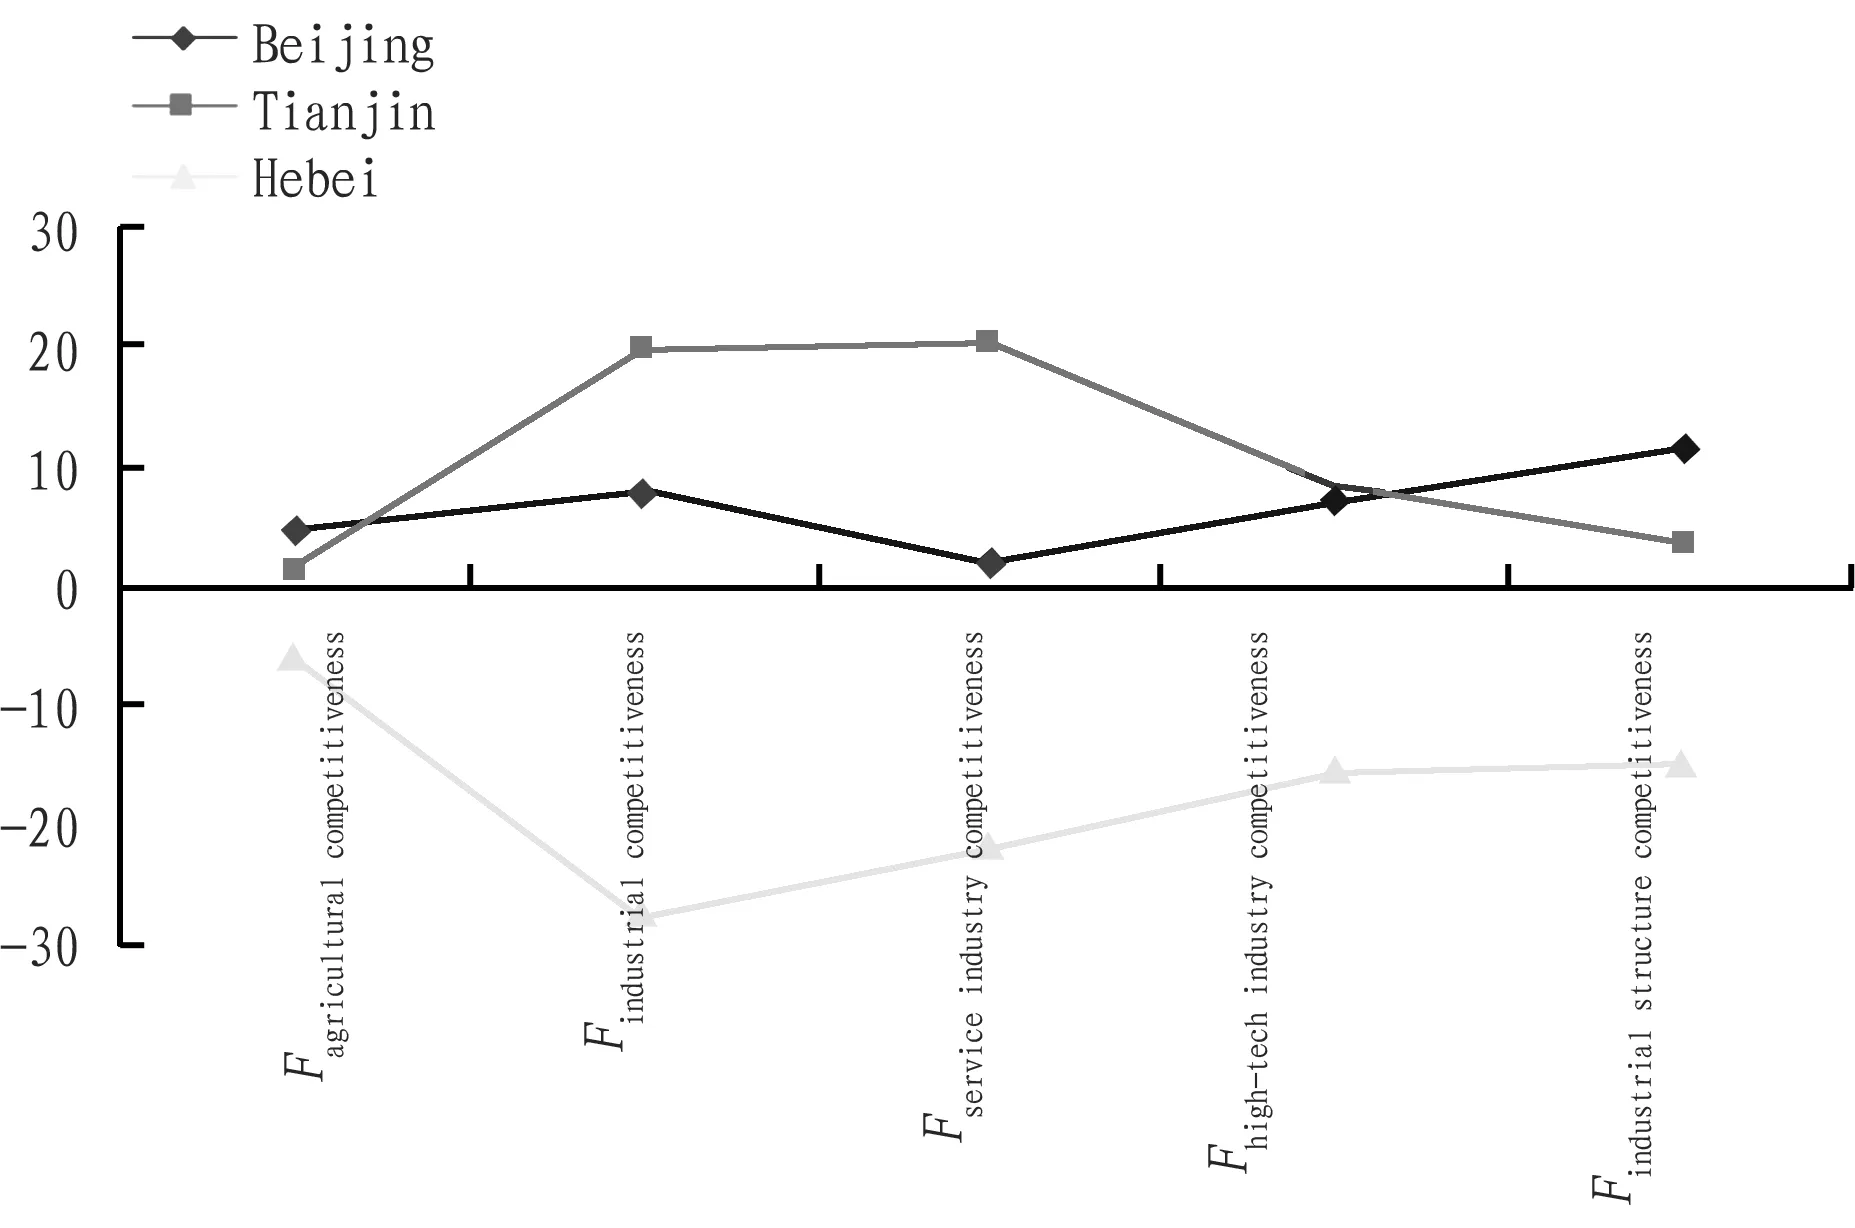
4.2.1Overall comparison. As shown in Fig. 1, the overall industrial competitiveness of Beijing and Tianjin is much higher than that of Hebei, and it can be found that Hebei is a short board in the Beijing-Tianjin-Hebei integration. Therefore, to achieve the coordinated Beijing-Tianjin-Hebei development, it is necessary to further develop the economy of Hebei Province, and enhance the industrial competitiveness of Hebei. In terms of industrial structure competitiveness and high-tech industry competitiveness, Beijing is better than Tianjin; in terms of agricultural competitiveness and industrial competitiveness, Tianjin is better than Beijing; in terms of service industry competitiveness, Tianjin is slightly better than Beijing.

Fig.1OverallcomparisonofBeijing-Tianjin-Hebeiindustrialcompetitiveness
4.2.2Comparison of industrial structure competitiveness. It can be derived from Table 4 that in terms of industrial structure competitiveness, Beijing has a score of 4.41; Tianjin has a score of 1.4; Hebei has a score of -5.81. Overall, Beijing has had the structure dominated by tertiary industry, followed by secondary industry and primary industry, while the structure is dominated by secondary industry, followed by tertiary industry primary industry for Tianjin and Hebei[18]. In the long run, the Beijing-Tianjin-Hebei area is moving towards integration, the industrial structure of the three regions will be further optimized, and the industrial structure competitiveness gap will become increasingly small.
4.2.3Comparison of agricultural competitiveness. As can be seen from Table 4, in terms of agricultural competitiveness, Beijing has a score of 7.92; Tianjin has a score of 19.68; Hebei has a score of -27.6. It is in the order of Tianjin> Beijing>Hebei, and there is a big gap among the three regions. Taking into account the Beijing-Tianjin-Hebei integration and coordinated development, Hebei is more suitable for the development of agriculture than Tianjin and Beijing. In recent years, the agricultural production capacity in Hebei Province has been constantly enhanced and the agricultural economic structure has been further optimized, making Hebei have more competitive advantages in the development of agricultural industry.
4.2.4Comparison of industrial competitiveness. According to Table 4, we can see that in terms of industrial competitiveness, Beijing has a score of 1.52; Tianjin has a score of 20.31; Hebei has a score of -21.83. It is in the order of Tianjin>Beijing>Hebei, and Tianjin is far ahead of Beijing and Hebei. In Hebei, the industrial base is weak in some areas, and the lack of capital and technological innovation ability leads to low level of industrial development in Hebei. Beijing is the country’s political and cultural center, and its economic function is further weakened. Therefore, Tianjin is more suitable for the development of industry than Beijing and Hebei.
4.2.5Comparison of service industry competitiveness. As can be seen from Table 4, in terms of service industry competitiveness, Beijing has a score of 6.94; Tianjin has a score of 8.32; Hebei has a score of -15.26. It is in the order of Tianjin>Beijing>Hebei, and the score of Tianjin and Beijing is much higher than that of Hebei, while there is small difference in score between Tianjin and Beijing. Therefore, Tianjin and Beijing have more advantages than Hebei in developing the service industry. At the same time, from the principal factor extraction and analysis, it is found that the Beijing-Tianjin-Hebei industrial competitiveness hinges in a large measure on service industry competitiveness, and service industry has become the main industry to provide jobs, and pillar industry for industrial structure optimization and economic growth[19]. Therefore, Beijing, Tianjin and Hebei need to vigorously develop the local service industry.
4.2.6Comparison of high-tech industry competitiveness. We can see from Table 4 that in terms of high-tech industry competitiveness, Beijing has a score of 11.54; Tianjin has a score of 3.41; Hebei has a score of -14.95. It is in the order of Beijing>Tianjin>Hebei, and Beijing is far ahead. This also shows that Beijing has a unique advantage in the development of high-tech industries, more suitable for the development of high-tech industries. High-tech industry has become an important engine of Beijing’s economic development.
5 Conclusions and policy recommendations
5.1ConclusionsWith the industrial competitiveness in the Beijing-Tianjin-Hebei area in 2013 as the object of study, this paper uses principal component analysis to evaluate and compare the industrial competitiveness in the Beijing-Tianjin-Hebei area, in order to provide reference for Beijing-Tianjin-Hebei joint development. The results show that in terms of industrial structure competitiveness, Beijing>Tianjin>Hebei; in terms of agricultural competitiveness, Tianjin>Beijing>Hebei; in terms of industrial competitiveness, Tianjin>Beijing>Hebei; in terms of service industry competitiveness, Tianjin>Beijing>Hebei; in terms of high-tech industry competitiveness, Beijing>Tianjin>Hebei.
5.2Policyrecommendations(i) In terms of industrial structure competitiveness, it is particularly important to optimize the industrial structure, and improve the industrial structure competitiveness for Beijing, Tianjin and Hebei. (ii) In terms of agricultural competitiveness, Tianjin is better than Beijing and Hebei, but Hebei is more suitable for the development of agricultural industry. In the development of the province’s agricultural industry, Hebei government should further adjust the agricultural layout, develop efficient ecological agriculture, and use the advantages of location close to Beijing and Tianjin to develop suburban modern agriculture. (iii) In terms of industrial competitiveness, Tianjin is better than Beijing and Hebei, and Tianjin is more suitable for the development of regional industry. Tianjin government should undertake the transfer of Beijing’s industries, optimize the region’s electronic information and advanced manufacturing, and construct new research and development platform. (iv) In terms of service industry competitiveness, Tianjin is better than Beijing and Hebei, but Beijing, Tianjin and Hebei all need to further develop the service industry in the region. The Beijing-Tianjin-Hebei area should actively adjust the structure of service industry, and promote the development of modern service industry represented by financial industry, business service industry, cultural sports and entertainment industry, and real estate industry. (v) In terms of Beijing-Tianjin-Hebei integration, the state should strengthen Beijing’s financial management, Tianjin’s innovative financial operation and Hebei’s financial background services. (vi) In terms of high-tech industry competitiveness, Beijing is better than Tianjin and Hebei, so Beijing has more advantages in the development of high-tech industries. Beijing should further improve industrial support policy system, accelerate the upgrading of traditional high-tech industries, and nurture and develop strategic emerging industries.
[1] SUN DQ.The comparison of industrial competitiveness model and the study of competition path in Jiangsu and Shandong[J]. Economic Geography, 2013(2):128-134. (in Chinese).
[2] LI ZG, GAO ZG. The evaluation of regional industrial competitiveness in Xinjiang based on principal component analysis[J]. Journal of Xinjiang Finance & Economy Institute, 2007(1):25-28. (in Chinese).
[3] ZHANG JH. Analysis on regional industrial competitiveness in West China[J]. Journal of North China Electric Power University(Social Sciences), 2009(2):31-34. (in Chinese).
[4] DU XW, HUANG X. Evaluation of oil and gas industrial competitiveness in Xinjiang based on principal component analysis[J].Reformation & Strategy,2010(6):127-129.(in Chinese).
[5] ZHANG LG. On the construction and the empiricial study of the evaluation system of provincial circulation industry competitiveness[D]. Chengdu: Southwestern University of Finance and Economics, 2011. (in Chinese).
[6] SUN H, LIU YY, ZHANG NN. A case study of coal industrial competitiveness based on PCA[J]. Resources & Industries, 2012(1): 144-149. (in Chinese).
[7] WU SS, ZHANG FC, CAO K. Marine industry competitiveness of coastal provinces in China based on set pair analysis and principal component analysis[J]. Resources Science, 2014, 36(11): 2386-2391.(in Chinese).
[8] WU KF. Evaluation on the competitiveness of Guangdong marine industry based on principal component analysis and TOPSIS method[D]. Guangzhou: Guangdong Academy of Social Sciences, 2014. (in Chinese).
[9] ZHANG XW, LI DS. Study on the evaluation of the competitiveness of hitech industry among Beijing-Tianjin-Hebei Region[J]. Industrial Technology & Economy, 2009(12): 103-106. (in Chinese).
[10] REN CQ, ZONG YG, WANG YJ.Study on the spatial differentiation of industry in Beijing-Tianjin-Hebei Region[J].Areal Research and Development,2012(3):1-5.(in Chinese).
[11] LI JH. Research on the competitiveness of equipment manufacturing industry in the area of Beijing, Tianjin and Hebei Province-from the perspective of industry cluster[D].Shijiazhuang: Hebei University of Economics and Business,2012.(in Chinese).
[12] CHU JL. Study on the selection of competitive industries in the area of Beijing, Tianjin and Hebei Province[D].Tianjin: Tianjin University of Commerce,2014.(in Chinese).
[13] LI JY. The study on regional industry coordinated development of Beijing-Tianjin-Hebei[D].Tianjin: Tianjin Normal University,2015.(in Chinese).
[14] FU W. On the measurement of industrial competitiveness of Beijing-Tianjin-Hebei urban agglomeration[J]. Global Market Information Guide, 2015(19): 20-21. (in Chinese).
[15] YIN Z, LU MH. Study on the changes of industrial division among the cities in the Beijing-Tianjin-Hebei Region[J].Economic Geography,2015(10):110-115.(in Chinese).
[16] Principal component analysis[Z].MBA Think Tank. (in Chinese).
[17] LI JP, LI MR, GAO YJ. The development report of provincial economic comprehensive competitive power in China[M]. Beijing:Social Sciences Academic Press(China), 2010:377-406. (in Chinese).
[18] WANG D. Study on the industrial structure optimization under the background of the coordinated development of Beijing-Tianjin-Hebei[J]. Economic Tribune, 2014(8): 13-16. (in Chinese).
[19] JIANG XJ. On the thought, target and system policy guarantee of the development of service industry during "the 11th five-year plan" period[J]. Management World, 2005(1):2-8, 171.(in Chinese).
 Asian Agricultural Research2016年10期
- Asian Agricultural Research的其它文章
- Static and Dynamic Analysis on the Environmental Efficiency of 267 Cities in China during 2004-2012
- Analysis of Patterns and Benefits of Cultivated Land Transfer in Rural Areas in the Loess Plateau
——A Case Study of Yuanzhou District of Ningxia - Genetic Variation Analysis of Watermelon Genomes with Different Ploidy
- A Study on the Adaptability of Yunnan Tea Cultivars in Southern Fujian
- An Empirical Study on Rural Economic Growth in Hubei Province Based on New C-D Production Function
- Demands of New Professional Farmers for Agricultural Leading Industry in Anhui Province
