A Study of Estimation Model for the Chlorophyll Content of Wheat Leaf Based on Hyperspectral Imaging
,
Science and Technology Information Institute, Shandong Academy of Agricultural Sciences, Jinan 250100, China
1 Introduction
Chlorophyll content is an important biochemical parameter in the process of plant growth, and plays an indicative function in vegetation photosynthetic capacity, developmental stage and nutritional status[1]. At present, the commonly used methods for monitoring chlorophyll content include spectrophotometry and SPAD-502 chlorophyll meter method. The traditional spectrophotometry is time-consuming and needs much effort, and it is destructive test. The hand-held SPAD-502 chlorophyll meter produced by Japan Minolta Camera Company can only monitor leaf point by point, and it needs to measure the average of many plants as the measurement result, requiring a large amount of work[2]. Hyperspectral remote sensing is a fast non-destructive technology that can achieve the monitoring of crop nutritional status during the growing season without destroying the plant tissue structure[3]. Domestic scholars’ studies of hyperspectral imaging of wheat are focused on hyperspectral differences in wheat leaf nitrogen content[4]and its estimation[5], wheat biomass, leaf area index estimation[6-7], wheat stripe rust[8-9],Gaeumannomycesdisease[10], powdery mildew[11], and wheat grain protein content[12]. The study of wheat chlorophyll content is concentrated in Shanxi[13], Henan[14], Zhejiang[15]and other places, but the hyperspectral estimation of wheat chlorophyll content in Shandong is rarely reported. In this study, we try to use the hyperspectral data and chlorophyll content of wheat to establish the quantitative relationship model between wheat leaf chlorophyll content and spectral features on the basis of relational analysis, in order to provide theoretical basis and technical support for the use of hyperspectral remote sensing technology to monitor wheat growth.
2 Materials and methods
2.1ExperimentandsamplecollectionThe experiment was carried out in Longshan experimental base (117.53°E, 36.72°N) from November 2014 to June 2015. The test variety is Jimai 22, and the seeding rate is 150 kg/ha. The application rate of pure nitrogen in the experiment is 280 kg/ha, the application rate of phosphorus and potassium fertilizer is consistent with local practices, and other cultivation and management measures are the same as that of wheat field. The data measurement and sampling period is as follows: April 10 (jointing period); April 17 (booting period); April 30 (heading period); May 12 (flowering period); May 22 (filling period); June 2 (maturity period).
2.2Determinationandmethods
2.2.1Determination of wheat spectral data. The canopy leaf spectrum is measured using the SOC710VP visible-near infrared hyperspectral imaging spectroradiometer produced by the US Surface Optics Corporation. The spectral range is 370-1000 nm and the spectral resolution is 4.6875 nm. The spectrometric analysis is conducted in the laboratory with controllable lighting conditions (tungsten lighting). Before measurement, the leaf surface, whose spectrum to be measured, is wiped clean. In measurement, the single layer of leaf is put flat on the black test platform with reflectance of approximately zero, and both ends of leaf are pressed by a black plate to prevent leaf bending. The viewing angle of the spectrometer is 25°, and the test probe is 0.5 m from the leaf to be tested, vertically down the middle of the leaf. In order to eliminate outside interference and ensure accuracy, we select two fixed locations in the test area, and take six to eight leaves in each location. The average hyperspectral reflectance of the leaf in the two locations is regarded as the spectral reflectance in the area, and the standard white plate is calibrated in a timely manner during the measurement process.
2.2.2SPAD value measurement of wheat chlorophyll. The test uses SPAD-502 chlorophyll meter to measure the SPAD value of wheat canopy leaf. The SPAD value of wheat chlorophyll and spectrum is measured simultaneously. In order to reduce measurement error, five values in the treatment area are taken consecutively and averaged as one measured value, and five groups of data are measured continuously.
2.3HyperspectraldatapreprocessingThe SRAnal 710 software is used for data preprocessing, and the hyperspectral image cube data obtained by SOC 710 go through three steps of calibration, including spectral calibration, black frame calibration and spectral radiation calibration. Using SRAnal 710, the reflectance is extracted from the measured spectral data. In order to eliminate the influence of interference factors in the raw spectral data on the model, the 5-point weighted smoothing method is used to smooth the collected original spectrum. As for the extraction of red edge position of wheat leaf, the first derivative is sought on the raw spectral data, and the red edge contains a wealth of vegetation growth information, closely related to plant physiological and biochemical parameters. Seeking the first derivative on reflectance can reduce the impact of contextual factors, and clearly reflect the changes in spectral characteristics of plants. The wave band with the biggest change in the first derivative is in the red edge area.
2.4DataprocessingmethodAll data are entered into Excel, ENVI 4.7 is used for image processing, OriginPro 8.5, SPSS 18.0 and Matlab are used for correlation analysis. Pearson correlation coefficient is used for the characterization of correlation between the raw spectral reflectance and chlorophyll content of wheat leaf. The larger the absolute value of Pearson correlation coefficient, the stronger the correlation. To test the fitting effect between the measured value and the estimated value, we use the coefficient of determination (R2), root mean square error (RMSE) and relative error (RE) to test the model, in order to select the best hyperspectral monitoring model for the chlorophyll content of wheat leaf.
3 Results and analysis
3.1HyperspectralfeaturesofwheatleafatdifferentgrowthstagesAt different growth stages, the reflection spectrum curves of wheat leaf show similar changes. However, due to difference in chlorophyll content, moisture content, physical and chemical composition and structure of wheat leaf, there will be difference in the hyperspectral reflectance. Fig. 1 shows that at different growth stages, the shape and change of wheat leaf spectral reflectance are substantially similar. The reflectance curve trend of wheat leaf at different growth stages is basically consistent in the visible range, and it is in the order of filling period> booting period> heading period> jointing period>flowering period> maturity period. In the near-infrared area, the hyperspectral curve reflectance of wheat leaf at different growth stages shows significant differences in reflective platform, and the reflectance is in the order of filling period> booting period> heading period> jointing period> flowering period> maturity period. In the same growth period and different wavelength range, the spectral reflectance exhibits different characteristics with the wavelength change. In the green wave band starting from 500 nm, the leaf absorption is reduced, the reflectivity is enhanced, and an apparent reflectance peak is formed in the vicinity of 550 nm. The blue, violet wave band absorption trough is to the left of the crest, and the 675 nm red wave band absorption trough is to the right. Subsequently, the reflectance rises sharply, and the infrared wave band forms a high reflectivity platform in the vicinity of 750-1080 nm.
3.2ExtractionofrededgepositionRed edge is the point with the fastest increase of reflectance between 680 and 760 nm for green plant, and also the inflection point of the first derivative in the range, which is due to the plant’s strong absorption in the red wave band and reflectance in the infrared wave band. From the first derivative spectrum of wheat leaf in Fig. 2, it can be found that the trend of curves is substantially similar. Clear crest is formed at 523 nm and 710 nm while clear trough is formed at 564 nm and 652 nm. Using the wave band with the maximum value of first derivative, the red edge position is extracted. The red edge in this study is at 726 nm wavelength. The correlation coefficient of the original spectrum reaches 0.671, and the correlation coefficient of the first derivative in this position is 0.768, so the first derivative of spectral reflectance of red edge position is identified as sensitive variable.
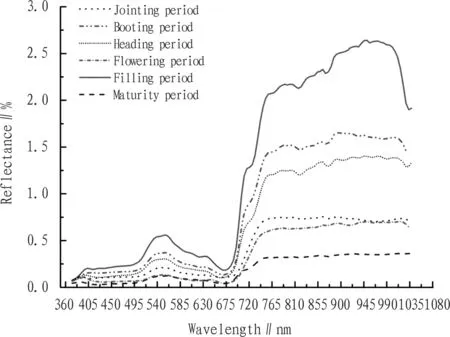
Fig.1Thechangesinspectralreflectionofwheatleafatdifferentgrowthstages
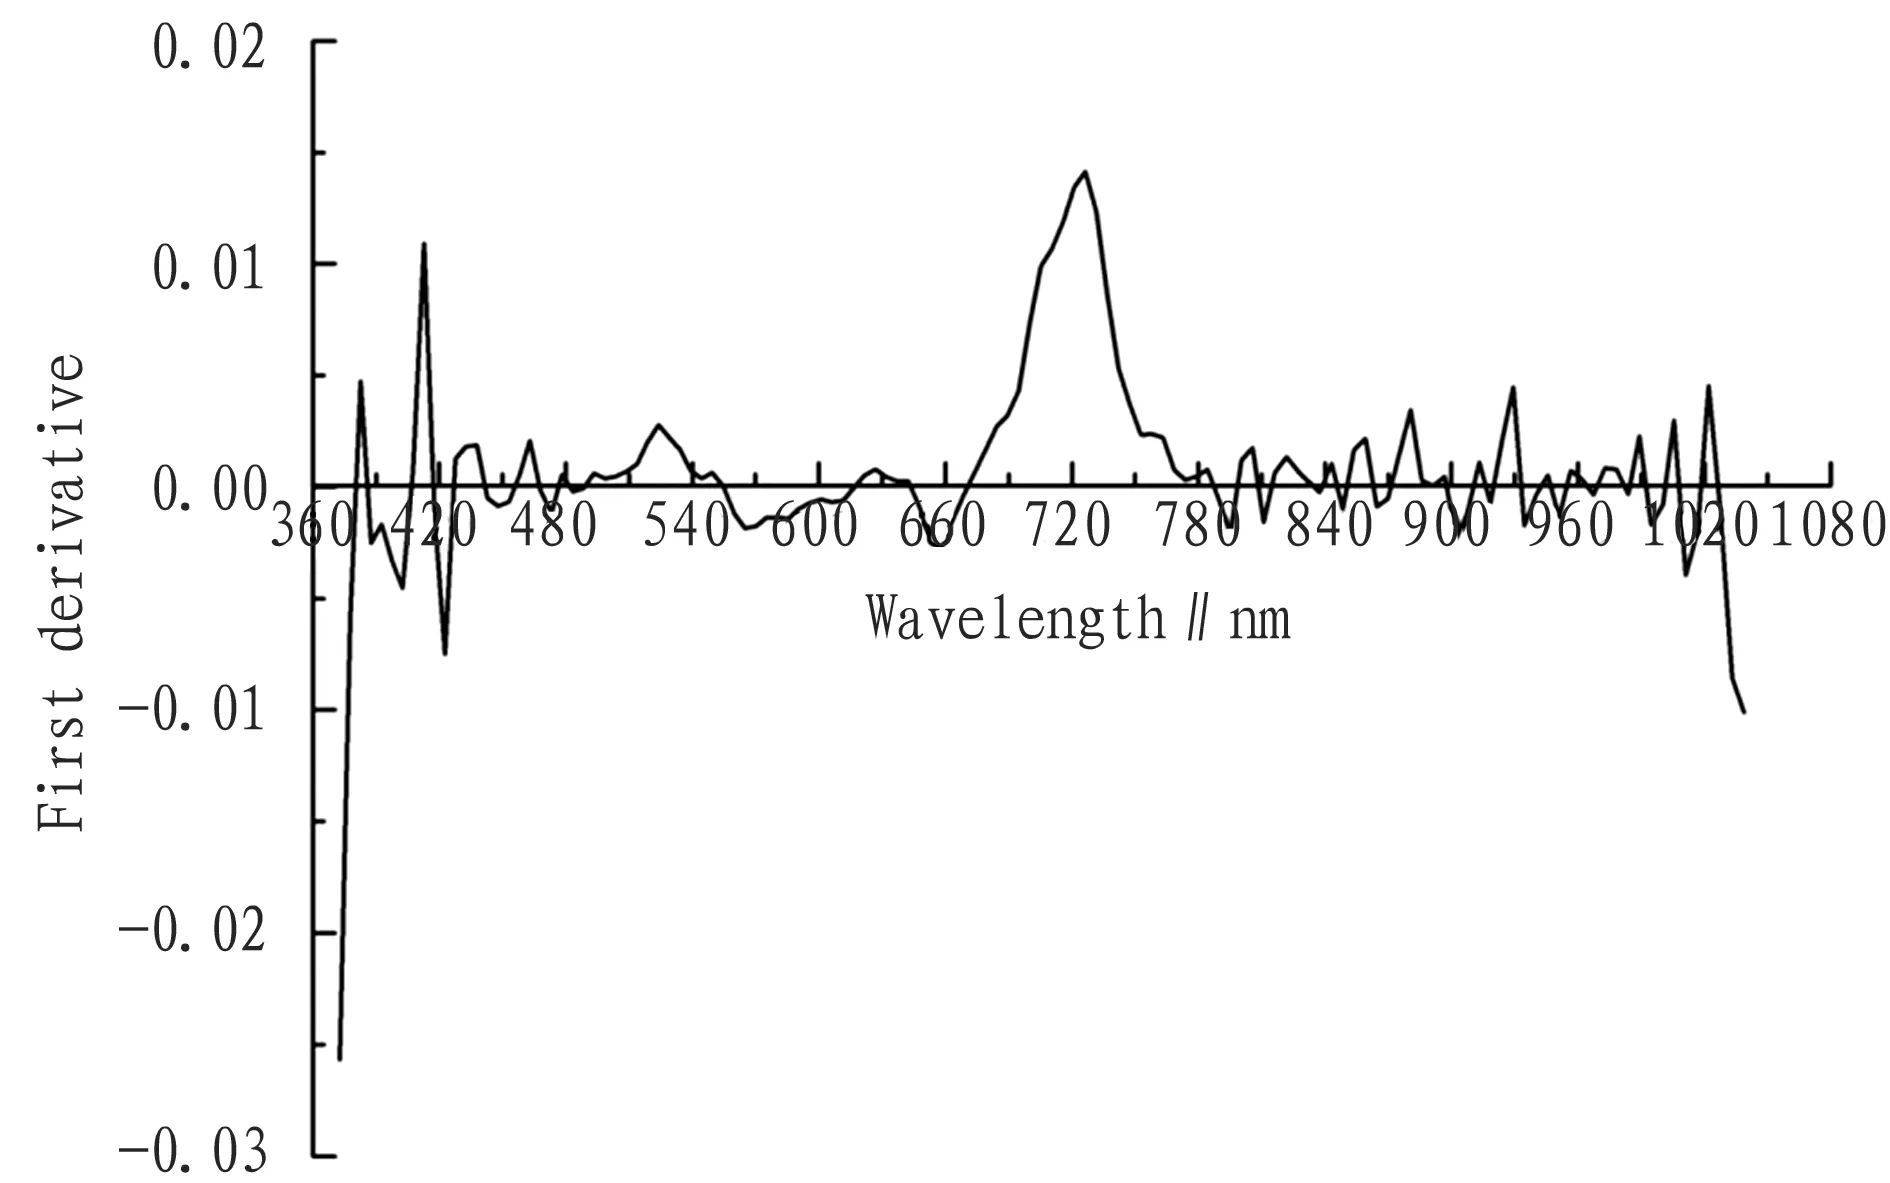
Fig.2Spectralcurvecharacteristicsofthefirstderivativeofwheatleaf
3.3RelationalanalysisofchlorophyllcontentandspectralreflectanceofwheatleafaswellasitsfirstderivativeThe relational analysis, combined with SPSS statistical analysis, is conducted on the original spectral reflectance of wheat leaf and chlorophyll content. The results show that the original canopy spectral reflectance of wheat is positively correlated with chlorophyll content (Fig. 3a). In 372-397 nm wave band, the original canopy spectral reflectance of wheat is significantly positively correlated with chlorophyll content (P<0.05). The maximum correlation coefficient in the visible range appears at the 732 nm position, and the Pearson correlation coefficient is 0.696. The correlation coefficient reaches the peak in 377-407 nm and 694-742 nm, and the average correlation coefficient is 0.807 and 0.641, respectively, so the original spectral reflectance of the two groups of wave band is chosen as the sensitive wave band to estimate wheat leaf chlorophyll content. In the near-infrared range, the maximum correlation coefficient appears at the 1033 nm position, and the Pearson correlation coefficient is 0.737. Another peak position appears at a wavelength of 973 nm, and the Pearson correlation coefficient here is 0.667. The relational analysis is conducted on the first derivative of original spectral reflectance of wheat leaf and chlorophyll content (Fig. 3b). Based on the SPSS statistical analysis results, it can be found that at a wavelength of 377 nm, the Pearson correlation coefficient is 0.846, and the significance (two-way) levelP<0.05; at a wavelength of 757 nm, the Pearson correlation coefficient is 0.864, and the significance (two-way) levelP<0.05; at a wavelength of 742 nm, the Pearson correlation coefficient is 0.641, and the significance (two-way) levelP<0.05. In the near-infrared range, crest appears at a wavelength of 940 nm, and the Pearson correlation coefficient is 0.553; crest appears at a wavelength of 918 nm, and the Pearson correlation coefficient is 0.355; trough appears at a wavelength of 927 nm, and the Pearson correlation coefficient is -0.524; trough appears at a wavelength of 951 nm, and the Pearson correlation coefficient is -0.576. Therefore, the first derivative of these wave bands and the small intervals are regarded as the sensitive variables. Based on the above analysis, 5 wave band intervals and 7 single-band combinations are as sensitive variables, namely 732 nm, 377-407 nm, 694-742 nm original spectral reflectance; 503-544 nm, 684-715 nm, 736-763 nm, and 377 nm, 523 nm, 710 nm, 742 nm and 757 nm first derivative; the first derivative on the red edge of 726 nm.
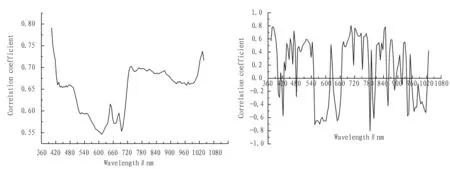
a. chlorophyll content and original canopy spectral reflectance b. chlorophyll content and first derivative of original spectral reflectance
Fig.3Correlationbetweenchlorophyllcontentandoriginalcanopyspectralreflectanceofwheatleafaswellasitsfirstderivative
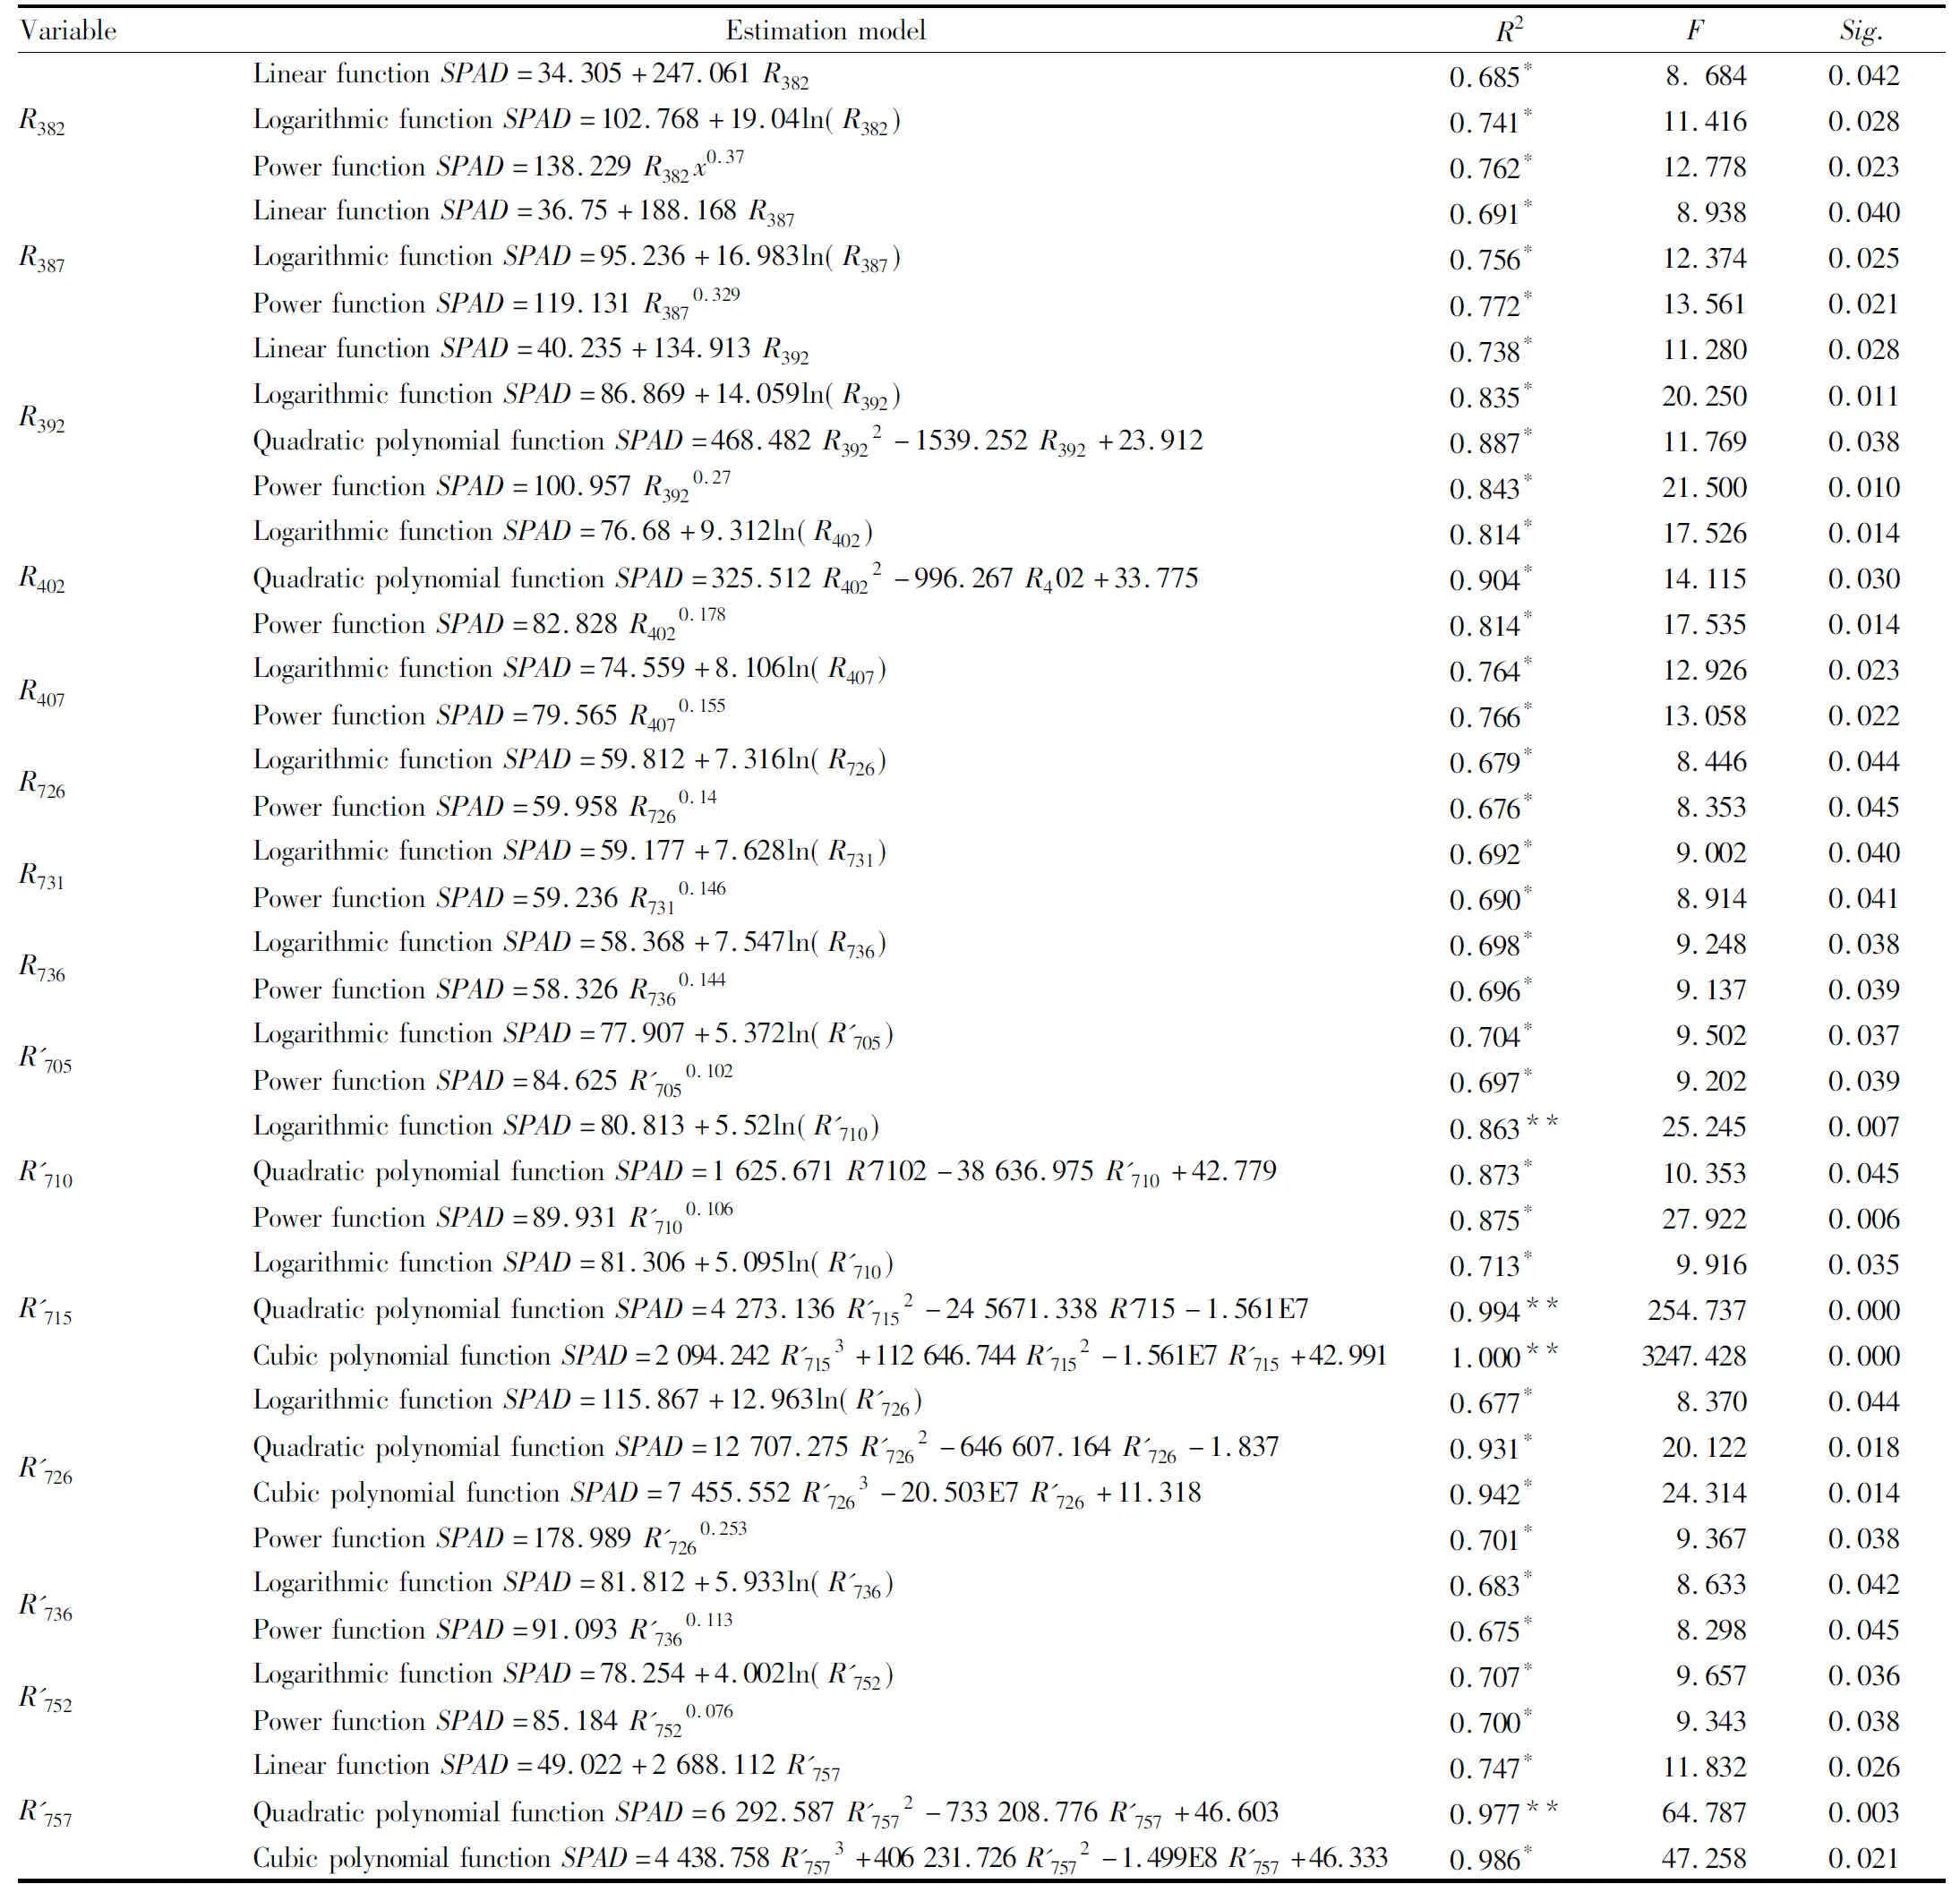
3.4ModelingbasedonsensitivewavebandUsing SPSS software, after various changes in sensitive wave band, the regression model is established, and the model with high degree of fitting is identified in various changes. The screening results are shown in Table 1. As can be seen from Table 1, the cubic polynomial functional estimation model is determined with the first derivative at 715 nm as the variable, andR2reaches a maximum of 1.000**; it is followed by the quadratic polynomial functional estimation model with the first derivative at 715 nm as the variable, andR2reaches 0.994**; for the cubic and quadratic polynomial functional estimation models determined with the first derivative at 757 nm and 726 nm as the variable,R2reaches 0.977**, 0.986*, and 0.931*, 0.942*, respectively; for the quadratic polynomial functional estimation model determined with the original reflectance spectrum value at 392 nm and 402 nm as the variable,R2reaches 0.887*and 0.904*, respectively. For other models,R2is relatively small. Therefore, the 9 estimation models and 4 significantly correlated linear functions are used for further model verification.
3.5ModelverificationIn order to test the accuracy and reliability of the estimation model, we randomly select the wheat leaf testing data measured in the same set of experiment, to test the estimation model of the selected wheat leafSPADvalue, and determine the model with high testing precision. As can be seen from Table 2, forR387,R2of the fitting equation reaches 0.713,RMSEis lowest, and the monitoring model established for wheat leaf chlorophyll content has good fitting effect, suggesting thatR387model can best monitor the wheat leaf chlorophyll content, followed byR382, and other estimation models are excluded due to low testing precision. Therefore, the best estimation models are the linear function model withR387as variable and cubic polynomial function model withR’715as variable.
Table1Theaccuracyoftheregressionmodelanditsparameters(n=84)
VariableEstimationmodelR2FSig.R382LinearfunctionSPAD=34.305+247.061R3820.685*8.6840.042LogarithmicfunctionSPAD=102.768+19.04ln(R382)0.741*11.4160.028PowerfunctionSPAD=138.229R382x0.370.762*12.7780.023R387LinearfunctionSPAD=36.75+188.168R3870.691*8.9380.040LogarithmicfunctionSPAD=95.236+16.983ln(R387)0.756*12.3740.025PowerfunctionSPAD=119.131R3870.3290.772*13.5610.021R392LinearfunctionSPAD=40.235+134.913R3920.738*11.2800.028LogarithmicfunctionSPAD=86.869+14.059ln(R392)0.835*20.2500.011QuadraticpolynomialfunctionSPAD=468.482R3922-1539.252R392+23.9120.887*11.7690.038PowerfunctionSPAD=100.957R3920.270.843*21.5000.010R402LogarithmicfunctionSPAD=76.68+9.312ln(R402)0.814*17.5260.014QuadraticpolynomialfunctionSPAD=325.512R4022-996.267R402+33.7750.904*14.1150.030PowerfunctionSPAD=82.828R4020.1780.814*17.5350.014R407LogarithmicfunctionSPAD=74.559+8.106ln(R407)0.764*12.9260.023PowerfunctionSPAD=79.565R4070.1550.766*13.0580.022R726LogarithmicfunctionSPAD=59.812+7.316ln(R726)0.679*8.4460.044PowerfunctionSPAD=59.958R7260.140.676*8.3530.045R731LogarithmicfunctionSPAD=59.177+7.628ln(R731)0.692*9.0020.040PowerfunctionSPAD=59.236R7310.1460.690*8.9140.041R736LogarithmicfunctionSPAD=58.368+7.547ln(R736)0.698*9.2480.038PowerfunctionSPAD=58.326R7360.1440.696*9.1370.039R705LogarithmicfunctionSPAD=77.907+5.372ln(R705)0.704*9.5020.037PowerfunctionSPAD=84.625R7050.1020.697*9.2020.039R710LogarithmicfunctionSPAD=80.813+5.52ln(R710)0.863**25.2450.007QuadraticpolynomialfunctionSPAD=1625.671R7102-38636.975R710+42.7790.873*10.3530.045PowerfunctionSPAD=89.931R7100.1060.875*27.9220.006R715LogarithmicfunctionSPAD=81.306+5.095ln(R710)0.713*9.9160.035QuadraticpolynomialfunctionSPAD=4273.136R7152-245671.338R715-1.561E70.994**254.7370.000CubicpolynomialfunctionSPAD=2094.242R7153+112646.744R7152-1.561E7R715+42.9911.000**3247.4280.000R726LogarithmicfunctionSPAD=115.867+12.963ln(R726)0.677*8.3700.044QuadraticpolynomialfunctionSPAD=12707.275R7262-646607.164R726-1.8370.931*20.1220.018CubicpolynomialfunctionSPAD=7455.552R7263-20.503E7R726+11.3180.942*24.3140.014PowerfunctionSPAD=178.989R7260.2530.701*9.3670.038R736LogarithmicfunctionSPAD=81.812+5.933ln(R736)0.683*8.6330.042PowerfunctionSPAD=91.093R7360.1130.675*8.2980.045R752LogarithmicfunctionSPAD=78.254+4.002ln(R752)0.707*9.6570.036PowerfunctionSPAD=85.184R7520.0760.700*9.3430.038R757LinearfunctionSPAD=49.022+2688.112R7570.747*11.8320.026QuadraticpolynomialfunctionSPAD=6292.587R7572-733208.776R757+46.6030.977**64.7870.003CubicpolynomialfunctionSPAD=4438.758R7573+406231.726R7572-1.499E8R757+46.3330.986*47.2580.021
Note:**indicatesP<0.01;*indicatesP<0.05.
Table2Modelfittingprecisionparametertesting(n=12)

VariableEstimationmodelFittingequationofthemeasuredandestimatedvaluesTestingindicatorsSlopeR2RMSERE%R715SPAD=2094.242R7153+112646.744R7152-1.561E7R715+42.991y=0.758x+9.7500.7580.2974.1248.74R757SPAD=4438.758R7573+406231.726R7572-1.499E8R757+46.333y=0.336x+37.830.3360.1553.7515.82R382SPAD=34.305+247.061R382y=0.784x+12.840.7840.5581.3371.14R387SPAD=36.75+188.168R387y=0.860x+7.8570.8600.7131.9521.81R392SPAD=40.235+134.913R392y=0.872x+7.9300.8720.5643.4485.68
4 Conclusions and discussions
Affected by season, soil, climate and other natural factors and fertilization, cultivation techniques, management and other human factors, there will be different changes in the hyperspectral information of wheat leaf. This study focuses on the monitoring of wheat leaf chlorophyll content under certain N treatment, and the sample data for the same region are used to verify the model, which enhances the credibility and adaptability of monitoring model, but there is a need to do further exploration about whether it can be used for monitoring wheat leaf chlorophyll content in different regions, at different growth stages for different varieties. In this study, using the relationship between chlorophyll content and hyperspectral features, we establish the estimation model of wheat chlorophyll content, and conduct the precision test and comparison to determine the best estimation model for wheat chlorophyll content in Shandong as the linear functionSPAD=36.75+188.168R387withR387as variable and the cubic polynomial functionSPAD=2094.242R’7153+112 646.744R’7152-1.561E7R’715+42.991 withR’715as variable. The model provides a method and reference for the estimation of wheat chlorophyll content, and has certain guiding significance and reference value for the precise fertilization and rapid, non-destructive growth monitoring of wheat.
[1] JIANG JB, CHEN YH, HUANG WJ. Using hyperspectral remote sensing to estimate canopy chlorophyll density of wheat under yellow rust stress [J]. Spectroscopy and Spectral Analysis, 2010,30(8):2243-2247. (in Chinese).
[2] WANG JH, HUANG WJ, LAO CL,etal. Inversion of winter wheat foliage vertical distribution based on canopy reflected spectrum by partial least squares regression method [J].Spectroscopy and Spectral Analysis,2007,27(2):1319-1322. (in Chinese).
[3] WANG KR, PAN WC, LI SK,etal. Monitoring models of the plant nitrogen content based on cotton canopy hyperspectral reflectance [J]. Spectroscopy and Spectral Analysis, 2011,31(7):1868-1872.(in Chinese).
[4] ZHAI QY, ZHANG JJ, XIONG SP,etal. Research on hyperspectral differences and monitoring model of leaf nitrogen content in wheat based on different soil textures [J].Scientia Agricultura Sinica,2013,46(13):2655-2667.(in Chinese).
[5] LIU MD, XUE JH, CHU J,etal. Research of the hyperspectral vegetation in deices for the estimation of the nitrogen content of wheat canopy in agro-forestry system [J]. Journal of Nanjing Forestry University (Natural Science Edition), 2015, 39(3): 91-95. (in Chinese).
[6] SUN XY, CHANG XL, ZHANG N,etal. Impact of different sampling units on ground spectral models for estimating wheat aboveground biomass in oases of arid zone [J].Journal of Desert Research, 2012,32(2):568-573.(in Chinese).
[7] HOU XH, NIU Z, HUANG N,etal. The hyperspectral remote sensing estimation models of total biomass and true LAI of wheat [J]. Remote Sensing for Land & Resources, 2012,95(4):30-35.(in Chinese).
[8] WANG HG, MA ZH, WANG T,etal. Application of hyperspectral data to the classification and identification of severity of wheat stripe rust [J].Spectroscopy and Spectral Analysis, 2007,27(9):1811-1814.(in Chinese).
[9] WANG S, MA ZH, SUN ZY,etal. Yield loss assessment under wheat stripe rust stress based on hyperspectral remote sensing [J]. Chinese Agricultural Science Bulletin, 2011,27(21):253-258.(in Chinese).
[10] QIAO HB, SHI Y, GUO W,etal. In-situ wheat take-all monitoring based on imaging spectrometer [J]. Acta Phytophylacica Sinica, 2015,42(3):475-476.(in Chinese).
[11] SHEN WY, FENG W, LI X,etal. Estimation model of wheat powdery mildew severity based on leaves hyperspectral characteristics [J].Journal of Triticeae Crops, 2015,35(1):129-137.(in Chinese).
[12] FENG W, YAO X, TIAN YC,etal. Predicting grain protein content with canopy hyperspectral remote sensing in wheat [J].Acta Agronomica Sinica, 2007,33(12):1935-1942.(in Chinese).
[13]LI FZ, FENG MC, YANG WD,etal. Monitoring of winter wheat chlorophyll content in irrigated and dry lands of Shanxi Province of China based on hyperspectral remote sensing [J]. Chinese Journal of Ecology, 2013,32(12):3213-3218.(in Chinese).
[14]ZHANG JJ, XIONG SP, ZHAI QY,etal. Hyper-spectral remote sensing response and estimation model of leaf chlorophyll content of wheat under different soil textures [J].Journal of Triticeae Crops,2014,34(5):642-647.(in Chinese).
[15] YANG HQ, YAO JS, HE Y. SPAD prediction of leave based on reflection spectroscopy [J]. Spectroscopy and Spectral Analysis, 2009, 29(6):1607-1610.(in Chinese).
 Asian Agricultural Research2016年8期
- Asian Agricultural Research的其它文章
- Empirical Analysis on Financial Development, Urbanization, and Urban and Rural Resident Income in Jiangsu Province
- Farmer’s Perception on Supply-Demand Matching of New Variety and Its Influence Factors
- Vegetation Coverage Changes in the West Qinling Region from 2000 to 2010: A Case Study of Longnan City
- A Study of Virtual Museum Simulation Platform Based on 2.5D Architectural Modeling Technology
- The Value Insistence of the Cultural Production in the Big Data Era
- Sino-Australian Agricultural Product Trade Development in the Context of the Belt and Road Initiative
