Vegetation Coverage Changes in the West Qinling Region from 2000 to 2010: A Case Study of Longnan City
, , ,*,
1. Key Laboratory of Regional Sustainable Development Modeling, CAS, Beijing 100101, China; 2. University of Chinese Academy of Sciences, Beijing 100049, China; 3. Institute of Geographic Sciences and Resources Research, CAS, Beijing 100101, China
1 Introduction
Vegetation coverage, vegetation activity and its evolution have long been the main content of the earth’s terrestrial ecosystems research. In recent years, by understanding the effect of atmosphere, land use and climate change on vegetation, the response of vegetation to global climate change has been studied worldwide[1-3]. In the area of sustainable development, through the knowledge about the change in regional vegetation coverage and vegetation activity, the effect of human activities on vegetation ecosystem is analyzed[4]. Over the past 20 years, different combinations of red bands and infrared bands concerning remote sensing data have been used for vegetation studies, achieving good results[5-6]. Among numerous vegetation indices, NDVI (Normalized Differential Vegetation Index) is most widely used, and there is a lot of literature on the spatial and temporal characteristics of vegetation change in different areas as well as its relation to climate and human activities[7-10]. It is found that NDVI is significantly correlated with natural climatic factors (such as rainfall and temperature) or human activities (such as urban development and conversion of degraded farmland into forest)[11-14]. In the current study, Cui Xiaolinetal. use the NDVI data during 2000-2009 to study the vegetation index change in the East Qinling region, and find that the vegetation coverage was increasing year by year. There are also some other studies involving some areas of the Qinling Mountains, and it is concluded that the mountain vegetation in Longnan City is increasing[16]. This article focuses on the West Qinling region represented by Longnan City, so Longnan is chosen as the study area. Since 1999, through a series of ecological projects, the afforestation area has reached 453300 ha, 82400 ha of farmland has been converted into forest, and the city’s forest coverage rate has increased from 38.9% to 42%. In this study, we analyze the spatial and temporal characteristics of vegetation coverage change, in order to provide the basis for verification of ecological construction effectiveness since the late 20th century, and provide the reference for local ecological construction and sustainable development.
2 Overview of the study area
Longnan is a prefecture-level city in the southeast of Gansu province in the People’s Republic of China. It borders Sichuan on its south and Shaanxi on its east. The major geographic features in Longnan are the Qinba Mountains in the east, the Loess Plateau in the north, and the Tibetan Plateau in the west. It is part of the Central Han basin in the east and the Sichuan basin in the south. Longnan has a temperate, monsoon-influenced semi-arid climate, with cool and very dry winters and hot, moderately humid summers. Longnan City, with a total land area of 27 900 km2, has a significant vertical climate, and the altitude ranges from 550 m to 4187 m (Fig. 1). The area with slope of more than 25° accounts for 43% of the land area[17]. According to the data of Longnan Municipal Bureau of Land and Resources, nearly two-thirds of the city’s land use types are woodland and grassland. Woodland, grassland, farmland and garden plot, construction land, waters, and other land types, account for 49.67%, 14.98%, 20.48%, 1.66%, 1.05% and 12.15%, respectively. Farmland is mainly in the eastern Huicheng Basin and the northern Xili Basin, as well as the Bailongjiang River valley in Wudu District and Baishuijiang River valley in Wen County (Fig. 1).
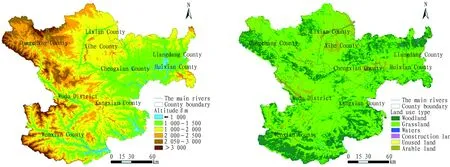
Fig.1ThetopographicmapandlandusemapinLongnanCity
3 Data sources and research methods
3.1DatasourcesThe NDVI data are mainly used for vegetation coverage change analysis, and the data are from the MODIS synthetic products of International Scientific & Technical Data Service Platform, Computer Network Information Center, CAS. We extract the 1 km grid monthly NDVI synthetic product based on Terra satellite during 2000-2010, this product takes the monthly maximum as the monthly actual value, and the coordinate system is WGS84. Given that summer and autumn are the seasons when the vegetation is full of activity, the NDVI value during June-October is chosen as the background data, and in the ARCGIS software support, the NDVI maximum during June-October is taken as the annual investigation value of NDVI. The auxiliary analysis data include topographic map (ASTER GDEM DEM data provided by International Scientific & Technical Data Service Platform, Computer Network Information Center, CAS) and land use raster data (2000 remote sensing data provided by CAS); meteorological data (from 2000-2010 temperature and precipitation data in Wudu monitoring station, provided by China Meteorological Administration); statistical data (from field research data and statistical yearbook data).
3.2Researchmethods
3.2.1Vegetation coverage. The vegetation coverage is calculated using dimidiate pixel model[18-20]which is a simple and practical remote sensing estimation model. The principle is to assume that the surface cover of an image pixel is divided into vegetation part and non-vegetation part. The spectral information observed by remote sensors is the weighted linear combination of the two parts of elements, and the weight is the area proportion of the two elements. The area proportion of vegetation element is the weight of vegetation part in pixel. Therefore, the area proportion of vegetation is calculated as follows[21-22]:
Pveg=(S-Ssoil)/(Sveg-Ssoil)
(1)
wherePvegis the area proportion of vegetation in the observation area;Sis the remote sensing value of mixed pixel;Svegis the remote sensing information value of complete vegetation coverage pixel;Ssoilis the remote sensing information value of complete non-vegetation coverage pixel.
With the annual NDVI value during 2000-2010 as remote sensing information value, the vegetation coverage area proportion estimated using remote sensing is defined as vegetation coverage (VC). According to the above principle,VCis calculated as follows:
VC=(NDVI-NDVIsoil)/(NDVIveg-NDVIsoil)
(2)
whereNDVIis the actual value of pixel;NDVIvegis the remote sensing information value of complete vegetation coverage pixel;NDVIsoilis the remote sensing information value of complete non-vegetation coverage pixel.
Due to the interaction between different ground objects, the image will inevitably have noise, so the maximum and minimum values of image are not directly taken in actual study, and a certain confidence interval is set to take the maximum and minimum values of confidence interval. Under normal circumstances, if there are no sufficient field observation sampling point data, the confidence interval is usually set at 5%-95%[23]. Therefore, with 5% cumulative distribution value ofNDVIpixel as the minimum value ofNDVIin pixel,VClower than this value takes 0; with 95% cumulative distribution value ofNDVIpixel as the maximum value in pixel,VChigher than this value takes 1; other values are calculated using formula (1). The final results are obtained using reclassify module andrastercalculatormodule of ARCGIS.
3.2.2Simple linear regression. The simple linear regression is mainly used to measureVCtrends over time[24-26]. TheVCtrends of a single pixel over time are used to simulate the spatial change inVCof the entire area, and the slope of the regression equation is the main parameter forVCchange over time. It is calculated as follows:
(3)
whereVCslpis the slope of the equation;i,nis the annual number ofVCsince 2000, a total of 11 years,i∈(1, 11),n=11.
IfVCslp>0,VCis on the rise, and vegetation activity intensity is great; ifVCslp<0,VCshows a downward trend, and the vegetation activity intensity significantly declines.
3.2.3Standard deviation. Standard deviation is mainly used to measure the degree of dispersion or variation ofVCpixel value in different years. This paper also combines standard deviation withVCslpchange for spatial and temporal analysis. The former indicates the degree of change inVCwhile the latter represents the direction of change. In this study, the standard deviation is calculated using cell statistics module in ARCGIS spatial analysis tool, and the specific results are obtained by choosing the standard deviation output format ofVCduring 2000-2010.
4 Analysis of vegetation coverage change
4.1Time-seriescharacteristicsofglobalvegetationcoveragechangeUsing dimidiate pixel model,VCin Longnan City (2000-2010) is calculated, and the change inVCover time is analyzed. Fig. 2 shows that since 2000, Longnan’sVCtrend line has been relatively stable, andVChas fluctuated around 0.64 and stabilized in recent years.
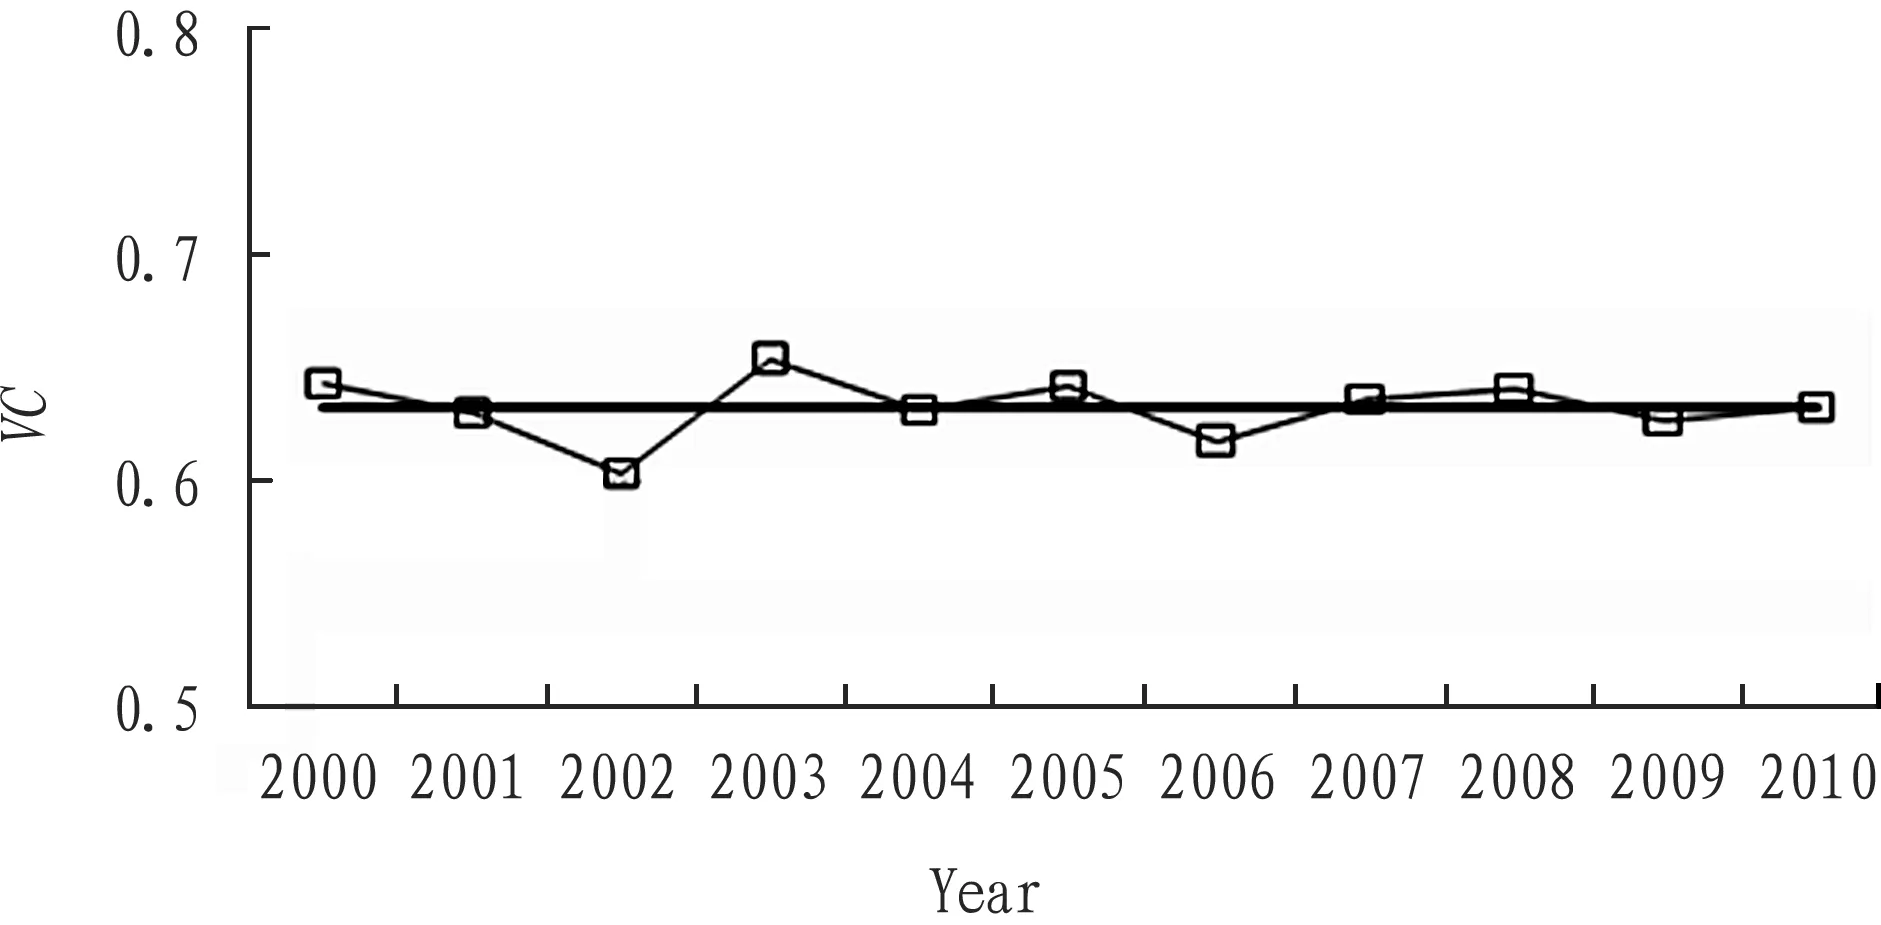
Fig.2Time-serieschangeofVCinLongnanCity
4.2Spatialdifferenceinvegetationcoveragechange
4.2.1Classification of change. The vegetation change has the threshold range of natural change, so for the judgment ofVCslptrends, we first need to determine the threshold range of natural variation. Now there are basically two methods. One is to choose the training area withVCof 0, and observe the range ofVCchange. According to the domestic scholars’ studies in the Tibetan Plateau[27],[-0.2, 0.2]is the range of natural vegetation changes. The other method is to rely on statistical analysis, such as using Jenks’ natural breaks to determine the sample natural breaks[24]. Longnan City is located in the upper reaches of the river, and river has linear features. There are no large lakes, unable to meet the accuracy requirements of the training area. The urban construction land area is small in Longnan, the greening coverage has increased little amid urban expansion in recent years, and the maximum area in the land use map reaches 2 km2. In this paper, we use the first method to take the urban construction land as training area. According to the analysis on characteristic value aboutVCslope raster data of construction land in 2010 land use data, it is found thatVCis between -0.0271 and 0.01861, equivalent to the range determined using the first method, so this change is as the relatively stable threshold range ofVCchange. Table 1 shows that over the past decade,VCtrend has been relatively stable in nearly 90% of regions;VChas presented an upward trend in 10% of regions (2563.23 km2);VChas presented a downward trend in 1.33% of regions (372.08 km2). Fig. 3 shows that the regions with an increasing trend ofVCare mainly distributed in the north-central Loess Plateau landform region, and these regions are concentrated in Huicheng Basin, Xili Basin, and the Bailongjiang River valley adret slope area of Wudu District. The land use type in these regions mainly includes farmland and grassland, which to a certain extent confirms the significant contribution of Project about the Conversion of Degraded Farmland into Forest toVCincrease. The regions with a downward trend ofVCinclude the valley area in Wen County (especially the upper reaches of Baishuijiang River), and the regions between Xihe County and Dangchang County.
Table1VCtrendclassification

TrendThresholdrangePixelnumberActualarea//km2Areaproportion∥%Stabletrend-0.0271-0.018616951124964.6989.48Upwardtrend0.01861-0.084671372563.239.19Downwardtrend-0.0989--0.02711036372.081.33
Table2StandarddeviationclassificationofVCchange

StandarddeviationthresholdrangeRasternumberArea∥km2Areaproportion∥%0-0.08023782313584.0348.690.0802-0.14142921510492.4937.610.1414-0.3717106463823.4813.70
4.2.2Annual fluctuations in trend. Using Jenks’ natural breaks method, theVCstandard deviation is divided into three levels, and the results are shown in Table 2, Fig. 4. Table 2 shows that the maximum value of standard deviation is 0.3717, and in the regions with large standard deviation (0.1414-0.3717), there are 10646 raster units, and the area accounts for 13.70%; in the regions with small standard deviation (0-0.0802), the area accounts for nearly half of the entire region, indicating that the change inVCis not large for most areas. Fig. 4 shows that the spatial distribution trend of standard deviation is similar to that of slope, and the regions with great standard deviation are mainly distributed in regions with great change in slope, such as Huicheng Basin, Xili Basin, and both sides of Bailongjiang River and Baishuijiang River, and they are mainly the farmland and grassland areas.

Fig.3SpatialdistributionofVCupwardanddownwardtrend
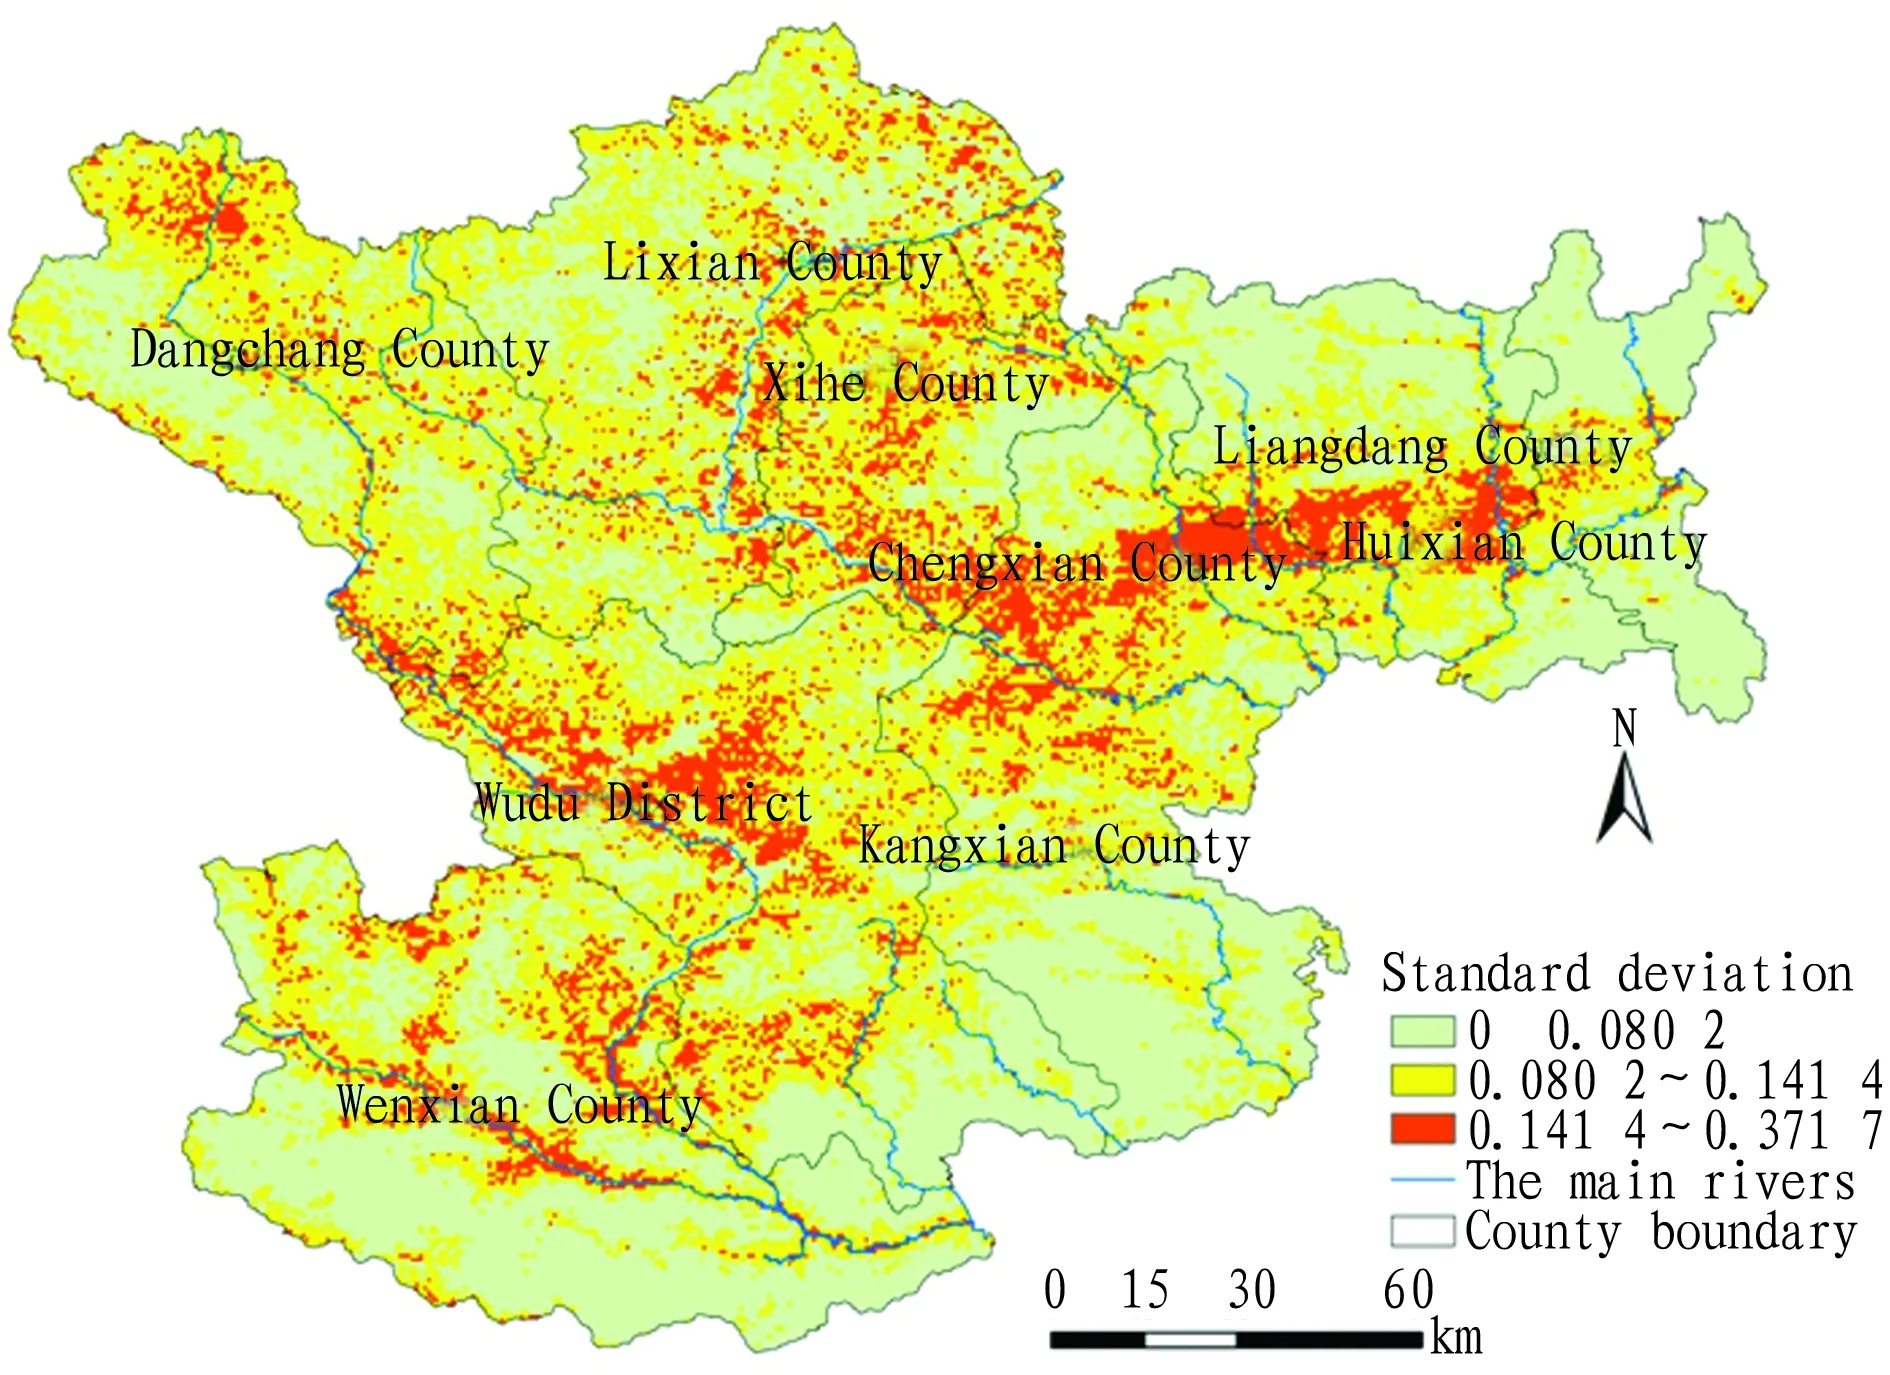
Fig.4StandarddeviationdistributionofVCchange
4.2.3Spatial and temporal combination analysis of trends. According to the classification results in Table 3, the standard deviation range is further divided into two categories. The raster computing module of ARCGIS is used to conduct the slope and standard deviation combination classification onVCchange, and six categories of regions are finally obtained. If the standard deviation is small, the interannualVCchange in pixel is small, andVCis in steady improvement, stabilization or degradation trends; if the standard deviation is large, the interannualVCchange in pixel is large, andVCis in sharp fluctuation improvement, stabilization or degradation trends. Table 3 shows that the study area is generally in a stable situation of smallVCchange; the regions with improvedVCand big change can be regarded as the regions with significant ecological benefits, accounting for 5.86% of the study area; only a few regions are in the degraded state of large-scale fluctuations inVC. Fig. 5 shows that for the regions with stable slope trend, the regions with small standard deviation mostly show the continuous planar distribution, while the regions with large standard deviation mostly show sporadic dot or stripe distribution; for the regions with a rising trend, the regions with large standard deviation mostly show continuous planar distribution, while the regions with small standard deviation mostly show sporadic dot distribution.
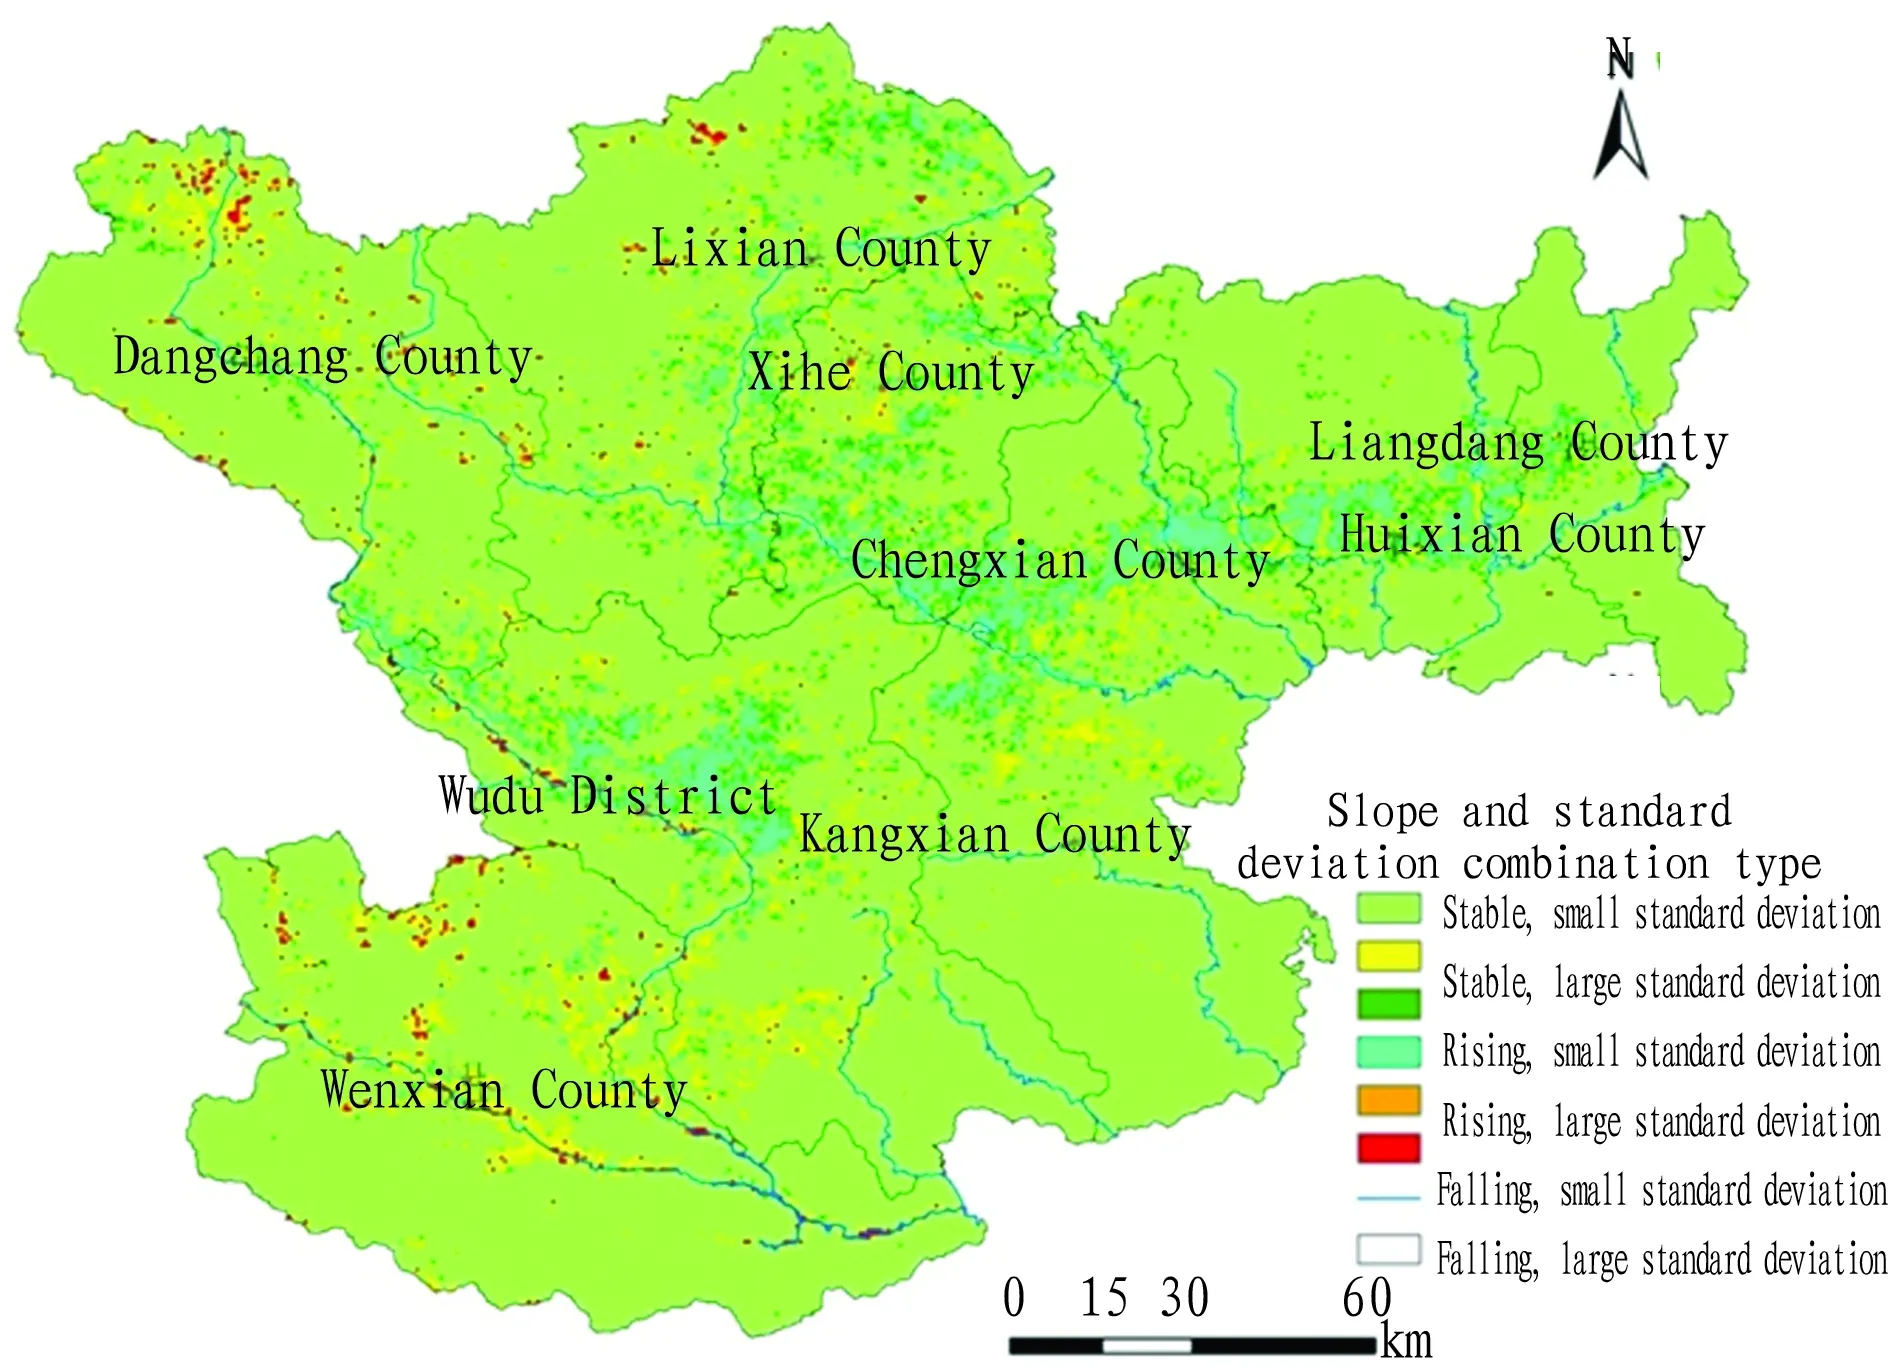
Fig.5SpatialclassificationofVCchangeinLongnanCityduring2000-2010
Table3SpatialclassificationofVCchange

StandarddeviationSlopeLargestandarddeviation(0.1414-0.3717)PixelnumberArea//km2Proportion//%Smallstandarddeviation(0-0.1414)PixelnumberArea//km2Proportion//%Stable54011939.756.956411023024.9382.53Rising45561636.285.862581926.963.32Falling689247.450.89347124.620.45Total106463823.4813.706703824076.5286.30
4.3AnalysisofthefactorsinfluencingVCchangeDuring 2000-2010, there were great interannual fluctuations in precipitation and temperature in Longnan City. From the relationship betweenVCand characteristic value change of climatic factors, it is found thatVCis significantly negatively correlated with the average temperature over the same period in Longnan City, while it is significantly positively correlated with precipitation. Temperature and precipitation changes contribute 54.7% and 43.5% toVCchange, respectively. Numerous studies have demonstrated thatVCis not only affected by precipitation, temperature and other environmental factors, but also affected by human activities, such as Project about the Conversion of Degraded Farmland into Forest and Natural Forest Protection Project[28-31]. In the above regions with improvedVC, Huicheng Basin, Xili Basin and adret slope of Bailongjiang River Valley in Wudu District are the regions that vigorously implement Project about the Conversion of Degraded Farmland into Forest in Longnan City, so the factors influencingVCchange in Longnan City can be summarized as climatic factor change and Project about the Conversion of Degraded Farmland into Forest.
5 Conclusions and discussions
(i) Since 2000, the overallVCchange has been relatively stable in Longnan City. Time series analysis shows thatNDVIpresents an overall upward trend, whileVCis relatively stable.VCchange is highly correlated with the average temperature and precipitation from June to August, indicating that Longnan’s temperature and precipitation change has a great impact onVC. (ii) The spatial variation ofVCis basically consistent with the analysis results of time series. TheVCof 90% of study area shows stability while theVCin the remaining study areas shows a growing trend. From the spatial change, the regions with a rising trend mostly show continuous planar distribution, while the regions with a downward trend mostly show sporadic dot distribution. From the interannual change, for the regions with significantly rising or falling trend ofVC, there are great fluctuations inVC, and the spatial distribution is basically consistent with farmland, grassland distribution; for the regions with relative stableVCchange, there are small fluctuations inVC, and the spatial distribution is basically consistent with woodland distribution; the regions with a rising trend ofVCare mainly in Huicheng Basin, Xili Basin and adret slope of Bailongjiang River Valley, indicating that Project about the Conversion of Degraded Farmland into Forest has made a great contribution toVCincrease. (iii)NDVIplays a significant role in revealing theVCchange in the study area, but due to significant vertical vegetation differentiation, there are great spatial and temporal differences in vegetation with climate change. Currently, the time and space resolution of data employed is still insufficient, which increases the uncertainty of the study results. It needs to be supplemented in the future in-depth study. In addition, the human activity characterization, and especially the explanation of reasons forVCincrease since the implementation of Project about the Conversion of Degraded Farmland into Forest, need more detailed field researches to further enrich the content.
[1] PIAO SL, FANG JY. Seasonal changes in vegetation activity in response to climate changes in China between 1982 and 1999 [J]. Acta Geographica Sinica,2003,58(1): 119-125. (in Chinese).
[2] CRAMER WP. LEEMANS R. Assessing impacts of climate change on vegetation using climate classification system [M]. In: Solomon A M, Shugart H H (eds.), Vegetation Dynamics and Global Change. London: Chapman and Hall, 1993: 190-217.
[3] ZHOU GS, WANG YH. Study and prospect on global change and climate-vegetation classification [J].Chinese Science Bulletin,1999,24(44):2587-2593. (in Chinese).
[4] LI SS, YAN JP, WAN J. The spatial-temporal changes of vegetation restoration on Loess Plateau in Shaanxi-Gansu-Ningxia Region[J].Acta Geographica Sinica,2012,67(7): 960-970. (in Chinese).
[5] TIAN QJ, YTAN XJ. Advances in study on vegetation indices [J]. Advances in Earth Sciences,1998,13(4):327-333. (in Chinese).
[6] JIA K, YAO YJ, WEI XQ,etal. A review on fractional vegetation cover estimation using remote sensing [J].Advances in Earth Science,2013,28(7):774-782. (in Chinese).
[7] WEI ZF, WANG DG, ZHANG C,etal. Spatio-temporal variation of vegetation phenology on Loess Plateau in Shaanxi-Gansu-Ningxia Region in recent 12 years [J]. Rural Eco-Environment, 2014,30 (4):423-429. (in Chinese).
[8] ZHANG W, ZHANG YL, WANG ZF,etal. Analysis of vegetation change in Mt. Qomolangma Natural Reserver [J]. Progress in Geography,2006,25(3):12 -21. (in Chinese).
[9] HAN XZ, LI SM, LUO JN,etal. Study on spatiotemporal change of vegetation in China since 20 years [J]. Arid Zone Research,2008,25(6):753-759. (in Chinese).
[10] SUN YL, GUO P, YAN XD,etal. Dynamics of vegetation cover and its relationship with climate change and human activities in Inner Mongolia [J]. Journal of Natural Resources,2010,25 (3): 407-414. (in Chinese).
[11] ZHENG YF, LIU HJ, WU RJ,etal. Correlation between NDVI and principal climate factors in Guizhou Province [J]. Journal of Ecology and Rural Environment, 2009,25 (1):12-17. (in Chinese).
[12] XU XK, CHEN H, LEVY JK. The temporal and spatial variation of vegetation cover in Tibetan Plateau under the background of climate warming and its cause analysis [J].Chinese Science Bulletin,2008,53(4):456-462. (in Chinese).
[13] WANG J, GUO N, CAI DH,etal. The effect evaluation of the program of restoring grazing to grasslands in Maqu County [J].Acta Ecologica Sinica, 2009,29(3):1276-1284. (in Chinese).
[14] ZHOU HJ, WANG JA, YUE YJ,etal. Research on spatial pattern of human-induced vegetation degradation and restoration: a case study of Shaanxi Province [J]. Acta Ecologica Sinica,2009,29(9):4847-4856. (in Chinese).
[15] CUI XL, BAI HY, WANG T. Difference in NDVI with altitudinal gradient and temperature in Qinling area [J].Resources Science,2013,35(3): 618-626. (in Chinese).
[16] YANG SW, ZHANG B, ZHAO YF,etal. Spatial and temporal variation of NDVI in the Hedong region of Gansu Province during the period of 1998 to 2011 [J]. Arid Zone Research,2014,31(1):74-79. (in Chinese).
[17] CHEN X, ZHU SS, LI QQ,etal. The effect of peasant household livelihood changes on ecological civilization construction in Western Qinling Area-Longnan of Gansu [J].Journal of Mountain Research,2014,32(6):662-670. (in Chinese).
[18] LEPRIEURC, VERSTRAETE MM, PINTY B. Evaluation of the performance of various vegetation indices to retrieve vegetation cover from AVHRR data [J]. Remote Sensing Review, 1994, (10): 265-284.
[19] CHEN J, CHEN YH, HE CY,etal. Sub-pixel model for vegetation fraction estimation based on land cover classification [J].Journal of Remote Sensing,2001,5(6): 416-422. (in Chinese).
[20] ZRIBI M, LEHE GARAT-MASCLE S, TACONET O,etal. Derivation of wild vegetation cover density in semi-arid regions:ERS2/SAR evaluation [J]. International Journal of Remote Sensing, 2003, (24): 1335-1352.
[21] LIU GF, WU B, FAN WY,etal. Extraction of vegetation coverage in desertification regions based on the Dimidiate Pixel Model-A case study in Maowusu Sandland [J].Research of Soil and Water Conservation,2007,14(2): 268-271. (in Chinese).
[22] GUO FF, FAN JR, YAN D,etal. Remote sensing estimation on vegetation coverage of Changdu County based on Dimidiate Pixel Model [J]. Soil and Water Conservation in China, 2010,(5): 65-67. (in Chinese).
[23] LI MM, WU BF, YAN CZ,etal. Estimation of vegetation fraction in the upper basin of Miyun Reservoir by remote sensing [J]. Resources Science, 2004,26(4):153-159. (in Chinese).
[24] YU BH, LV CH, LV TT,etal. Regional differentiation of vegetation change in the Qinghai-Tibet Plateau [J].Progress in Geography,2009,28(3), 391-397. (in Chinese).
[25] LIANG SH, CHEN J, JIN XM,etal. Regularity of vegetation coverage changes in the Tibetan Plateau over the last 21 years [J].Advances in Earth Sciences,2007,22(1): 33-40. (in Chinese).
[26] MA MG, WANG J, WANG XM. Advance in the inter-annual variability of vegetation and its relation to climate based on remote sensing [J].Journal of Remote Sensing,2006,10(3): 421-431. (in Chinese).
[27] DING MJ, ZHANG YL, SHEN ZX,etal. Land cover change along the Qinghai Tibet Highway and Railway from 1981 to 2001 [J]. Journal of Geographical Sciences, 2006, 16(4): 387-395.
[28] LIAO QF, ZHANG X, MA Q,etal. Spatiotemporal variation of fractional vegetation cover and remote sensing monitoring in the eastern agricultural region of Qinghai Province [J].Acta Ecologica Sinica,2014,34(20): 5936-5943. (in Chinese).
[29] SUN ZH, CAO XM, LI XY,etal. Effect of climate change and human activities on soil erosion in Wuqi [J].Research of Soil and Water Conservation,2009,16(6): 30-34,39. (in Chinese).
[30] TIAN HJ, CAO CX, DAI SM,etal. Analysis of vegetation fractional cover in Jungar Banner based on time-series remote sensing data [J].Geo-information Science,2014, 16(1):126-133. (in Chinese).
[31] GAO YJ, XIE YC, QIAN DW,etal. Dynamic variations of vegetation coverage and landscape pattern in Bailongjiang Basin of Southern Gansu [J].Research of Soil and Water Conservation, 2015, 22(1): 181-187. (in Chinese).
 Asian Agricultural Research2016年8期
- Asian Agricultural Research的其它文章
- On the Government’s Responsibility in China’s Rural Land Transfer
- Is the Farmland of China Sufficient?
——Analysis Based on the Second National Land Survey - Research on Management Mode of Small-scale Irrigation Works for Farmland Based on Self-governance
- Industrial Upgrade, Vocational Ability and Migrant Worker Education and Training
- A Study of Soil Nutrients in the Terrace Field Changed from Mountain Slope in Three Gorges Reservoir Region
- Influence of Transplantation in Different Stage on Growth and Yield of Spring Maize in Shanxi Early Mature Area
