Is It Worthwhile for Farmers to Grow Grain?—A Study of Farmers’ Behavior of Growing Grain
,
1.College of Economics and Management, China Agricultural University, Beijing 100083, China; 2. College of Economics and Management,Shanxi Agricultural University,Taigu 030801, China
1 Introduction
Only after the income from growing grain is ensured can farmers’ enthusiasm for growing grain be mobilized, and continued growth of food production be possible. However, in recent years, rising labor costs and increased production material prices have caused the grain growing costs to skyrocket; constrained by international food market price "ceiling", the rise in China’s food prices is restricted, and the income from growing grain is constantly inhibited, leading to weak farmers’ willingness to grow grain. On the basis ofAgriculturalCostYearbook(2001-2013), this paper estimates farmers’ income from growing grain, and compares the profit margin of farmers’ planting of food crops and non-food crops, grain growing and breeding, as well as the daily return of grain growing and working outside during 2001-2013, in order to find an effective way to improve farmers’ income from growing grain, thus ensuring food security. The literature on whether it is worthwhile for farmers to grow grain is mainly based on the analysis and computing of cost-benefit data inStatisticalYearbook, to measure the profit margin from growing grain and engaging in other productive activities, so as to judge whether farmers’ behavior of growing grain pays off. There are two diverging views on this issue in the existing literature. Most scholars believe that farmers’ behavior of growing grain does not pay, because the income from growing grain is so low. Ma Xiaohe (2011) analyzes the changes in cost and benefit of China’s agricultural products during 1998-2011, and arrives at the conclusion that compared with other agricultural products, grain income is the lowest[1]. Li Shouhan (2015) uses the market price of employees to correct family labor expenses, compares the profit margin of food production and industrial production or non-grain planting, and finds that it is unprofitable in food production[2]. On the contrary, some scholars believe that farmers’ income from growing grain is not low. Taking farming for example, Tang Maohua (2011) uses profit margin to measure farmers’ comparative income, and results show that the agricultural comparative benefits are high under two costing frameworks, and there is a paradox of high agricultural comparative benefits but low farmers’ income in China[3]. In summary, it can be found that the current comparative study on farmers’ income from growing grain lacks a common premise: there is a need to consider the substitutability of growing grain and engaging in other industries. Based on previous studies and current situation of Chinese farmers, this paper selects some typical economic activities that can be as substitutes for growing grain, such as planting non-food crops, raising pigs, and working outside, and uses profit margin and daily wage indicators to compare farmers’ incomes, in order to get some meaningful conclusions.
2 Concept definition, analysis tools and data
2.1ConceptofruralhouseholdsRural household is the farmers’ family, a social unit formed based on marriage and kinship. In the early 1980s, China implemented the household contract responsibility system, and basically established the independent market position of rural households[4].
2.2Analysistool
2.2.1Profit margin. Profit Margin, or net profit ratio is a measure of profitability. It is calculated by finding the net profit as a percentage of the revenue. The profit margin is used mostly for internal comparison. It is difficult to accurately compare the net profit ratio for different entities. A low profit margin indicates a low margin of safety: higher risk that a decline in sales will erase profits and result in a net loss, or a negative margin. The higher the index, the greater the profits, the better the enterprises’ economic returns. The formula is as follows:
Profit margin (%)=(gross profit÷total cost)×100%
Rural households are production operators, and the formula can also apply to their production activities.
2.2.2Income per working day and daily wage. The income per working day refers to the remuneration of farmers’ family labor input to grain growing in each actual labor day. It is calculated as follows:
Income per working day=cash income per mu of farmland÷number of family labor days per mu of farmland
The daily wage of farmers is converted from their monthly wage from working outside based on the actual working days. According to the national average monthly wage of migrant workers and average number of working days in a month, the average daily wage for each year is calculated[1].
2.2.3Data sources. In this paper, the data on crop production costs and benefits are fromNationalAgriculturalCostsandReturnsCompilation; the monthly wage data about migrant workers from 2001 to 2007 are from Lu Feng’s articleChineseMigrantWorkers’WageTrends: 1979-2010; the monthly wage data about migrant workers from 2008 to 2013 are fromMonitoringandSurveyReportonChineseMigrantWorkers.
3 Farmers’ benefit from growing grain
3.1DecliningprofitsfromgrowinggrainDuring 2001-2013, the average total cost of rice, wheat and maize per mu rose from 350.61 yuan/mu to 1026.19 yuan/mu (Fig. 1), an increase of 1.87 times without considering the inflation factors[2], with the average annual growth rate of 9.19%. In the cost structure, labor costs and land costs showed the highest growth rate. During 2001-2013, the average yield of rice, wheat and maize increased from 356 kg/mu to 444.67 kg/mu, and the food output value increased from 366.65 yuan/mu to 1077.29 yuan/mu. During this period, the average selling price of rice, wheat and maize showed an overall increasing trend. The cash income from the production of the three kinds of food showed an overall upward trend during 2001-2012[3], but it declined in 2013, and the average cash income was only 625.34 yuan/mu, decreasing by 30 yuan/mu over the previous year. Overall, from farmers’ input-output on growing grain, it can be found that the cost of growing grain rose significantly faster than output value, but in terms of the trend of changes in profits, growing grain was profitable in the past 10 years. In recent years, the profit from growing grain has showed a gradual decline, and it was only 73 yuan/mu in 2013, about migrant workers’ wage in 1-2 days. Therefore, the prospect of China’s food still needs special attention.
3.2Cost-benefitcomparisonoffoodandnon-foodcropsFrom the average profit margin during 2009-2013, it is found that the profit margin of rice, wheat and maize, soybeans, cotton, rapeseed and tobacco was relatively low, much lower than that of apples, vegetables, peanuts and sugarcane (Fig. 2). Vegetables, apples and other horticultural products have high profit margin and also high costs. Taking vegetables for example, the cost of vegetables is much higher than that of rice, wheat and maize, and the profit margin of vegetables is also higher than that of food. In 2013, the total cost of vegetables was 4050.94 yuan/mu, while the total cost of rice, wheat and maize was only 1151.11 yuan/mu, 914.71 yuan/mu and 1012.04 yuan/mu, respectively, only 28.42%, 22.58% and 24.98% of the total cost of vegetables, respectively; the profit margin of vegetables was 70.41%, while the profit margin of rice, wheat and maize was only 13.45%, -1.4% and 7.66%, respectively. In the same context of high cost, the high-income and high-return crop will become the primary choice of some producers or operators (particularly the farmers with sufficient funds).
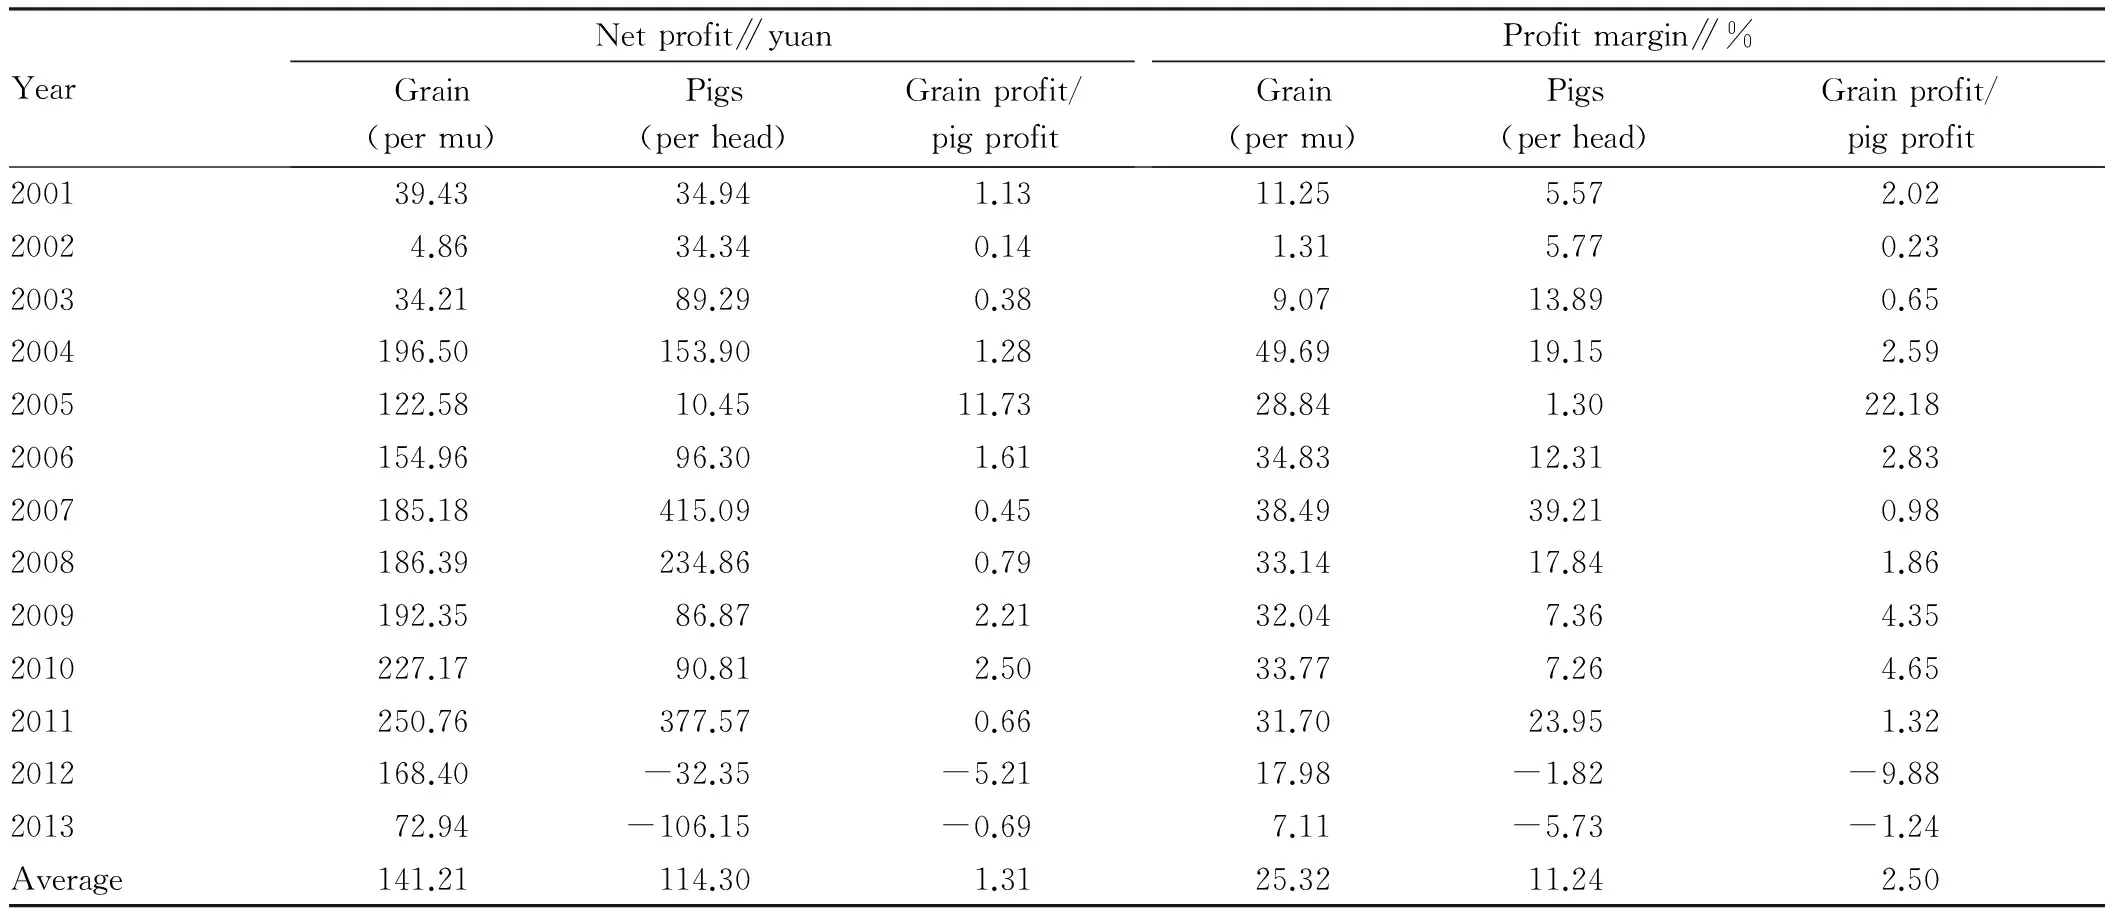
3.3FoodproductionandpigbreedingChina’s pig breeding has different modes such as large-scale breeding and dispersed breeding, and from the point of view of comparability, we take the dispersed pig breeding for example to analyze (Fig. 3 and Table 1). We can see that the grain growing profit was higher than the pig breeding profit in most years[4]. During 2001-2013, the grain growing profit was 141.21 yuan/mu while the pig breeding profit was 114.3 yuan/head. Due to low grain growing costs, the profit margin of growing grain is higher than that of breeding pig except for a few years. Especially in 2005, owing to the government’s food subsidies, the income from growing grain was improved greatly. The profit from growing grain was 122.58 yuan/mu while the profit from breeding pigs was only 10.45 yuan/head, with the profit margin of 28.84% and 1.3%, respectively. In 2012 and 2013, there was even a loss in breeding pigs, while the profit from growing grain was 168.4 yuan and 72.9 yuan, respectively. By comparing the two, it can also be found that the fluctuation in the profit from growing grain is much smaller than from breeding pigs, adequately reflecting lower risk of growing grain.
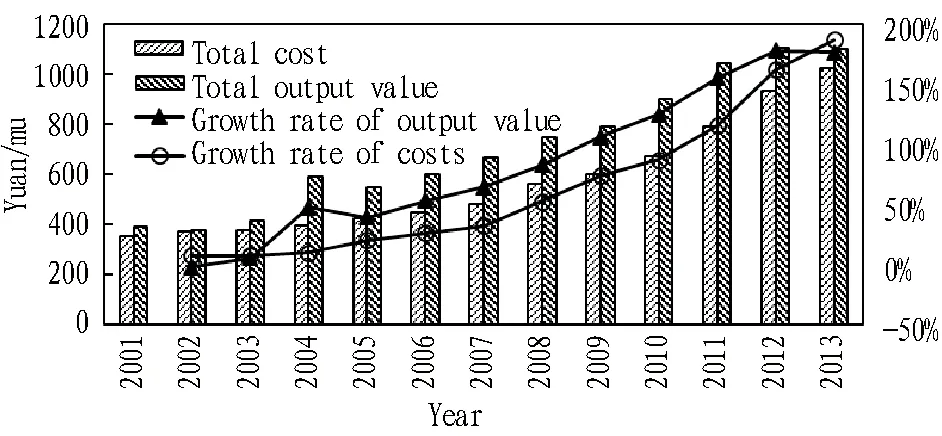
Data source: National Cost-Benefit Compilation of Agricultural Products released by National Development and Reform Commission.Fig.1 Total costs and total output value of China’s three kinds of food crops and their growth rate
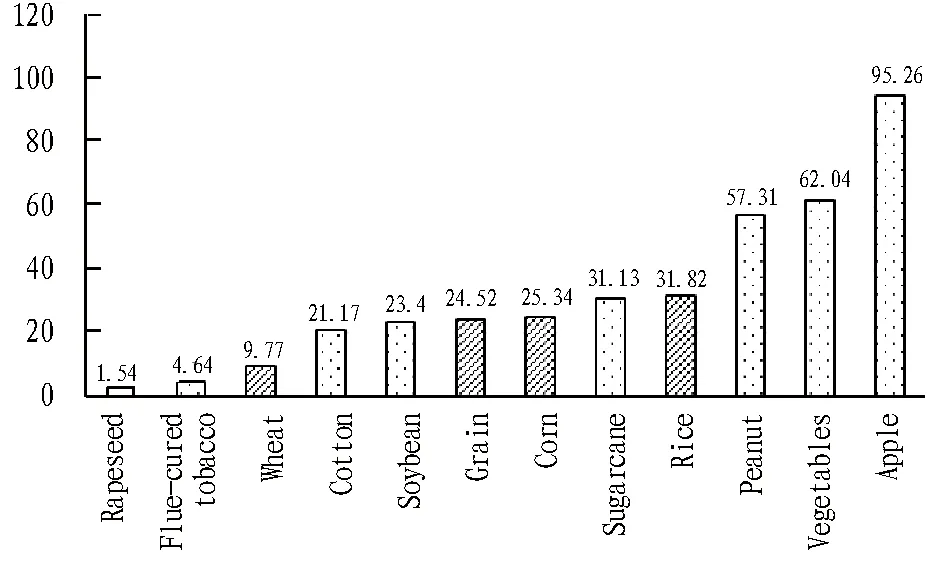
Note: The profit margin is the average of the past five years (2009-2013).Fig.2 Profit margin of food crops and typical non-food crops (%)
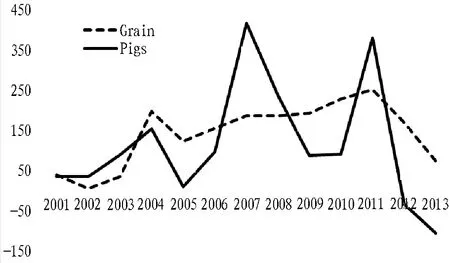
Fig.3 Profit of grain per mu and pigs (free range pigs) per head
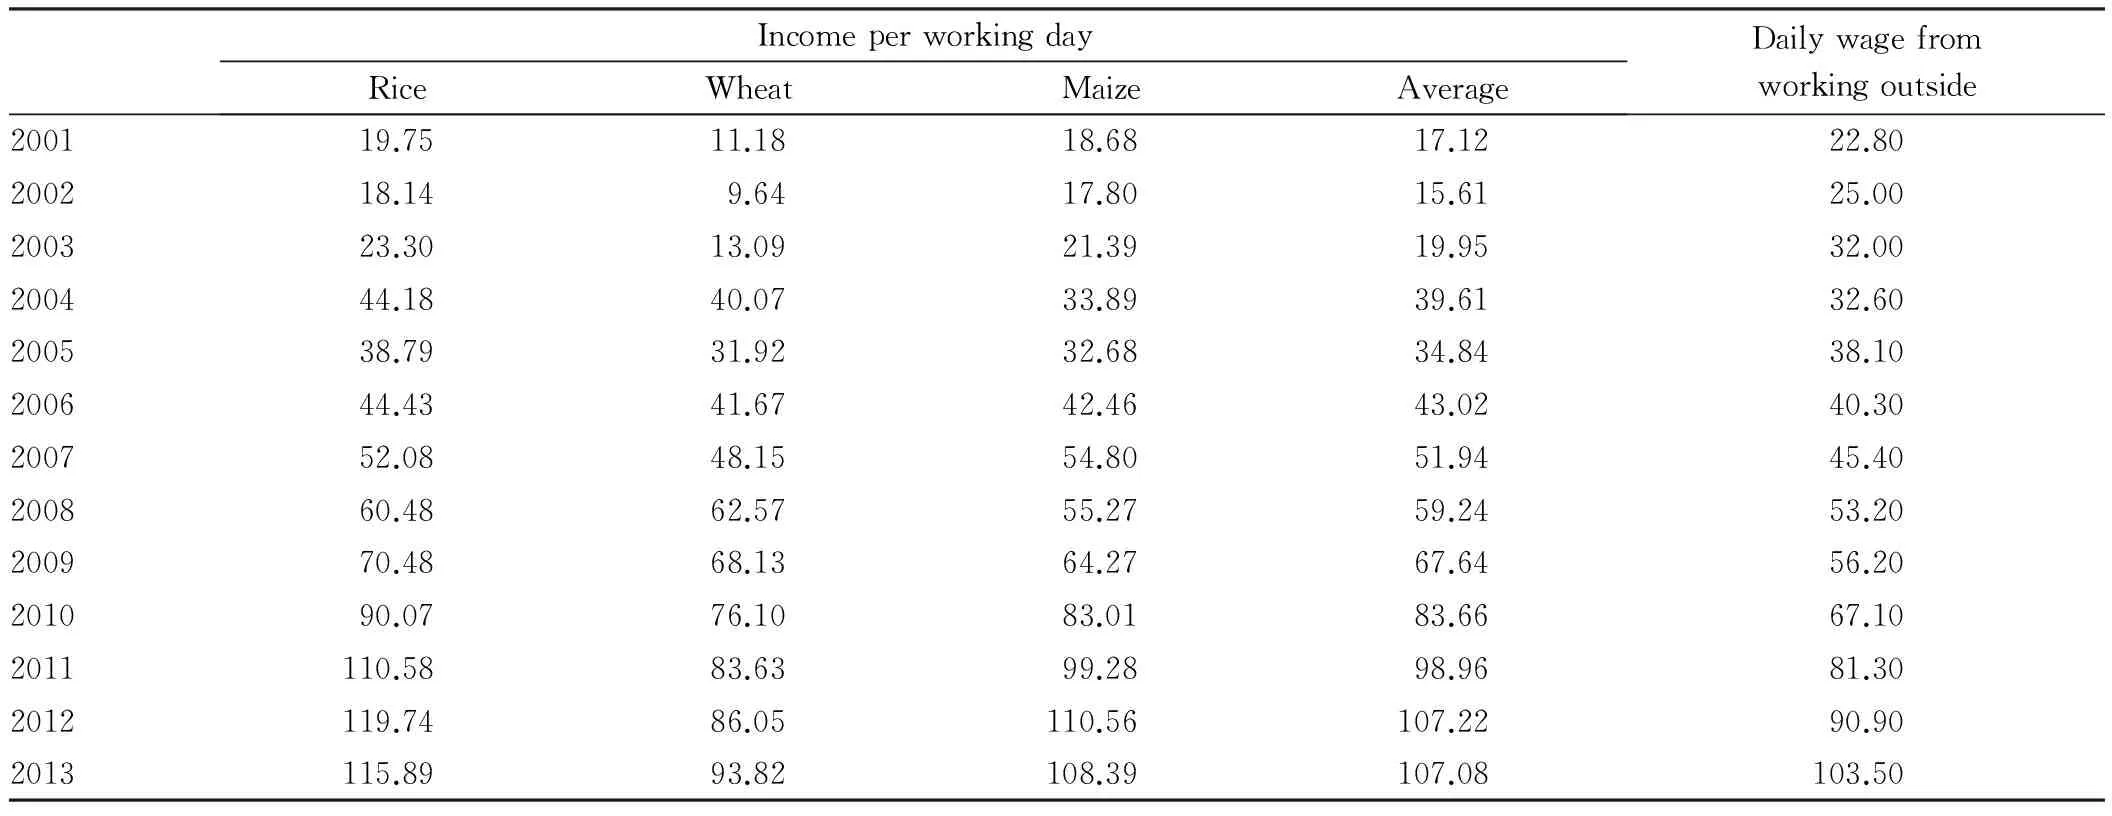
3.4ComparisonoflaborremunerationfromgrowinggrainandworkingoutsideFrom the point of view of labor, we analyze the income per working day from growing grain and daily wage from working outside. First, we convert the income from growing grain into daily income (namely income per working day), and then compare it with the daily wage from working outside. According to the national average monthly wage of migrant workers and the average number of working days in a month, we calculate the average daily wage for each year. We calculate the average income per working day from growing rice, wheat and maize during 2001-2013, and the daily wage from working outside, as shown in Table 2. It can be found that during 2001-2013, the average income per working day from growing three major food crops and migrant workers’ daily wage, showed a rising trend. The growth rate of migrant workers’ daily wage was relatively stable, and it was rapidly increased after 2009. In 2012, migrant workers’ daily wage exceeded the income per working day from growing wheat; in 2013, migrant workers’ daily wage was close to the average income per working day from growing three major food crops. Despite high income per working day in food production, it should be noted that such behavior of growing grain only lasts more than ten days or dozens of days, and it only averaged 8.23 days during 2001-2013, while the migrant workers’ wage income can be all the year around, so that the annual income of migrant workers is much higher than the income from growing grain. In 2013, the monthly wage of migrant workers was 2609 yuan, and the annual wage income was 31308 yuan, while the annual cash income from growing one mu of grain was 625.34 yuan. It can be calculated that farmers need to grow 50.07 mu of grain in order to get the income tantamount to the income from working outside, but limited by arable land scale and differences in quality of the population, it is clear that this wish is difficult to achieve, so more and more migrant workers choose to work elsewhere.
4 Effect of subsidies on farmers’ behavior of growing grain
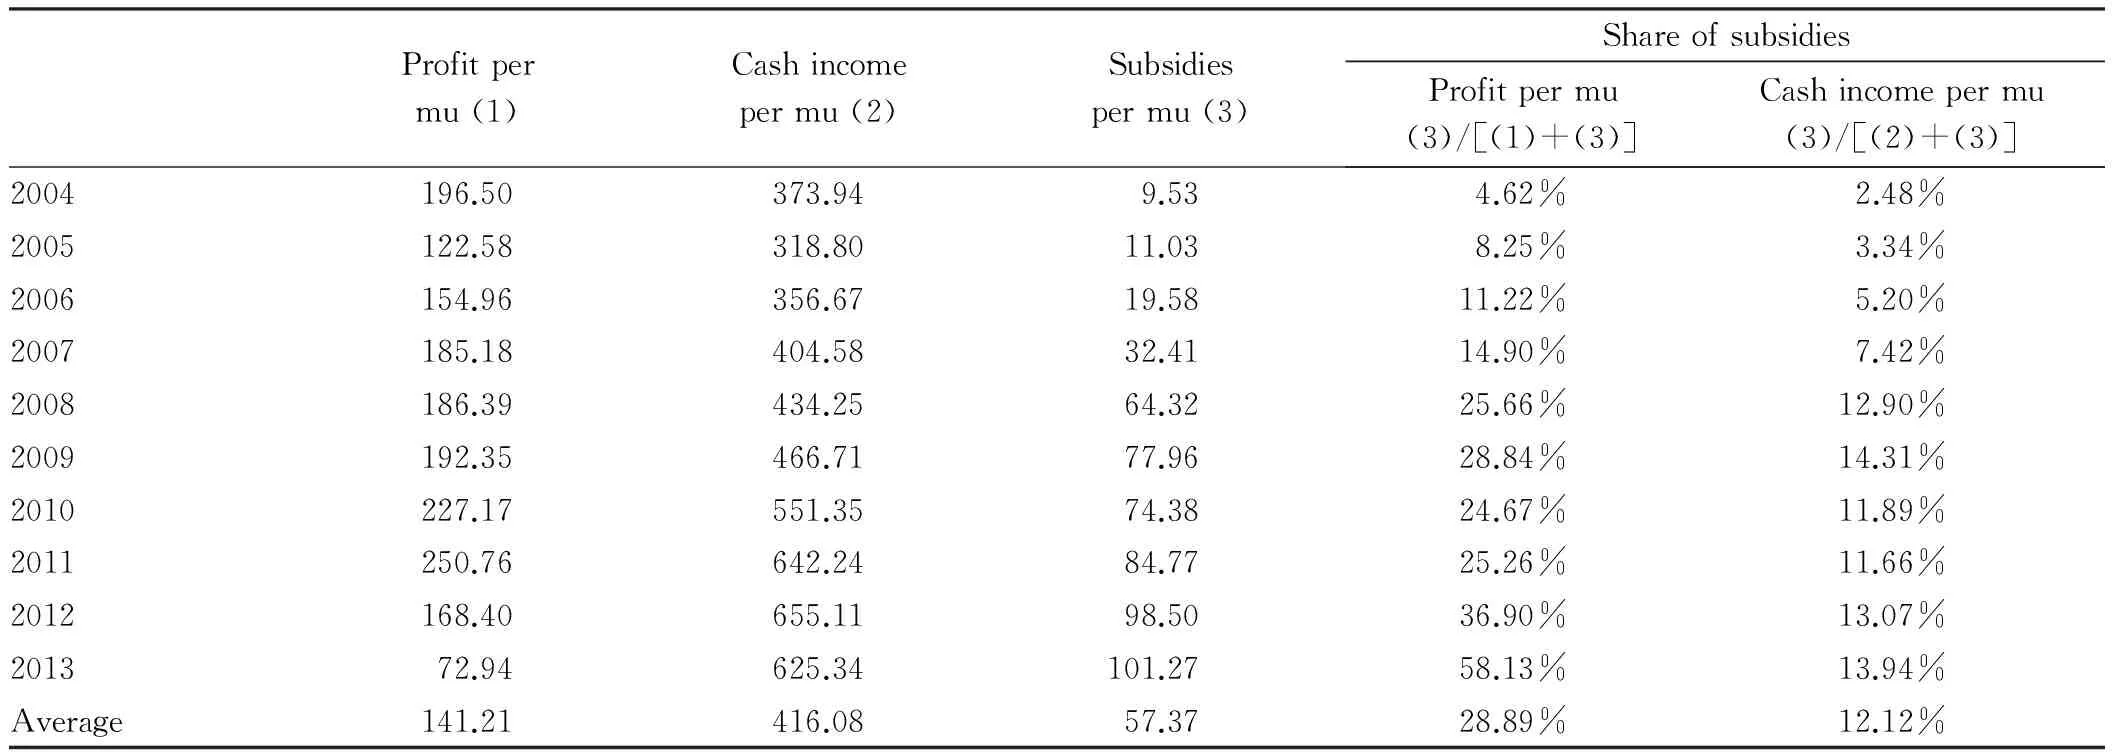
At present, China’s food subsidies mainly include direct food subsidies, improved seed subsidies, farm machinery purchase subsidies, and agricultural material subsidies. Since 2004, the four kinds of subsidies have increased year by year, from 14.52 billion yuan in 2004 to 170.06 billion yuan in 2013, an average annual increase of 31.44%. To examine the direct effects of subsidies on farmers’ behavior of growing grain, there is a need to analyze the contribution of subsidies to farmers’ income from growing grain. (i) In terms of the profit per mu, the share of subsidies per mu in income per mu (namely profit+subsidies) was 28.89% during 2004-2013 (Table 3), and due to increasing subsidies, the share of subsidies was even larger in some years with low profit per mu, and the subsidies were more important. In 2013, the share of subsidies reached 58.13%, well playing a role in ensuring income. (ii) In terms of cash income per mu, the share of subsidies in income per mu (cash income per mu+ subsidies) was 12.12% during 2004-2013, and the role of subsidies was even larger in some years with low food benefit, for example, this share reached 13.94% in 2013. Clearly, subsidies play an increasingly important role in farmers’ income or profit from growing grain, but share of subsidies in per capita net income of farmers is still relatively small (Table 3); since 2008, it has been maintained at about 3%; during 2004-2013, it averaged 2.34%. It can also indicates that the four food subsidies will not greatly improve farmers’ income, but the subsidies will greatly stimulate farmers’ food production.
5 Reasons for growing grain in China
Firstly, in terms of grain growing and other production and operation activities, the profit from growing grain is generally lower than from growing other non-food crops. At the same time, the profit from growing grain is lower than from breeding industry, but the risk is large for breeding industry. From the average level during 2001-2013, both the profit and profit margin in growing grain are were higher than in breeding pigs, and the profit margin of growing grain and breeding pigs was 25.32% and 11.24%, respectively. Obviously, the comparative benefit from growing grain is low. Secondly, we can see that if the farmers can find off-farm jobs outside, most of them will not choose to grow grain, because the income from growing one mu of grain in one year is equivalent to only 2.68 days of wage from working outside. Thus, a lot of rural young labor goes out to find job and is divorced from food production, and the number of rural young labor reached 270 million in 2013. Currently, the rural labor growing grain in China is mostly the elderly or women, because the opportunity cost of grain farmers is small, and they have few other choices other than growing grain. The reasons for farmers’ behavior of growing grain must be based on China’s food production practices. On the whole, there are economic and political factors that affect farmers’ choice of growing grain, and the majority of farmers’ affection for land and agriculture is also an important reason.
5.1CountrysidecomplexAs mentioned by Mr. Fei Xiaotong inFromtheSoil:theFoundationsofChineseSociety, land is the root of farmers, and especially for older farmers, they have deep affection for land and grain growing. Currently, this factor may well explain why those older farmers continue to grow grain even if there was a loss in growing grain in the previous year. It is also closely linked to the characteristics of grain growing, namely small investment, easy start, low demand for labor and easy management in food production.
5.2ImportantmeasuretoensurefoodsecurityIn addition to the profit or cash income, farmers’ total income from growing grain also includes government subsidies, and subsidies play an important role in encouraging farmers to grow grain. Without the support of the government’s subsidies, food production must suffer from a decline.
Table1Profitmarginofgraingrowingandpigbreeding
YearNetprofit∥yuanGrain(permu)Pigs(perhead)Grainprofit/pigprofitProfitmargin∥%Grain(permu)Pigs(perhead)Grainprofit/pigprofit200139.4334.941.1311.255.572.0220024.8634.340.141.315.770.23200334.2189.290.389.0713.890.652004196.50153.901.2849.6919.152.592005122.5810.4511.7328.841.3022.182006154.9696.301.6134.8312.312.832007185.18415.090.4538.4939.210.982008186.39234.860.7933.1417.841.862009192.3586.872.2132.047.364.352010227.1790.812.5033.777.264.652011250.76377.570.6631.7023.951.322012168.40-32.35-5.2117.98-1.82-9.88201372.94-106.15-0.697.11-5.73-1.24Average141.21114.301.3125.3211.242.50
Data source:NationalCost-BenefitCompilationofAgriculturalProductsreleased by National Development and Reform Commission; the weight of each free-range pig averages 110.27 kg.
Table2IncomeperworkingdayfromgrowingmajorfoodcropsanddailywagefromworkingoutsideUnit: yuan
IncomeperworkingdayRiceWheatMaizeAverageDailywagefromworkingoutside200119.7511.1818.6817.1222.80200218.149.6417.8015.6125.00200323.3013.0921.3919.9532.00200444.1840.0733.8939.6132.60200538.7931.9232.6834.8438.10200644.4341.6742.4643.0240.30200752.0848.1554.8051.9445.40200860.4862.5755.2759.2453.20200970.4868.1364.2767.6456.20201090.0776.1083.0183.6667.102011110.5883.6399.2898.9681.302012119.7486.05110.56107.2290.902013115.8993.82108.39107.08103.50
5.3ComparativebenefitofgrowinggrainAs described above, in terms of cash income from growing grain, farmers need to grow 50.07 mu of grain to get the income tantamount to that from working outside, but it is unrealistic in most areas. Thus, farmers’ behavior of growing grain does not maximize profits from the economic point of view, and there must be different constraints limiting farmers to engage in more profitable production and business activities.
5.4AlotofconstraintsIn addition to the above factors, farmers also face many helpless constraints when deciding to grow grain, including lack of physical strength, knowledge and techniques for working outside, insufficient risk tolerance capacity and start-up capital to engage in breeding or other industries, lack of product marketing capability in the cultivation of other crops. The government only offers great policy support to food production. Thus, even if the profit from growing grain is low, those cautious and risk-averse farmers, who lack conditions to engage in other activities, tend to prefer food production when there are government subsidies. Although the income is low, the risk is also low, and can be tolerated by farmers.
Table3SubsidiespermuandprofitorcashincomepermuUnit: yuan
Profitpermu(1)Cashincomepermu(2)Subsidiespermu(3)ShareofsubsidiesProfitpermu(3)/[(1)+(3)]Cashincomepermu(3)/[(2)+(3)]2004196.50373.949.534.62%2.48%2005122.58318.8011.038.25%3.34%2006154.96356.6719.5811.22%5.20%2007185.18404.5832.4114.90%7.42%2008186.39434.2564.3225.66%12.90%2009192.35466.7177.9628.84%14.31%2010227.17551.3574.3824.67%11.89%2011250.76642.2484.7725.26%11.66%2012168.40655.1198.5036.90%13.07%201372.94625.34101.2758.13%13.94%Average141.21416.0857.3728.89%12.12%
6 Policy recommendations
(i) In terms of grain yield, in view of current food security policy of "self-sufficiency of grain, absolute security of rations", there will be no great potential for internal grain planting structure adjustment in the future[5]. Therefore, China’s grain yields will be dependent on the increase in yield per unit area to a large extent. On the one hand, it is necessary to increase research efforts to develop improved varieties; on the other hand, the government should increase the amount of seed subsidies and encourage farmers to choose improved varieties, in order to enhancing the potential for increasing yield. All of these are inseparable from the financial support of the government. (ii) In terms of grain prices, on the one hand, it is necessary to raise grain prices. There is a need to increase income while increasing yield, and emphasize the variety and quality to raise prices. Increasing income from food production is an effective way to mobilize farmers’ enthusiasm for growing grain. Currently, it admits of no delay to improve the safety and quality of agricultural products, so as to raise prices and help improve the income of farmers. On the other hand, it is necessary to reduce the cost of growing grain; actively support the development of farmer cooperatives especially in the rural areas with women and the elderly primarily engaged in farming; strengthen land management rights transfer in areas where conditions permit; cultivate new agricultural production entities and achieve large-scale operation to reduce the cost of growing grain; vigorously develop mechanization to promote economies of scale. Finally, it is necessary to clarify the relationship between the government and the market. The government should dominate the the production of staple food (namely rice and wheat) which is related to national food security. Farmers should be the decision-making body in the market-oriented production of corn and soybean which is related to farmers’ income, and the government only needs to be responsible for guiding.
[1] LI SH, HE XR, YANG SG. Is the comparative benefit of Chinese food production low?[J]. Chinese Rural Economy, 2015(5): 10-12. (in Chinese).
[2] MA XH. Analysis on the structure of Chinese agricultural income and the change of production cost[J]. Chinese Rural Economy, 2011(5):4-11. (in Chinese).
[3] TANG MH, HUANG SA. Is the comparative benefit of agriculture low?[J]. Journal of Zhongnan University of Finance and Economics, 2011(4):53-59. (in Chinese).
[4] LUO YH.The microcosmic foundation of national food security: the grain production input behavior of rural household[J]. Prices Monthly, 2012(8):35-38. (in Chinese).
[5] TIAN T, LI LL, HUANG D,etal. What will be the force for future grain increase[J]. Chinese Rural Economy, 2015(6):13-22. (in Chinese).
 Asian Agricultural Research2016年5期
- Asian Agricultural Research的其它文章
- Establishment of Chinese Agricultural Brand Value Scale and Study of Its Reliability and Validity Based on Customer Value
- How to Develop Chinese Rural Tourism in the Context of New Urbanization?
- Chinese Customers’ WTP for Legal Digital Music Downloading
- High Standard Capital Farmland Construction Based on Grain Security
- Research on the Brand Construction of Agritourism Enterprise in Chongqing
- An Empirical Study on How to Intensively Use Land and Tap Land Potential in Ma’anshan City
